3.30 How to Evaluate a Strategy Beyond Net Profit
A strategy is more than net profit. The evaluation panel has 25 metrics across 7 categories. The panel reveals the failure axis. Headline numbers project away the operational info. Report all 25.
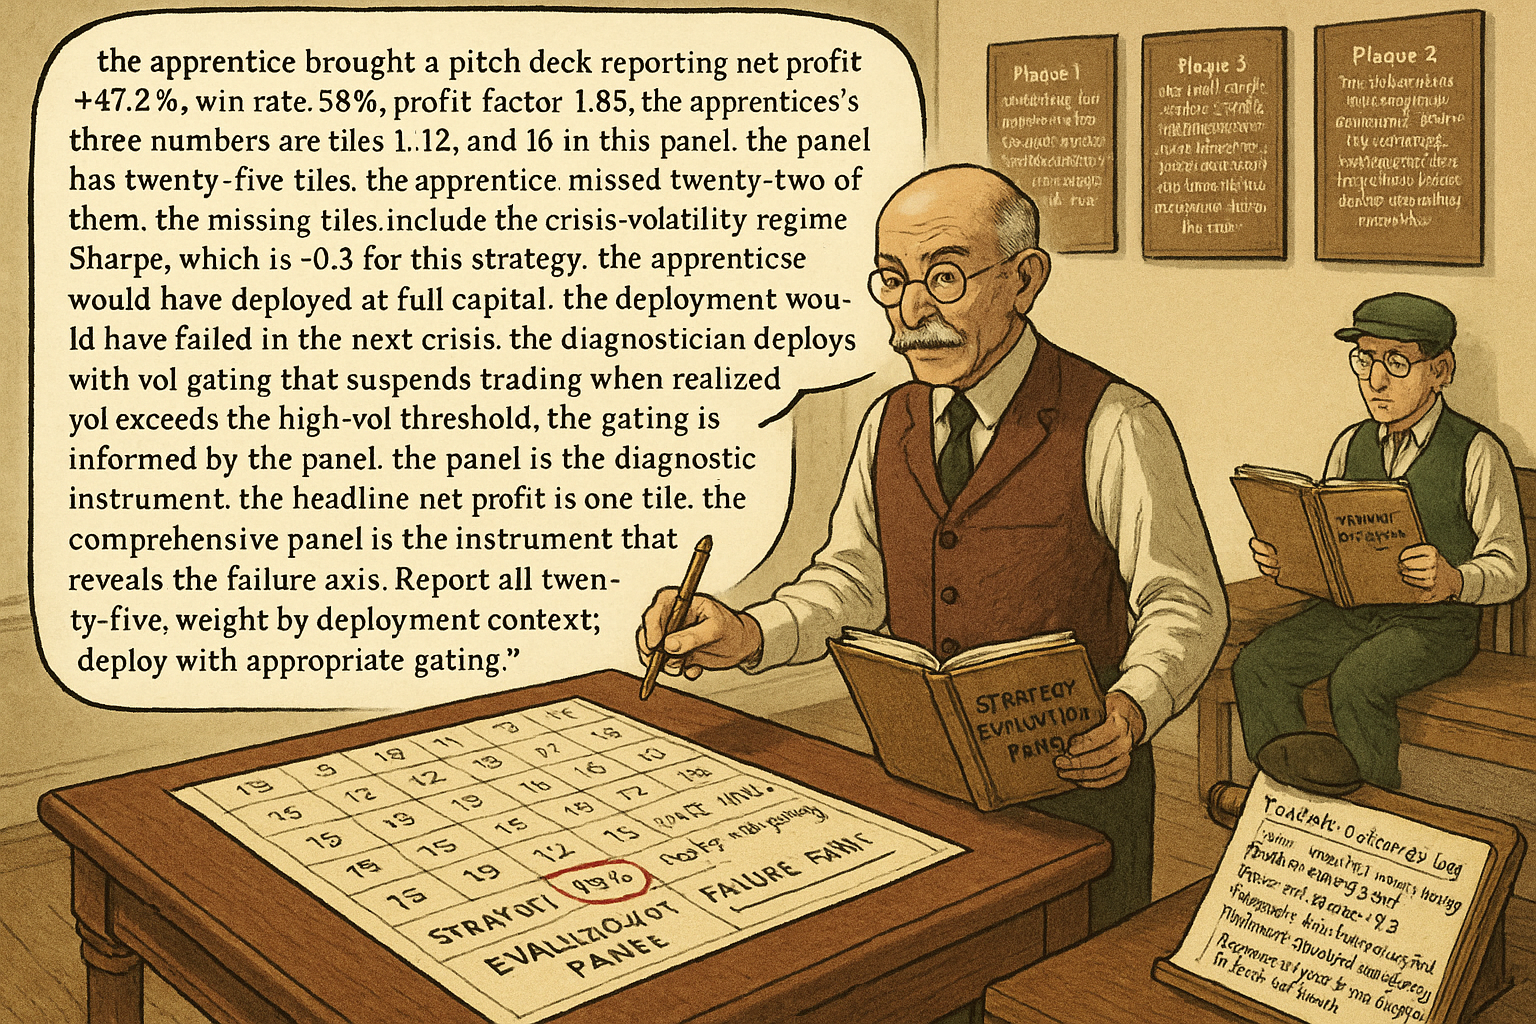
A pitch deck for a long-short equity strategy reports three numbers prominently: net profit of +47.2% over 5 years, win rate of 58%, profit factor of 1.85. The fund manager treats these as sufficient. The allocator who has been reading the prior articles in this pillar asks for the full evaluation panel. The pitch deck does not have one. The allocator declines to invest, not because the headline numbers are bad, but because the absence of a comprehensive evaluation suggests the manager has not done the work.
A strategy is not its net profit. A strategy is the joint distribution of (return path, risk profile, regime sensitivity, trade-level metrics, capacity, costs, and decay diagnostics). The headline numbers are projections of this distribution onto one or two axes; the projections discard most of the information. The articles in this pillar so far have covered specific projections: Sharpe ratio (article on trade-count requirements), drawdown distribution (Monte Carlo), MAE/MFE (trade-level path), profit factor (the previous article), regime stratification (regime-coverage article), parameter stability (Hill-Spike-Cliff article). This article gives the comprehensive evaluation panel that combines them. The panel has approximately 25 metrics organized into 7 categories. A strategy is deployment-ready when the panel as a whole supports the deployment, not when any one number does.
The article "Why Profit Factor Can Lie" framed one specific metric's failure mode. The present article gives the full panel. The article "The Backtest Integrity Checklist" later in this pillar gives the procedural checklist that ensures the panel was computed correctly.
The seven categories of strategy evaluation
Each category answers a different operational question.
Category 1: aggregate return metrics
The first-order projections of the return distribution.
Metric 1.1: net profit (CAGR or total return). The headline number. Useful as a sanity check; insufficient by itself.
Metric 1.2: Sharpe ratio (annualized). Excess return per unit of volatility. The article "Trade-Count Thresholds for Backtest Reliability" framed the standard error and required trade counts. Sharpe is the standard risk-adjusted return metric.
Metric 1.3: Sortino ratio. Excess return per unit of downside volatility. Useful when the return distribution is asymmetric. A high Sortino vs low Sharpe ratio means the volatility is mostly upside.
Metric 1.4: Calmar ratio. CAGR divided by maximum drawdown. Useful for comparing strategies' return-per-pain trade-off.
Category 2: drawdown metrics
The distribution of equity-curve declines.
Metric 2.1: maximum drawdown. The largest peak-to-trough decline in the equity curve. Single realization; not the operational ceiling.
Metric 2.2: bootstrap 95th and 99th percentile drawdown. From the bootstrap procedure in "Monte Carlo for Trading Systems". The realistic deployment ceiling.
Metric 2.3: average drawdown duration. The time spent below the previous equity peak, averaged across drawdown episodes. Long durations are operationally costly.
Metric 2.4: longest drawdown duration. The longest consecutive period below peak. The "psychological tolerance" requirement for deployment.
Metric 2.5: ulcer index. The square root of the average squared drawdown across the entire equity curve. A single number capturing the typical drawdown intensity, beyond the single worst case.
$$ \text{UI} = \sqrt{\frac{1}{T} \sum_{t=1}^{T} \left( 100 \cdot \frac{\text{Equity}_t - \text{Peak}_{[1, t]}}{\text{Peak}_{[1, t]}} \right)^2} $$
Category 3: trade-level metrics
The distribution of individual trade outcomes.
Metric 3.1: total trade count and effective N. From "Trade-Count Thresholds for Backtest Reliability". The denominator for any per-trade statistic.
Metric 3.2: win rate. The fraction of trades that are profitable. Useful when paired with the average win and average loss.
Metric 3.3: average win and average loss. The conditional means of winning and losing trades.
Metric 3.4: expectancy per trade. The unconditional mean of trade P&L. The fundamental edge.
Metric 3.5: profit factor and trimmed profit factor. From "Why Profit Factor Can Lie". The trimmed version is the operationally relevant.
Metric 3.6: Gini coefficient of trade P&L. Concentration index. Above 0.75 is a red flag.
Metric 3.7: distribution of R-multiples. The trade P&Ls expressed in units of average loss. The shape reveals the strategy's edge structure.
Category 4: trade-level path metrics
From "MAE/MFE Analysis: Seeing What Net Profit Hides".
Metric 4.1: MAE distribution. The distribution of maximum adverse excursions across trades.
Metric 4.2: MFE distribution. The distribution of maximum favorable excursions.
Metric 4.3: bounceback rate at the typical adverse threshold. The fraction of trades with large MAE that recover to be winners.
Metric 4.4: profit capture ratio. The ratio of average realized P&L to average MFE.
Category 5: regime sensitivity
From "Regime Coverage: Why Your Backtest Needs Different Market States" and "Volatility Regimes and Strategy Survival".
Metric 5.1: Sharpe stratified by volatility regime. Low-vol, normal-vol, high-vol, crisis-vol Sharpes.
Metric 5.2: Sharpe stratified by trend regime. Strong-trend, weak-trend, range-bound Sharpes.
Metric 5.3: Sharpe stratified by macro regime. Risk-on, risk-off, neutral Sharpes.
Metric 5.4: per-regime trade counts. Whether each regime has enough trades to support the per-regime estimate (typically 50+ trades per regime is the threshold).
Category 6: parameter and structural sensitivity
From "Parameter Stability Beats Best Parameter" and "The Hill, the Spike, and the Cliff: Reading Optimization Surfaces".
Metric 6.1: parameter-stability map. The IS Sharpe surface across parameters.
Metric 6.2: neighborhood Sharpe and variance. The stability of the chosen parameter.
Metric 6.3: perturbation table. IS Sharpe at +/-10%, +/-25%, +/-50% perturbations.
Metric 6.4: PBO from CSCV. From "CSCV: A Direct Probability of Backtest Overfit". The probability of overfit at the parameter-search level.
Category 7: capacity and cost
The deployment-realism metrics.
Metric 7.1: average daily trade volume. The total dollar volume traded per day.
Metric 7.2: capacity estimate. The maximum AUM at which the strategy can be deployed without significant market impact, typically 1-5% of average daily volume of the traded instruments.
Metric 7.3: per-trade cost (commission + slippage + spread). The realistic cost in basis points.
Metric 7.4: pre-cost vs post-cost Sharpe. The strategy with and without realistic costs. The article "Why Transaction Costs Should Be Added Before You Fall in Love" later in this pillar gives the discipline.
Using the panel
Three operational rules.
Rule 1: report all 25 metrics. Pitch decks that report only 3-5 of these are hiding the rest. A complete evaluation panel is the first artifact of a competent research process.
Rule 2: weight by deployment context. An allocator looking for a tail-hedge strategy will emphasize Categories 2 and 5 (drawdown and regime sensitivity); a long-biased equity allocator will emphasize Categories 1 and 7 (return and capacity); a high-frequency trader will emphasize Category 3 (trade-level) and Category 7 (cost). The same panel serves different decision criteria.
Rule 3: identify the failure axis. A strategy with Sharpe 1.2, drawdown 9%, regime-stratified Sharpes 1.4 / 1.0 / 0.5 / -0.2 has a clear failure axis: high-vol regimes. The deployment decision is then either "do not deploy" or "deploy with explicit high-vol gating". The panel reveals the failure axis; the headline net profit hides it.
A worked panel for a hypothetical strategy
For the long-short equity strategy from the opening:
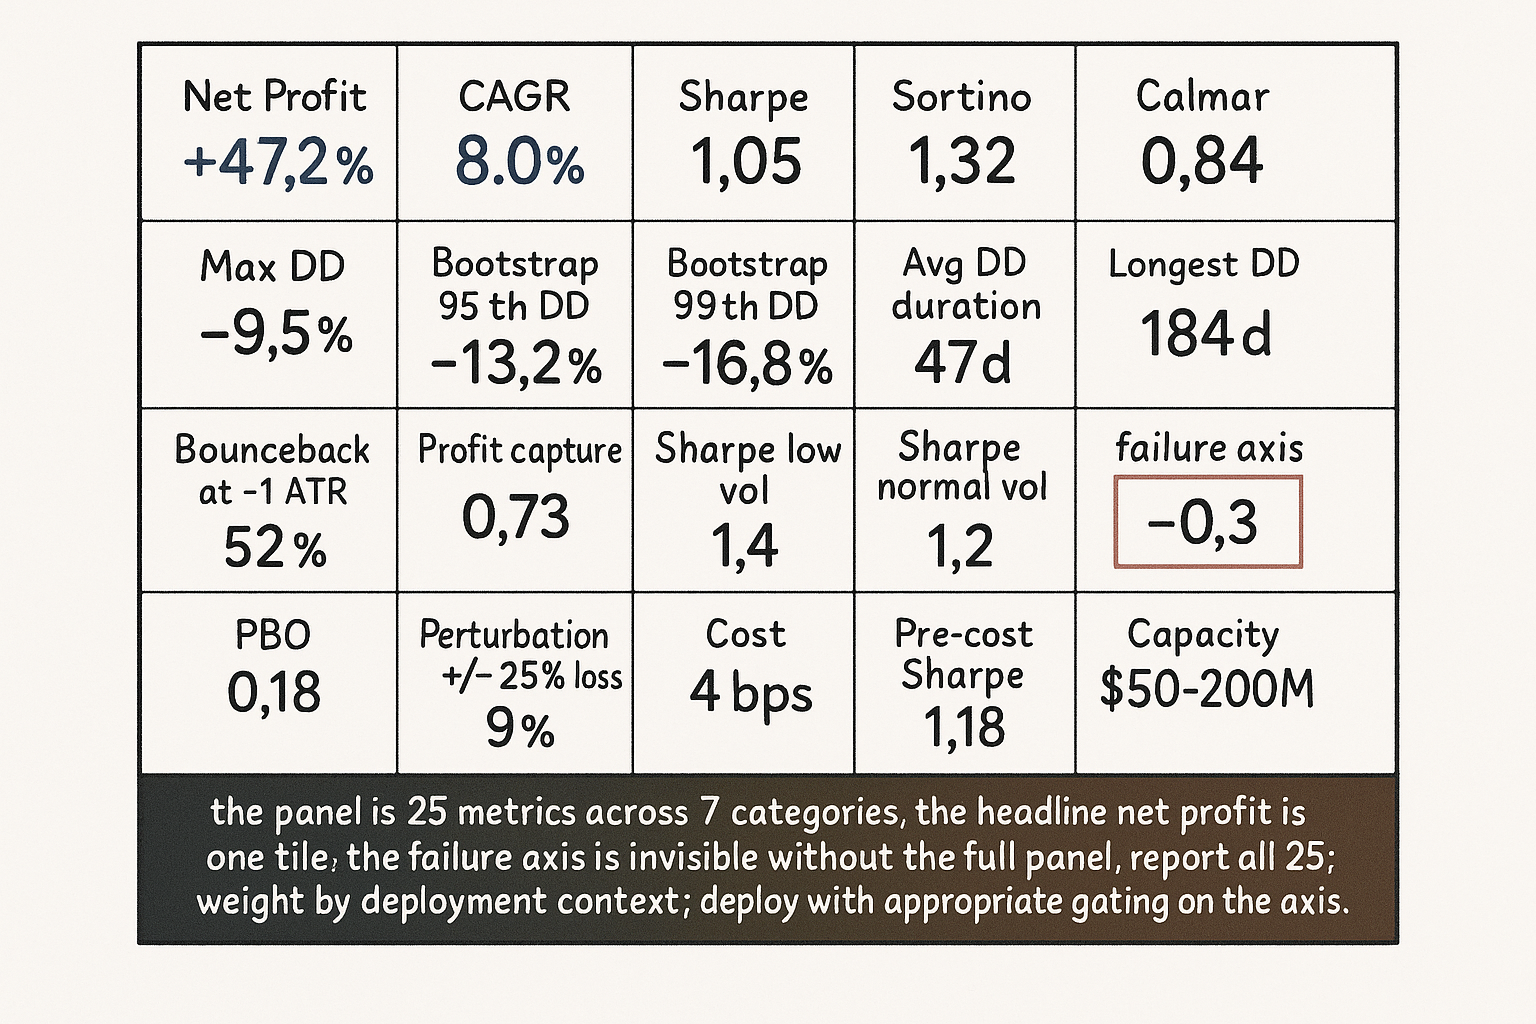
Category 1: Net profit +47.2%, CAGR 8.0%, Sharpe 1.05, Sortino 1.32, Calmar 0.84.
Category 2: Max DD -9.5%, Bootstrap 95th DD -13.2%, Bootstrap 99th DD -16.8%, average DD duration 47 days, longest DD duration 184 days, ulcer index 4.2.
Category 3: 1240 trades over 5 years, effective N approximately 1240 (rebalance count for cross-sectional factor strategies is the relevant N), win rate 58%, average win +0.47%, average loss -0.32%, expectancy +0.14% per trade, PF 1.85, trimmed-top-3 PF 1.78, Gini 0.51, R-multiple distribution roughly bell-shaped with mild right skew.
Category 4: MAE distribution mostly within 0 to -1.2 ATR, MFE distribution mostly within 0 to +1.5 ATR, bounceback rate at -1 ATR is 52%, profit capture ratio 0.73.
Category 5: Sharpe in low vol 1.4, normal vol 1.2, high vol 0.6, crisis vol -0.3. Sharpe in strong trend 1.4, weak trend 1.0, range-bound 0.7. Per-regime trade counts adequate for low/normal/high (200+ each); thin for crisis (40 trades).
Category 6: parameter-stability map shows broad hill at chosen parameter, neighborhood Sharpe 1.02 vs peak 1.05, perturbation +/-25% drops Sharpe by 9%, PBO 0.18.
Category 7: average daily trade volume $50M, capacity estimate $50-200M (1-5% of ADV), per-trade cost 4 bps, pre-cost Sharpe 1.18, post-cost Sharpe 1.05.
The reading. The strategy has a positive expectancy, robust across most regimes (Categories 1-4 are good), but the crisis-vol regime is a clear weakness and the high-vol Sharpe is below the deployment threshold. The deployment decision: deploy with explicit volatility gating (suspend trading when realized vol exceeds the high-vol threshold), tighter kill-switches, capacity-conservative sizing. Without the panel, the allocator might have deployed at full capital and been surprised by the crisis-vol underperformance.
Anti-patterns
Five mistakes specific to evaluation reporting.
Anti-pattern 1: reporting only Categories 1-3 (return, drawdown, trade-level aggregates). The path-level (Category 4), regime (Category 5), parameter sensitivity (Category 6), and capacity (Category 7) information is operationally critical and is absent in most retail pitch decks.
Anti-pattern 2: cherry-picking metrics. A team can report any subset of the 25 metrics. The right discipline is to report the full panel; the team's choice of which subset to highlight is a tell about what the team is hiding.
Anti-pattern 3: confusing "high score on every metric" with "good strategy". A strategy that has Sharpe 2.0, drawdown 3%, profit factor 4.0, and zero crisis-regime exposure is suspicious; either the metrics were computed on a sample that did not include crisis events or the strategy is overfit. Real strategies have realistic numbers across the panel; impossibly good numbers indicate methodology issues.
Anti-pattern 4: ignoring the per-regime trade counts in Category 5. A strategy with Sharpe 0.5 in crisis-vol with 5 trades carries no information about crisis-vol behavior. The cell shows a sample-size problem, not a performance signal.
Anti-pattern 5: not updating the panel as the strategy ages. Live trading produces additional data; the panel should be updated quarterly with the live data combined with the IS data. A strategy whose panel has not been updated in a year is undermonitored.
Decision matrix
| Reported metrics | Inference about the team | Allocator action |
|---|---|---|
| Only net profit, win rate, PF | Beginner-level pitch; team has not done full evaluation | Decline; ask for full panel |
| Categories 1, 2, 3 fully reported | Standard institutional pitch; basic competence | Continue evaluation, ask about Categories 4-7 |
| Categories 1-7 all reported with sources | Mature research team | Engage in deeper diligence |
| Categories 1-7 reported with confidence intervals and bootstraps | Sophisticated research team | Strong candidate for allocation |
| Per-regime breakdown showing failure axis | Team is honest about weaknesses | Trust more, allocate with appropriate gating |
| All metrics impossibly good | Methodology issue or fraud | Investigate or decline |
| Headline metrics good, missing trade-level path | Team has not done MAE/MFE | Ask for the path data |
| Headline good, missing parameter stability | Team has not done robustness | Ask for the surface map |
| Live updates after 6+ months | Team is monitoring | Trust the monitoring discipline |
| No live updates | Team is not monitoring | Investigate operational discipline |
The matrix is the allocator-side reading guide. The pattern: the panel completeness is itself the diagnostic of the team's competence and discipline.
Visualizing the panel
KEY POINTS
- A strategy is the joint distribution of return path, risk profile, regime sensitivity, trade-level metrics, capacity, costs, and decay diagnostics. The headline net profit is one projection of this distribution.
- The comprehensive evaluation panel has approximately 25 metrics organized into 7 categories: aggregate return (CAGR, Sharpe, Sortino, Calmar, net profit), drawdown (max, bootstrap percentiles, durations, ulcer index), trade-level (count, win rate, expectancy, PF and trimmed PF, Gini, R-multiples), trade-level path (MAE, MFE, bounceback, profit capture), regime sensitivity (Sharpe stratified by vol, trend, macro regimes), parameter and structural sensitivity (stability map, neighborhood Sharpe, perturbation table, PBO), capacity and cost (volume, capacity estimate, per-trade cost, pre-vs-post-cost Sharpe).
- A strategy is deployment-ready when the panel as a whole supports the deployment, not when any one number does. The headline net profit and Sharpe are necessary but not sufficient.
- Three operational rules: report all 25 metrics, weight by deployment context (different allocators emphasize different categories), identify the failure axis (the regime or parameter where the strategy underperforms).
- The example panel for a long-short equity strategy: most metrics positive, but Sharpe in crisis-vol regime is -0.3. The failure axis is crisis-vol. The deployment decision is "deploy with vol gating", not "do not deploy" and not "deploy at full capital".
- The panel completeness is itself a diagnostic of the research team's competence. A pitch with only Categories 1-3 (return, drawdown, trade-level aggregates) is missing the operationally critical information.
- Anti-pattern: cherry-picking metrics. The team's choice of which subset to report is a tell about what is hidden.
- Anti-pattern: confusing "high score on every metric" with "good strategy". Real strategies have realistic numbers across the panel; impossibly good numbers indicate methodology issues.
- Anti-pattern: ignoring per-regime trade counts. A regime with 5 trades is not informative; small-sample noise dominates.
- Anti-pattern: not updating the panel as the strategy ages. Live trading data should be incorporated quarterly into the panel; the panel becomes the operational monitoring artifact.
- Anti-pattern: applying the same threshold for "good" to every metric. Trend-following has different typical PF than mean reversion; equity has different typical drawdown durations than FX. The thresholds depend on the strategy family covered in "Market Personality: Why Gold, FX, Crypto, and Equities Need Different Systems".
- The current article gives the comprehensive evaluation panel. The next article in the publication ("Why Transaction Costs Should Be Added Before You Fall in Love") covers the cost discipline that determines whether the post-cost numbers in Category 7 are the right benchmarks.
References
- Testing and Tuning Market Trading Systems - Timothy Masters (Amazon)
- Data Mining Algorithms in C++ - Timothy Masters (Amazon)
- MarketSenseAI 2.0: Enhancing Stock Analysis through LLM Agents
- CSMD: Curated Multimodal Dataset for Chinese Stock Analysis - arXiv
- 1 Introduction - arXiv
- The GT-Score: A Robust Objective Function for Reducing Overfitting
- Asset Pricing in Transformer - arXiv
- FinKario: Event-Enhanced Automated Construction of Financial
- Deep Learning Enhanced Multi-Day Turnover Quantitative Trading
- Structural Market Behavior and Systematic Trading