8.1 Market Data Is Social Data: From Fractals to Topological Data Analysis
Prices are the residue of people arguing about value. Fractals, multifractals, sentiment, and topology all say the market is social, fat-tailed, and memory-laden. They describe wildness; they don't forecast it.

A price is a number two strangers agreed on for one instant before they disagreed again. Stack those instants into a chart and you are not looking at a physical process like temperature or rainfall. You are looking at the residue of people arguing about value, each with a different horizon, a different position, and a different fear. The participants disagree by construction, because a buyer and a seller hold opposite views and trade anyway, and that disagreement is what moves the tape. So the first claim of this whole pillar is blunt: market data is social data, and any model that forgets the humans gets the shape of the data wrong.
The shape it gets wrong is the tail. A century of price data shows violent moves far too often for the comfortable bell curve, with kurtosis that fat-tail thinking demands and the Gaussian forbids. The distribution of daily index returns is not normal, never has been, and the gap is not a rounding error. It is the difference between a model that says a 1987 or a 2008 happens once in the lifetime of the universe and a market that produces them every couple of decades.
The random walk, and why it breaks
Start with the model markets are usually taught through. Louis Bachelier put Brownian motion under prices in 1900, and the logic is clean: if a price showed an exploitable pattern, traders would arbitrage it away, so what remains is a Gaussian process with independent increments, a martingale wandering with no memory. The appeal is that it is tractable. You get closed forms, you get option prices, you get a tidy lattice of probabilities.
The trouble is the data refuses to live on that lattice. Four failures show up the moment you look at real series. The Gaussian underweights the size of typical moves, so real markets are wilder than it predicts. Large moves cluster in time rather than scattering independently, which a memoryless process cannot produce. Price changes carry identifiable structure that does not behave like a fair coin, which is why technical traders, for all the mysticism, are not chasing nothing. And the distribution itself drifts across decades, so the process is not even stationary. Mandelbrot made the point in 1963 and it still holds: the Brownian model is a beautiful object that does not describe the thing it claims to describe.
Mandelbrot's fractal turn
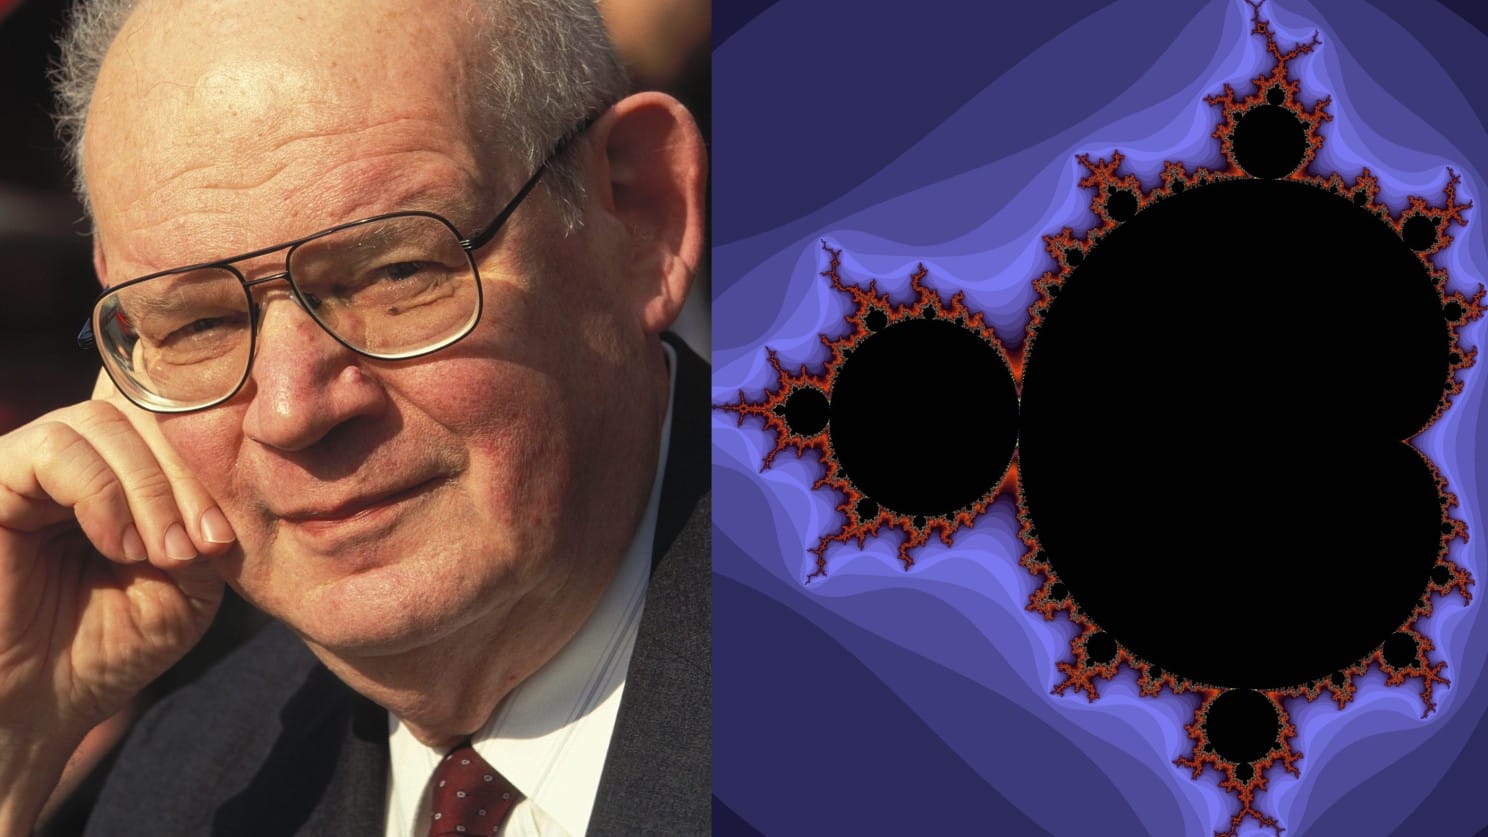
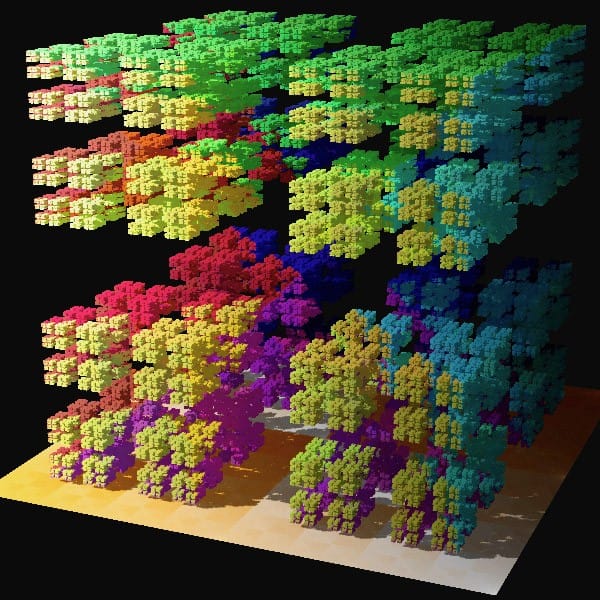
Mandelbrot's fix was to keep the randomness and change the geometry. A fractal is a shape that looks the same as you zoom, rough at every scale, with no length where it suddenly turns smooth. Coastlines do this. So do price charts: hide the axis labels and you cannot tell an hourly chart from a daily one, because the roughness repeats across scales. That self-similarity is not a metaphor here. It is a measurable property of the increments.
The 1997 Multifractal Model of Asset Returns, which Mandelbrot built with Fisher and Calvet, deforms clock time to capture two facts the Gaussian misses: returns show long memory, so calm and storm arrive in runs, and the tails stay heavy at every horizon. The way to test it is to measure how the moments of price changes scale with the time interval. Take the average of the absolute return raised to a power q, and watch how it grows as you stretch the interval.
$$ \mathbb{E}\big[\,|X(t+\Delta t) - X(t)|^{\,q}\,\big] \;\propto\; (\Delta t)^{\,\zeta(q)} $$
Read it plainly. The left side is the typical size of a q-th power of a move over a window of length delta-t. The right side says that size grows as the window raised to some exponent, zeta of q. We sweep q from small to large to probe the small moves and the extreme moves separately, and the whole question is the shape of zeta. For a plain random walk zeta is a straight line, equal to q over two, because one exponent governs all scales. For real markets zeta bends into a curve, and that curvature is the entire content of the word multifractal: it means no single Hurst exponent describes the series, the small moves and the large moves scale by different rules, and the heavy tails are baked into the scaling rather than glued on afterward. Mandelbrot's own summary was that price is a multiscaling process with long tails and long memory. Note what it does not claim. It describes the statistics of wildness. It does not forecast tomorrow.
The social-media era made the cause visible
Mandelbrot's work sat mostly ignored until 2008, when the Lehman collapse sent people hunting for any framework that took crashes seriously, and his book on the misbehavior of markets sold out. At the same moment a separate group stopped modeling the symptom and went after the cause: if prices are social data, measure the society directly.
Bollen and co-authors published "Twitter Mood Predicts the Stock Market" in 2010 and reported 86.7 percent accuracy calling the daily direction of the Dow from public mood. Treat that number with the skepticism it earns. It is one sample of one period, a short window, a single market, and a headline accuracy figure with no transaction costs, no out-of-sample wall, and every degree of freedom that sentiment pipelines quietly burn. The result is suggestive, not bankable, and the honest reading is that a signal showed up in one slice of history, which is where every overfit also shows up. What survives the skepticism is the mechanism, not the percentage. Khurshid Ahmad's framing is the durable part: the volatility clustering Mandelbrot spotted in 1963 has a source, and the source is information arrival, which in the modern market is a social conversation about the instrument. Volatility clusters because attention clusters.
Topology enters: shapes instead of distributions
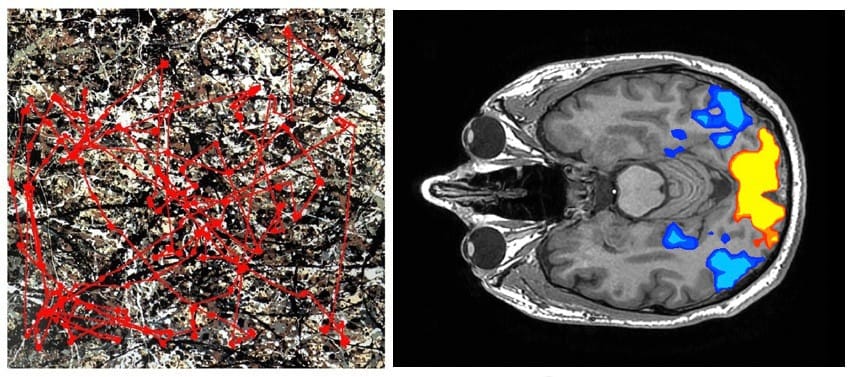
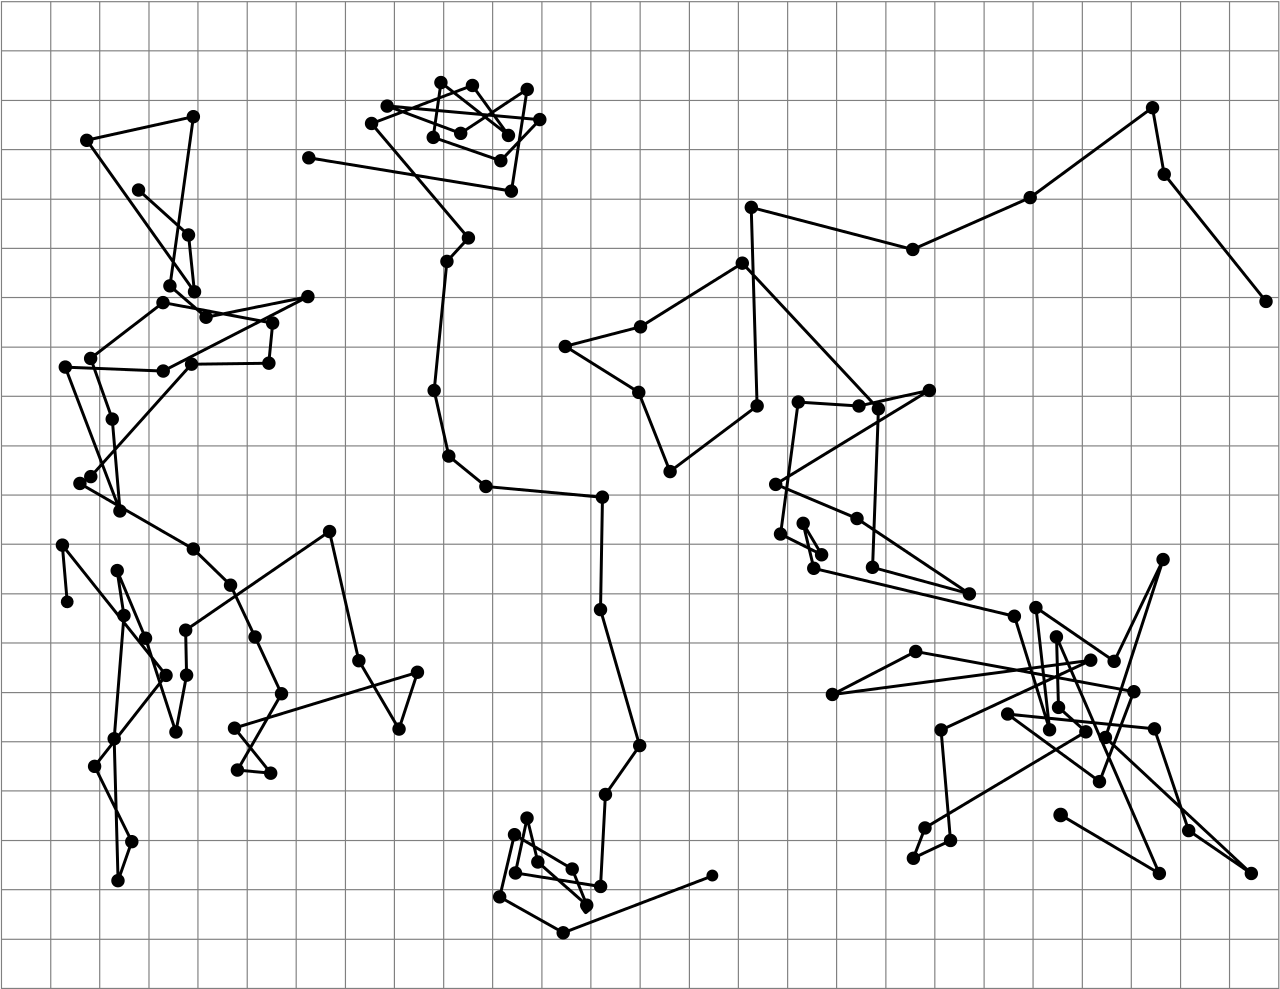
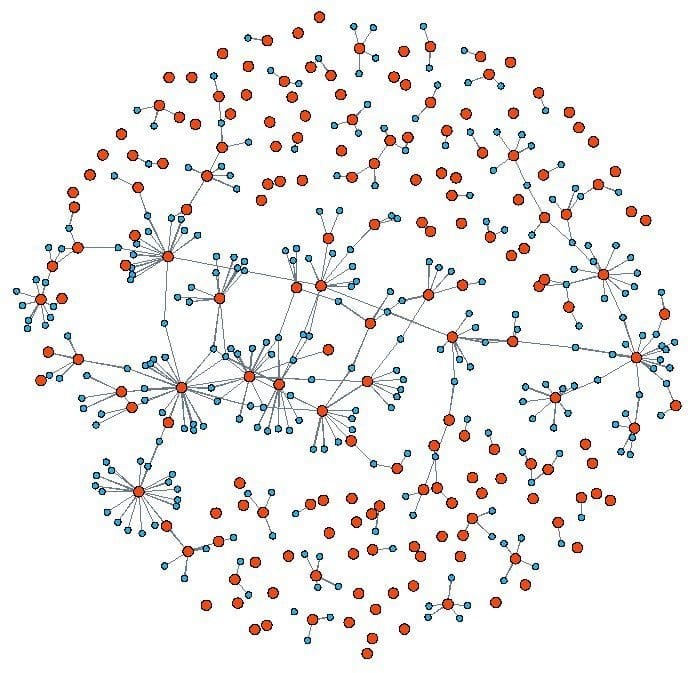
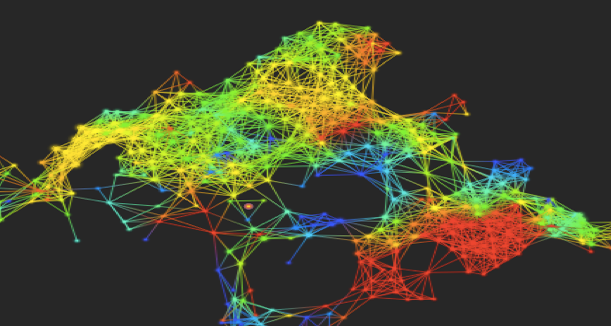
The 2010s added a third lens. Topological data analysis treats a stretch of multivariate price history as a cloud of points in high-dimensional space and asks about its shape, the loops and voids and connected pieces, rather than its distribution. Persistent homology records which of those features survive as you blur the cloud at coarser and coarser resolution, so noise dies fast and genuine structure persists. The selling point is robustness: the topology barely moves under small perturbations, which makes it a filter that passes structure and rejects jitter.
The headline result is that the loop-structure of the market grows agitated before a crash. Gidea and Katz showed persistence landscapes spiking ahead of the 2000 dot-com and 2008 collapses, and the giotto-tda library that Tauzin and colleagues built reproduces the exercise in Python. Hold the same line here as with the Twitter number. Calling two famous crashes after the fact, on data that contains those crashes, is an in-sample demonstration, and an early-warning index that lit up before the two events everyone already studies has not yet proven it will light up before the next one without crying wolf in between. The original telling of this story claims TDA plus machine learning can accurately predict future market activity. That oversells it. TDA gives a turbulence indicator, a measure that tends to rise as the correlation structure deforms toward a critical state, and a turbulence indicator is a warning, not a forecast. It belongs next to the variance-ratio and entropy diagnostics in this pillar, not above them.
What every layer agrees on
Schadner's 2021 multifractal fluctuation analysis closes the loop by measuring sentiment itself the way Mandelbrot measured prices, and it finds the same fingerprint: sentiment carries long memory, the multifractality comes from nonlinear correlations and fat tails, and the persistence is strongest when fear dominates. His split is greed against fear, and the asymmetry is the useful bit. When fear wins the market overreacts and the structure gets sharply persistent, and when optimism wins the series drifts back toward a random walk. Crashes are more structured than rallies, which is why the tools in this pillar earn their keep on the downside.
Line up the four lenses and they point at one thing. Mandelbrot says the geometry is rough and self-similar. Bollen says the roughness tracks a measurable social mood. Schadner says the mood is itself multifractal. The topologists say the same structure shows up as shape. None of them is selling a forecast. Mandelbrot, asked about prediction, said the first job is to describe, and his model delivers exactly that and stops. The geometry and the topology tell you the kind of system you are trading, one that is social, fat-tailed, memory-laden, and prone to phase transitions. They do not tell you the price on Friday, and the moment a vendor says they do, you are back in the overfit you started in. Treat the fractal-to-topology arc as the reason to respect the tails and size for them, which is the through-line of "Fat Tails: Why Gaussian Thinking Breaks Trading Systems" and "Why Financial Markets Are Complex Systems", not as a crystal ball.
KEY POINTS
- Market data is social data, the residue of participants with opposite views trading anyway, so any model that drops the humans gets the tail shape wrong.
- The Brownian random walk fails on four counts: moves are larger than Gaussian, they cluster in time, they carry structure unlike a coin toss, and the distribution drifts across decades.
- Mandelbrot's multifractal model keeps the randomness and fixes the geometry. Measure how moments scale with the time window, and the scaling exponent bends into a curve, which means heavy tails and long memory are built into the scaling, not added on.
- The Twitter-mood and TDA-crash results are in-sample demonstrations on famous events. The durable lesson is the mechanism, that volatility clusters because attention and information arrival cluster, not the headline accuracy figure.
- TDA produces a turbulence warning as the correlation structure deforms toward a critical state. That is a diagnostic alongside variance-ratio and entropy, not a forecast, and the "accurately predict" framing oversells it.
- Every lens agrees the market is social, fat-tailed, and memory-laden, and crashes are more structured than rallies. Use that to respect and size for the tails, not to claim you can time them.
References
- A Multifractal Model of Asset Returns - Mandelbrot, Fisher, Calvet (1997)
- Twitter Mood Predicts the Stock Market - Bollen, Mao, Zeng (2010)
- The Wisdom of Twitter Crowds - Azar, Lo
- Topological Data Analysis of Financial Time Series: Landscapes of Crashes - Gidea, Katz (2018)
- giotto-tda: A Topological Data Analysis Toolkit - Tauzin et al. (2020)
- On the Persistence of Market Sentiment: A Multifractal Fluctuation Analysis - Schadner (2021)
A note on AI. The ideas, research, analysis, and conclusions in this article are my own. I use AI tools to help with editing and wordsmithing, because English is not my first language, and I am not shy about that. AI-generated ideas and AI-assisted writing are not the same thing: the first is empty slop from a generic prompt, the second is a tool for communicating years of real research more clearly. Judge the work by its substance, not by whether software helped polish the prose.