6.9 The Difference Between Signal Quality and Portfolio Quality
A signal can predict well and still lose money. Signal quality grades the prediction; portfolio quality grades the harvested return. Measure both separately, because they fail in different places.
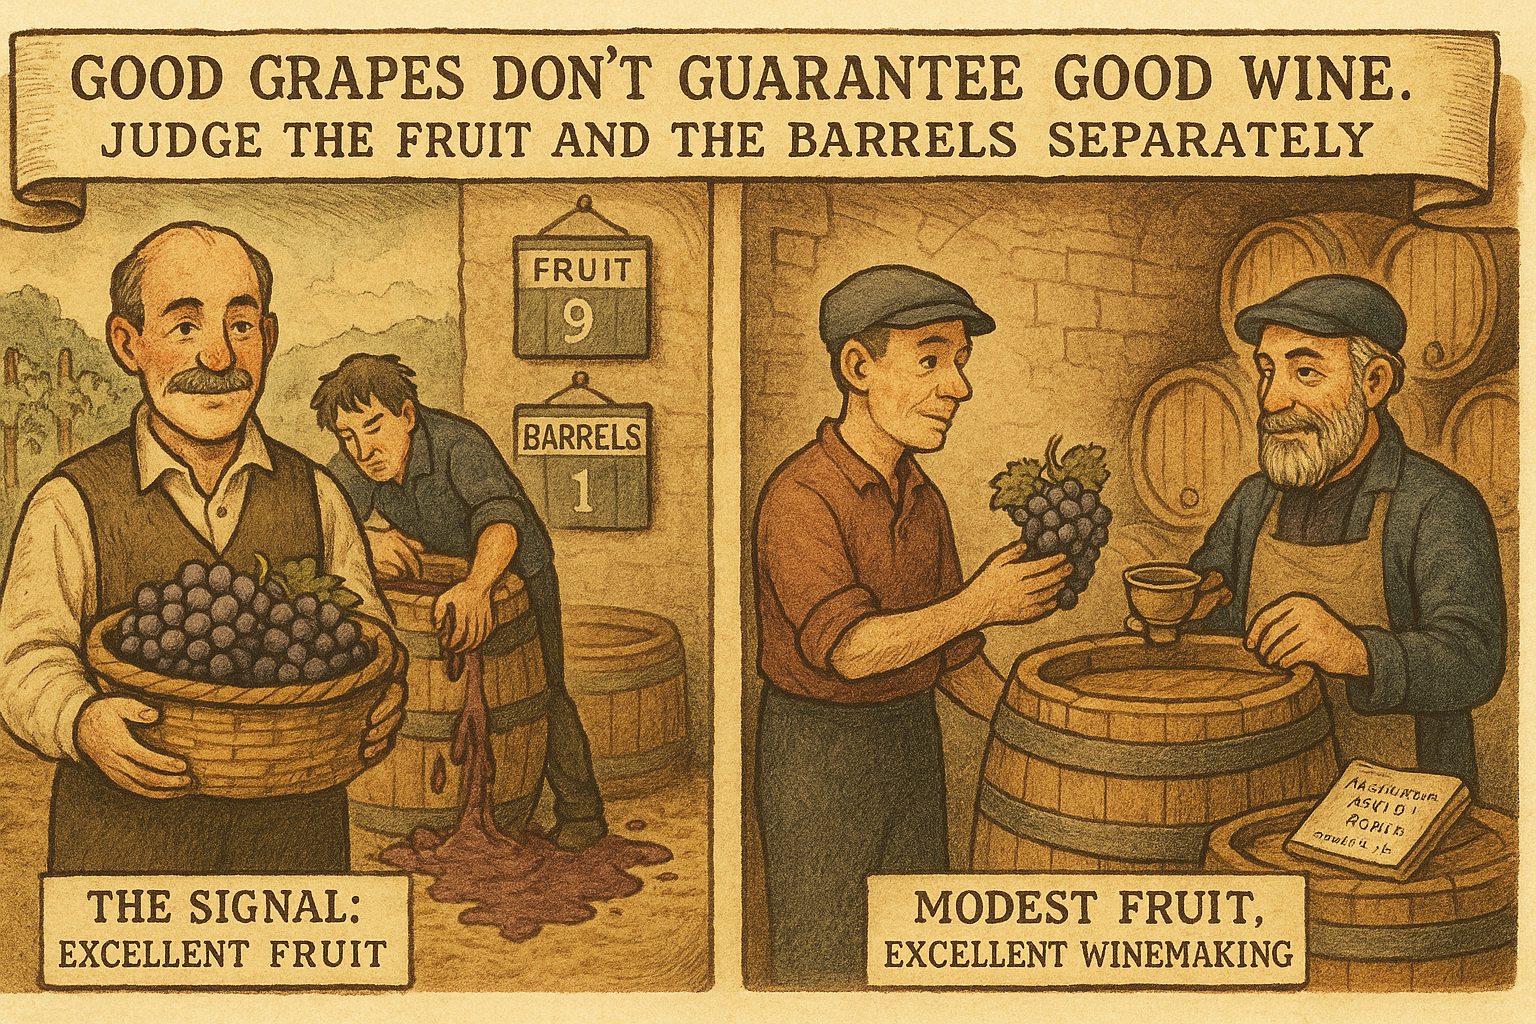
A signal can be excellent and the portfolio built on it can be garbage, and a mediocre signal can power a fine portfolio. These are two different quality dimensions, measured with different numbers, and conflating them is how traders fall in love with a high-hit-rate indicator that produces a flat, expensive equity curve. "Why Portfolio Construction Is Part of the Signal" argued that construction is part of the alpha; this draws the line between the two qualities so you know which one you are actually measuring when you look at a backtest.
Signal quality is about the prediction
Signal quality asks one question: does the indicator predict the thing it claims to predict? You measure it on the prediction itself, before any portfolio exists. The information coefficient, the correlation between the forecast and the subsequent return, is the canonical number. Hit rate, the fraction of calls that point the right way, is another. Rank correlation, from "Ranking Beats Forecasting for Many Trading Problems", is the right one for a ranking signal. All of these grade the signal in isolation: given the forecast, how well does reality follow it? A high information coefficient says the signal carries genuine information. It says nothing about whether you can make money on it.
The trap is that signal quality is necessary and nowhere near sufficient. An indicator with a beautiful information coefficient can still lose money, because the question of whether the prediction is right is separate from the question of whether you can harvest it. Plenty of statistically real signals are uncapturable: they predict moves smaller than the cost of trading them, or they fire only in names too illiquid to size, or they cluster their bets into one correlated factor so the apparent breadth is an illusion.
Portfolio quality is about the harvested return
Portfolio quality asks the other question: after construction, costs, and correlation, what does the actual return stream look like? You measure it on the realized P&L, with Sharpe ratio, drawdown, turnover, and the cost-adjusted return. A good portfolio has a high Sharpe because its bets are genuinely diversified, a tolerable drawdown because risk is not concentrated, and a return that survives realistic costs because turnover is controlled. These numbers depend on the construction as much as the signal, which is the whole point of separating them.
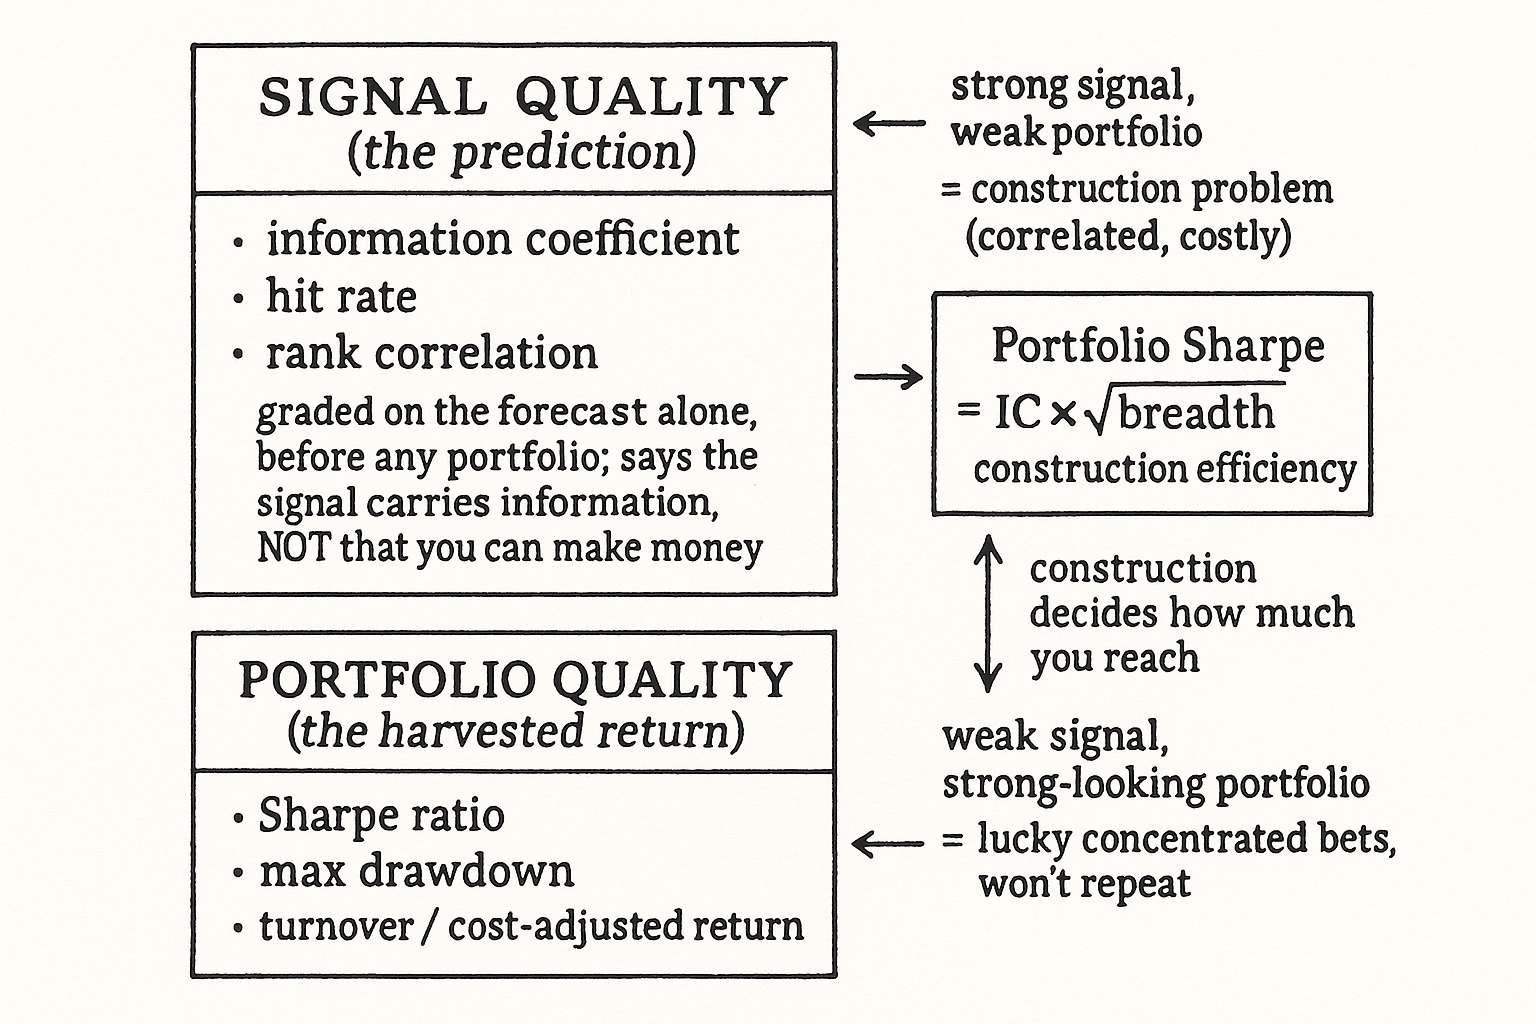
$$ \text{SR}_{\text{portfolio}} \approx \text{IC} \times \sqrt{\text{breadth}} \times (\text{construction efficiency}) $$
A rough decomposition makes the relationship concrete. The portfolio Sharpe is roughly the information coefficient (signal quality) times the square root of breadth (how many genuinely independent bets you make) times a construction efficiency factor (how well the build captures the signal without leaking it to costs and correlation). The fundamental law of active management is the first two terms; the third is everything this pillar has been about. A high IC with low breadth, ten correlated bets pretending to be ten independent ones, gives a poor Sharpe. A modest IC spread across many independent bets and built efficiently gives a strong one. The signal sets the ceiling; the construction decides how much of the ceiling you reach.
Why you measure both, separately
Keep the two scorecards apart because they fail for different reasons and you fix them in different places. A weak portfolio with a strong signal is a construction problem: your bets are correlated, your costs are eating the edge, your sizing is concentrated. You fix it in the portfolio layer, not by hunting for a better signal. A strong-looking portfolio with a weak signal is a different and more dangerous case, usually a sign that the backtest's return came from a few lucky concentrated positions rather than from the signal's breadth, and it will not repeat. Reporting only the blended backtest hides which of these you have. Report the signal's information coefficient and breadth alongside the portfolio's Sharpe and costs, and you can see whether the strategy works because the prediction is good, because the construction is good, or because you got lucky in-sample.
Visualizing the two qualities
KEY POINTS
- Signal quality and portfolio quality are different dimensions measured with different numbers. A great signal can power a garbage portfolio, and a mediocre signal can power a fine one.
- Signal quality grades the prediction in isolation with information coefficient, hit rate, or rank correlation. A high information coefficient says the signal carries information, not that you can make money on it.
- Many statistically real signals are uncapturable: they predict moves smaller than trading costs, fire only in illiquid names, or cluster their bets into one correlated factor so the breadth is an illusion.
- Portfolio quality grades the realized return with Sharpe, drawdown, turnover, and cost-adjusted return. These depend on construction as much as on the signal.
- Portfolio Sharpe decomposes roughly into information coefficient times the square root of breadth times construction efficiency. The signal sets the ceiling; the construction decides how much of it you reach.
- Measure both separately because they fail for different reasons. A weak portfolio with a strong signal is a construction problem; a strong portfolio with a weak signal is usually lucky concentrated bets that will not repeat.
References
- Systematic Trading - Robert Carver (Amazon)
- Trading Systems - Urban Jaekle Emilio Tomasini (Amazon)
- Managing Portfolio Turnover: An Empirical Study
- Portfolio Design and Portfolio Performance: The Individual Investor
- When Do Systematic Strategies Decay?
- Volatility spillover among the sectors of emerging and developed
- Alpha Decay and Institutional Trading
- Transaction Costs, Portfolio Characteristics, and Mutual Fund
- A PRIMER FOR INVESTMENT PROFESSIONALS
- Machine Traders, Human Behavior, and Model (Mis)Specification
- How Variation in Signal Quality Affects Performance
- Constructing Long-Only Multifactor Strategies: Portfolio Blending vs. Signal Blending
- Integrated Alpha Modeling
- The Information Ratio
- How Much Information Is Required to Time the Market?
- The Impact of Volatility Targeting
- Trade Sizing Techniques for Drawdown and Tail Risk Control
- Sharpe (Ratio) Thinking about the Investment Opportunity Set and
A note on AI. The ideas, research, analysis, and conclusions in this article are my own. I use AI tools to help with editing and wordsmithing, because English is not my first language, and I am not shy about that. AI-generated ideas and AI-assisted writing are not the same thing: the first is empty slop from a generic prompt, the second is a tool for communicating years of real research more clearly. Judge the work by its substance, not by whether software helped polish the prose.