3.25 Parameter Stability Beats Best Parameter
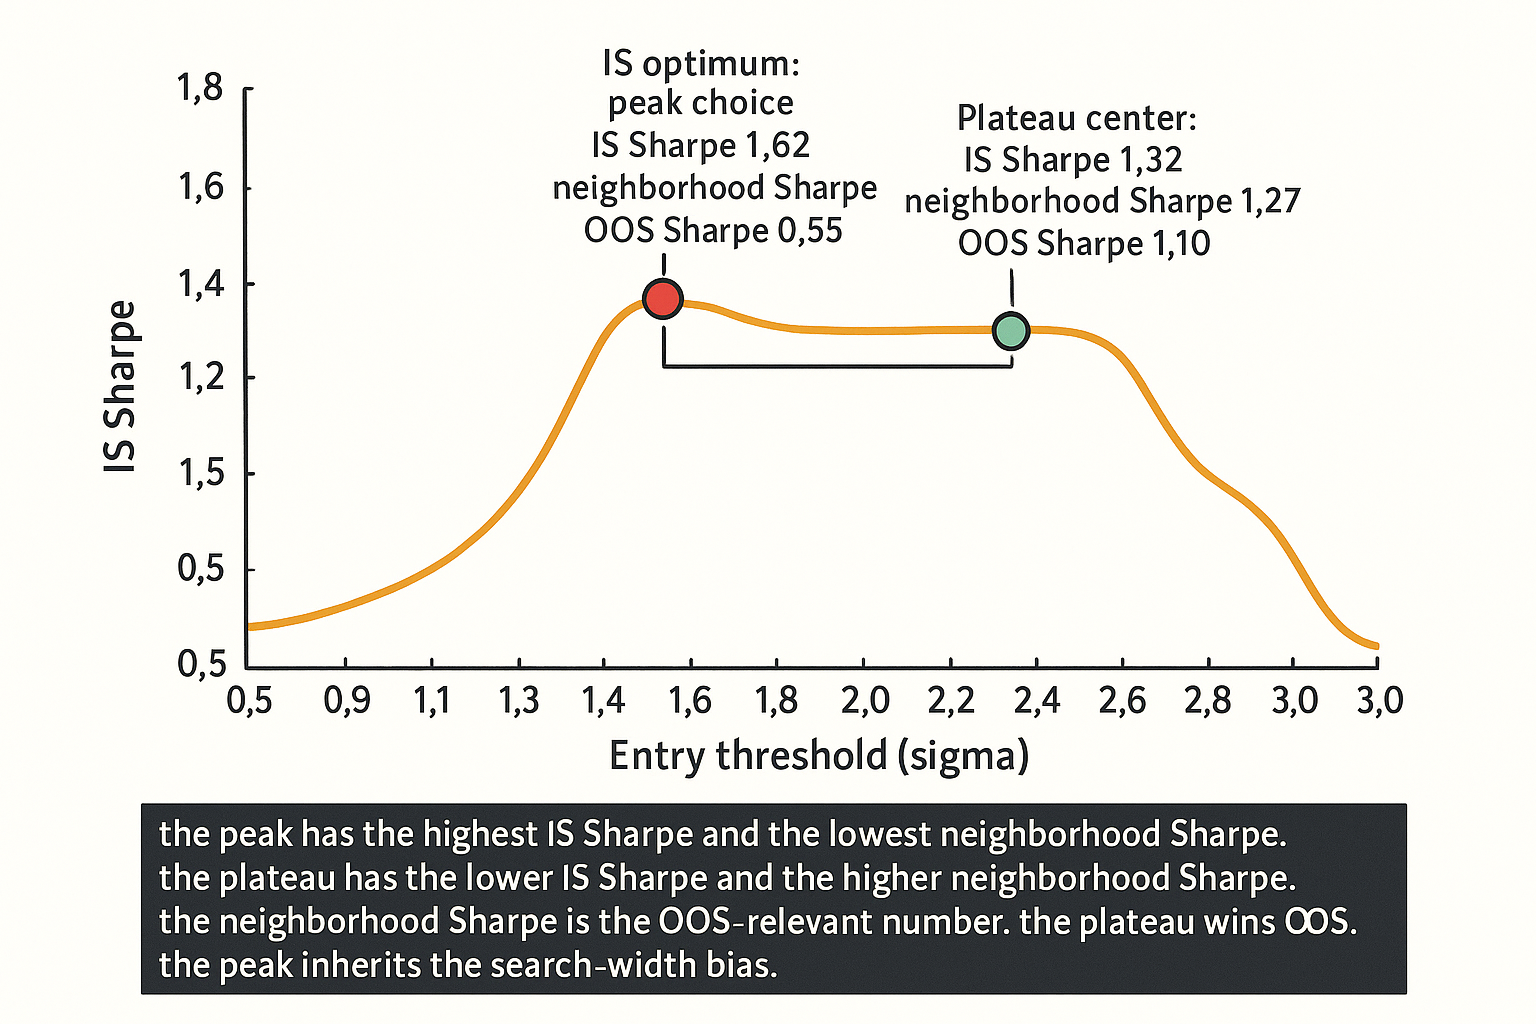
The IS-optimum is the peak. The plateau is a wide region of similar Sharpes. Pick the plateau center. Peak inherits search-width bias; plateau does not. Lower IS, higher OOS. Pick the plateau.
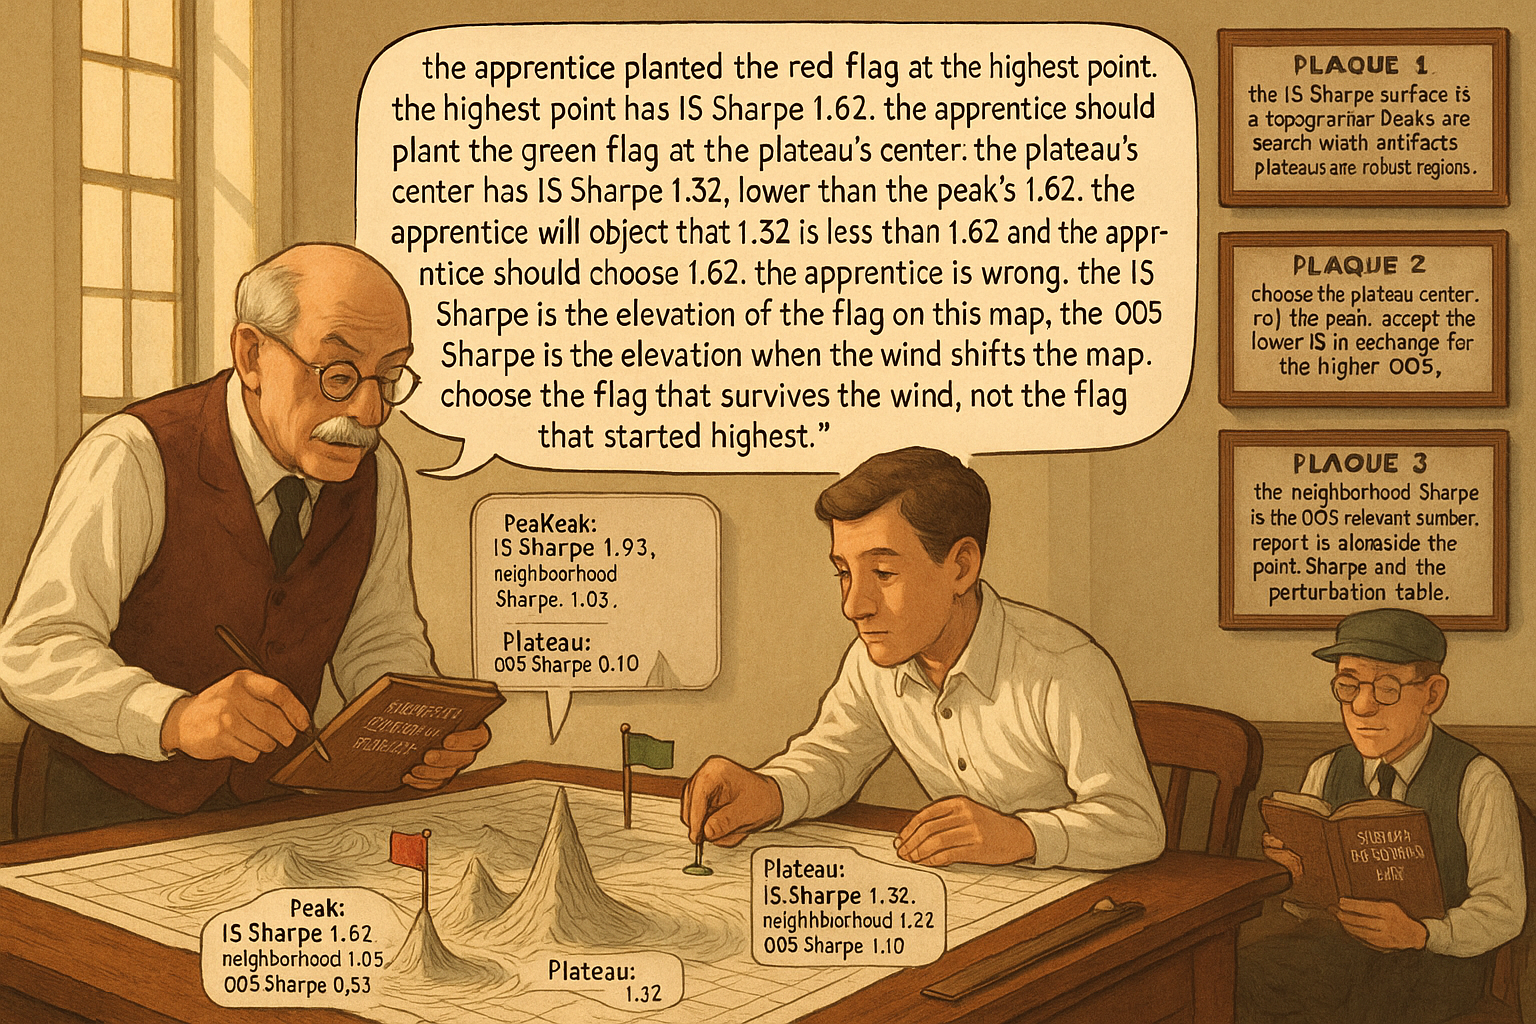
A team optimizes a momentum strategy on a basket of futures. The optimization searches over entry-threshold values from 0.5 to 3.0 sigma in steps of 0.1, producing 26 candidate values. The IS-best entry threshold is 1.4 sigma, with IS Sharpe 1.62. The team plots the IS Sharpe as a function of entry threshold and observes the curve: the Sharpe is approximately 0.8 at threshold 0.5, climbs across the range, peaks at 1.62 at threshold 1.4, drops to 1.20 at threshold 1.5 (a 26% Sharpe loss from a 0.1-sigma move), and falls to 0.7 at threshold 2.0. The peak at 1.4 is narrow and isolated. The team deploys with threshold 1.4. Three years later, the live Sharpe is 0.55. The team's post-mortem traces the underperformance to the parameter being on a sharp peak; small drifts in the underlying volatility shifted the strategy's effective entry threshold (in standardized units) and the strategy operated on the steep edge of the peak rather than at its top.
A different team optimizes the same strategy on the same data and arrives at a different conclusion. Their plot shows the IS Sharpe vs entry threshold, identifies the same peak at 1.4 with Sharpe 1.62, but also notices a wider plateau between thresholds 1.8 and 2.4 where the Sharpe is approximately 1.30 with very gentle gradient. They choose threshold 2.1 (the center of the plateau) and accept an IS Sharpe of 1.32 instead of the peak's 1.62. The deployment three years later produces a live Sharpe of 1.10. The plateau choice survived the underlying drift; the peak choice did not.
The article "The Difference Between Robustness and Optimization" framed the conceptual difference between climbing the peak and choosing the plateau. This article gives the operational tools for parameter selection: how to map the optimization surface, how to identify plateaus versus peaks, and how to select the parameter from the plateau region rather than from the IS maximum. The technique is older than the academic literature on it; experienced systematic traders have been using parameter-stability mapping for decades, even if the formal frameworks are recent. The article "The Hill, the Spike, and the Cliff: Reading Optimization Surfaces" later in this pillar gives the visual taxonomy of surface shapes; the present article gives the selection discipline.
Stability, defined operationally
Three measurable properties of a candidate parameter set.
Property 1: neighborhood Sharpe. Define a neighborhood around the candidate parameter (e.g., +/-25% of the parameter value, or the nearest 5 grid points on each side). Compute the average IS Sharpe across all parameter sets in the neighborhood. The neighborhood Sharpe is the right number to compare across candidates; a candidate with high point Sharpe but low neighborhood Sharpe is on a peak. A candidate with similar point Sharpe and similar neighborhood Sharpe is on a plateau.
$$ \bar{\text{SR}}_{\mathcal{N}}(\theta_0) = \frac{1}{|\mathcal{N}(\theta_0)|} \sum_{\theta \in \mathcal{N}(\theta_0)} \widehat{\text{SR}}_{\text{IS}}(\theta) $$
The neighborhood N(theta_0) is the set of parameter values within the chosen perturbation radius.
Property 2: Sharpe gradient. The slope of the IS Sharpe surface at the candidate parameter, in each parameter direction. A flat gradient means the parameter is at a plateau. A steep gradient means the parameter is on the side of a peak (which is fragile) or at the bottom of a valley (which is also fragile in the opposite direction).
Property 3: Sharpe variance in the neighborhood. The variance of the Sharpes in the neighborhood. A small variance with a high mean is a plateau (good). A small variance with a low mean is a flat-bad region (avoid). A large variance is a peak-and-cliff region (avoid).
The selection rule. Choose the parameter set that maximizes the neighborhood Sharpe, subject to a minimum variance threshold (the plateau is wide enough to be informative). Reject parameters with point Sharpe much higher than neighborhood Sharpe (peaks).
Mapping the optimization surface
Five practical steps.
Step 1: choose the parameter axes to map. Most strategies have 2-5 parameters that matter for the optimization. Pick the parameters; ignore parameters with structurally fixed values (e.g., a position-cap from risk policy is not a parameter to optimize over).
Step 2: define a grid for each parameter. The grid should span the structurally plausible range with resolution fine enough to distinguish plateaus from peaks. For a numerical parameter like entry threshold, 25-50 grid points across the plausible range is typical.
Step 3: run the strategy at each grid point. For 2 parameters with 25 grid points each, the surface has 625 points. For 3 parameters, 15625 points. Computational cost grows quickly; for 4+ parameters, use a Latin hypercube or similar sparse sampling rather than full grid.
Step 4: visualize the surface. For 1 parameter, plot Sharpe vs parameter value (a line plot). For 2 parameters, plot the surface as a heatmap or contour plot. For 3+ parameters, plot the marginal surfaces (Sharpe vs each parameter, with others held at their plateau-center) or use slice plots.
Step 5: identify candidate plateau regions. Look for areas where the Sharpe is approximately constant across a wide range. Mark the center of each plateau. Compute the neighborhood Sharpe and variance at each candidate. Choose the plateau with highest neighborhood Sharpe.
Cases where the plateau loses IS Sharpe
The trade-off explicitly. The plateau-center parameter typically has IS Sharpe 10-30% below the peak parameter. The OOS Sharpe of the plateau choice is typically 5-15% below its IS Sharpe. The OOS Sharpe of the peak choice is typically 40-70% below its IS Sharpe. For typical search-width and noise levels, the plateau OOS exceeds the peak OOS, even though the peak IS exceeds the plateau IS.
A simple model. Let SR_peak = SR_true_peak + noise_peak, SR_plateau = SR_true_plateau + noise_plateau. The peak's noise_peak is large because the peak is the maximum over the local search; the plateau's noise_plateau is small because the plateau is averaged over many comparable parameters.
$$ \mathbb{E}[\text{SR}_{\text{OOS}}^{\text{plateau}}] - \mathbb{E}[\text{SR}_{\text{OOS}}^{\text{peak}}] = (\text{SR}_{\text{true}}^{\text{plateau}} - \text{SR}_{\text{true}}^{\text{peak}}) + \text{search-width-bias}_{\text{peak}} $$
The first term is typically negative (the peak's true Sharpe is slightly higher than the plateau's). The second term is typically positive and large (the peak inherits the search-width bias). For most strategies, the second term dominates, and the plateau wins OOS.
The discipline. Accept the lower IS Sharpe in exchange for the higher OOS Sharpe. The article "Optimization Comes After Testing, Not Before" framed the procedural sequence; parameter-stability selection is the Stage 4 small-final-optimization that anchors to the plateau rather than the peak.
Reporting parameter selection
Three artifacts that should accompany the chosen parameter.
Artifact 1: the parameter-stability map. The plot of IS Sharpe across the parameter range, with the peak and the chosen plateau marked. The map allows the reader to verify the plateau exists and to assess how flat it is.
Artifact 2: the neighborhood Sharpe and its variance. The chosen parameter's neighborhood Sharpe, the peak's neighborhood Sharpe, and the difference. Any reader should see that the chosen parameter has a higher neighborhood Sharpe than the peak (the peak's narrow neighborhood pulls the average down by 0.3 to 0.5 Sharpe units).
Artifact 3: the perturbation table. A table showing the IS Sharpe at the chosen parameter and at +/-10%, +/-25%, +/-50% perturbations. A robust choice has gentle declines under perturbation. A fragile choice has steep declines. The right deployment threshold: the chosen parameter loses no more than 25% of its IS Sharpe under +/-25% perturbation.
Anti-patterns
Five mistakes specific to parameter selection.
Anti-pattern 1: reporting only the IS-optimal parameter without the surface. The IS optimum is one number from a continuous surface. Without the surface, the reader cannot tell whether the optimum is on a plateau (robust) or a peak (fragile). The surface map is the minimum required artifact.
Anti-pattern 2: confusing a plateau with a flat-bad region. A range of parameter values producing similar low Sharpes is a flat-bad region where the strategy does not work. A plateau requires high mean Sharpe. The plateau must have high mean Sharpe with low variance. Flat-bad regions have low mean Sharpe with low variance.
Anti-pattern 3: choosing the plateau and then optimizing within it. The plateau center is the choice; further optimization within the plateau re-introduces search-width bias. Pick the center and stop.
Anti-pattern 4: applying parameter-stability mapping only on one parameter while optimizing the others. The mapping is multi-dimensional. Mapping only the entry-threshold while optimizing the exit-threshold and the vol-target leaves the strategy on a peak in the joint surface. The mapping should cover all parameters that matter.
Anti-pattern 5: ignoring the structural prior in plateau selection. Among multiple plateaus on a surface, choose the one whose center is closest to the structural prior (academic literature, mechanism, cross-asset analog). Choosing the highest-Sharpe plateau without regard to structural prior is a softer version of search-width-bias inflation.
Decision matrix
| Surface diagnostic | Interpretation | Action |
|---|---|---|
| Single wide plateau, high mean, low variance | Robust strategy, single clear choice | Pick plateau center |
| Single narrow peak, high mean, with cliffs on both sides | Fragile strategy, peak is search-width artifact | Reject; search the surface for a plateau or accept exploratory status |
| Multiple plateaus | Strategy has regime-dependent optima | Choose the plateau closest to structural prior, deploy with regime gating |
| Wide flat-bad region (high variance, low mean) | Strategy does not work in this parameter range | Search elsewhere |
| Steep gradient with no clear plateau | Strategy is on a slope, not at an optimum | Likely has fundamental design issue |
| IS-optimum loses >25% Sharpe under +/-25% perturbation | Fragile choice | Reject |
| IS-optimum loses <10% Sharpe under +/-25% perturbation | Robust choice | Deploy |
| Neighborhood Sharpe > 80% of peak Sharpe | Plateau is broad enough | Deploy at plateau center |
The matrix maps surface shape to action. The pattern: map the surface, find the plateau, choose the center.
Visualizing parameter-stability mapping
KEY POINTS
- Parameter selection should choose the center of a plateau in the IS-Sharpe surface, not the IS maximum. The plateau choice typically has IS Sharpe 10-30% below the peak but OOS Sharpe 40-70% above the peak's OOS, because the peak inherits the search-width bias and the plateau does not.
- Three measurable properties of a candidate parameter: neighborhood Sharpe (mean across +/-25% or nearest 5 grid points), Sharpe gradient (slope at the candidate, flat for plateau, steep for peak), Sharpe variance in the neighborhood (small variance + high mean = plateau).
- The selection rule: maximize neighborhood Sharpe subject to a minimum-variance threshold. Reject candidates with point Sharpe much higher than neighborhood Sharpe (these are peaks).
- Five steps to map the surface: choose parameter axes, define grids, run the strategy at each grid point, visualize as line / heatmap / marginal plots, identify plateau regions and pick the highest-mean plateau.
- The OOS-Sharpe gap between the plateau choice and the peak choice is approximately the search-width bias of the peak minus the small true-Sharpe gap between plateau and peak. For typical bias magnitudes, the plateau wins OOS by a substantial margin.
- Three required reporting artifacts: the parameter-stability map (the plot of IS Sharpe across parameters), the neighborhood Sharpe of the chosen parameter (versus the peak), the perturbation table (IS Sharpe at +/-10%, +/-25%, +/-50%).
- Operational deployment threshold: the chosen parameter should lose no more than 25% of its IS Sharpe under +/-25% perturbation. A robust choice loses <10%; a fragile choice loses >40%.
- Anti-pattern: reporting only the IS-optimum without the surface. The surface is the minimum required artifact for assessing robustness.
- Anti-pattern: confusing a flat-bad region with a plateau. A plateau has high mean Sharpe and low variance; a flat-bad region has low mean and low variance.
- Anti-pattern: optimizing within the plateau after choosing it. Pick the center and stop; further optimization re-introduces bias.
- Anti-pattern: stability mapping on one parameter while optimizing others. The mapping is multi-dimensional.
- Anti-pattern: ignoring structural prior in plateau selection. Among multiple plateaus, choose the one closest to the prior.
- The current article gives the parameter-selection discipline. The next article in the publication ("The Hill, the Spike, and the Cliff: Reading Optimization Surfaces") gives the visual taxonomy of common surface shapes and what each implies for the strategy.
References
- Testing and Tuning Market Trading Systems - Timothy Masters (Amazon)
- Data Mining Algorithms in C++ - Timothy Masters (Amazon)
- Backtest Overfitting in the Machine Learning Era
- Predictive Value of Within-Strategy Permutation Tests for Forward Performance of Trading Systems
- AlgoXpert Alpha Research Framework: A Rigorous IS–WFA–OOS Pipeline for Systematic Trading Strategies
- A Novel Approach to Trading Strategy Parameter Optimization Using Walk-Forward Analysis
- The Sharpe Stability Ratio: Temporal Consistency of Risk‑Adjusted Performance in Quantitative Trading
- How to Use the Sharpe Ratio
- arXiv:2209.05559v6 [q-fin.ST] 31 Jan 2023
- Development of a Monte Carlo based robustness calculation and