3.15 Optimization Comes After Testing, Not Before
Right order: hypothesis, prototype at structural priors, parameter-stability map, then small validated optimization. Optimization first is search-width bias dressed as rigor. Test first, then tune.
A research team has an idea: cross-sectional momentum on US large-caps with vol-conditioned position sizing. The team has two choices for how to spend the next three months. Path A: implement the strategy with structural-prior parameters (12-month lookback, monthly rebalance, equal-vol sizing, 100 stocks long top decile, 100 short bottom decile), run the backtest from 1995 to 2024 with the same parameters, and look at the result. The implementation takes one week. The remaining eleven weeks go into diagnostics, regime stratification, robustness checks, and post-mortem analysis. Path B: implement the strategy with a parameter-search framework, optimize across lookbacks (3, 6, 9, 12, 18, 24 months), rebalance frequencies (weekly, monthly, quarterly), decile widths (top/bottom 5%, 10%, 20%), vol-target levels (8%, 10%, 12%, 15%), and shorting policies (long-only, market-neutral, dollar-neutral, beta-neutral). Path B takes three months and produces a parameter set with IS Sharpe 1.4. Path A produces an IS Sharpe of 0.65 at structural-prior parameters.
Most teams choose Path B. The path produces a more impressive number, looks more "rigorous" because it has a parameter-search framework, and fits the format expected by published research. The teams that choose Path A consistently outperform the teams that choose Path B in OOS deployment, by a margin that scales with the search width Path B used. The article "The Difference Between Robustness and Optimization" gave the conceptual reason: optimization climbs to the noisy peak. This article gives the procedural reason: optimization performed at the wrong stage of the research process compounds the problem with a worse one. Path A spends 90% of the time on diagnostics that reveal whether the strategy has any signal. Path B spends 90% of the time on tuning a strategy that may have no signal at all, and produces an IS number that does not let the team distinguish signal from search luck.
The right sequencing is: prove the strategy has signal at structural-prior parameters first, then optimize. Most teams do the reverse: optimize first, then "validate" the optimized version. The reverse is overfitting dressed up as methodology. This article gives the procedural framework for getting the sequence right.
The four-stage research process
Each stage answers a different question. Each stage's output gates the next stage.
Stage 1: hypothesis articulation. State the strategy thesis in plain language. What pattern is the strategy claiming exists? What mechanism explains why the pattern should persist? What market family does the pattern live on? What time horizon is relevant? The output is a written one-page hypothesis that is falsifiable. The article "Why Benchmarks Matter in Rule Evaluation" framed the testability requirement at the methodology level.
Stage 2: minimal-parameter prototype. Implement the strategy at structural-prior parameters with no optimization. The parameters come from the academic literature, the underlying mechanism, or domain priors. Run the backtest with these parameters. The question this stage answers: "is there any signal at all?" If the prototype Sharpe is in the expected range (typically 0.3 to 0.8 for a well-known structural premium, higher for a novel insight), proceed. If the prototype Sharpe is near zero or negative, reconsider the hypothesis. No optimization yet.
Stage 3: robustness exploration. Vary one parameter at a time, holding the others at the structural prior. Map the IS Sharpe as a function of each parameter individually. Look for plateaus where the Sharpe is approximately constant across a wide range. The output is a parameter-stability map (covered in detail in "Parameter Stability Beats Best Parameter" later in this pillar). Choose the final parameter set from the center of the plateau region, not from the IS-maximum point.
Stage 4: validation and optimization. With the parameters chosen from Stage 3, run the regime-stratified backtest, the cross-market check (within the family from "Market Personality: Why Gold, FX, Crypto, and Equities Need Different Systems"), the bootstrap robustness check, and the multi-period stability check. Only after all of these pass should any small final optimization be applied, and only within the plateau region identified in Stage 3.
The wrong order. Most teams compress Stages 1 to 3 into a single combined search where the parameter optimization happens before the validation. The combined search produces an IS Sharpe that mixes the signal contribution with the search-width inflation, and the team cannot distinguish the two without doing the validation step on a separate slice.
Structural prior, defined
The parameters that come from outside the backtest. Three sources.
Source 1: academic literature. The 12-month lookback for equity momentum is from Jegadeesh and Titman 1993 and replicated in dozens of papers since. The 5-day mean-reversion horizon is from numerous studies of short-horizon equity reversal. The 22-day window for vol estimation is roughly one trading month. These are not optimized in the current research; they come pre-vetted with a structural rationale. Use them and do not retune.
Source 2: mechanism-based reasoning. If the strategy is a pairs trade, the lookback for cointegration estimation should match the half-life of the spread's mean reversion. If the spread half-life is 30 days, the cointegration lookback is 60 to 120 days (2-4x the half-life). The number comes from the mechanism, not from a search.
Source 3: cross-asset analogs. If the strategy is novel and there is no academic literature, look at analog strategies on related markets. A strategy on BTC may borrow parameters from a similar strategy on equities (with appropriate scaling for volatility differences). The borrowed parameters are a prior, not a fit.
The discipline. Once a structural prior is set, it is not subject to optimization until Stage 4. The Stage 2 prototype runs at the structural prior. The Stage 3 robustness check varies parameters around the prior to find the plateau. The Stage 4 final selection picks from the plateau, not from the maximum. The optimization in Stage 4 is constrained, small, and only applied after the strategy has demonstrated signal at the prior.
Reasons teams skip Stage 2
Three reasons, each diagnostic of a research-process problem.
Reason 1: the prototype produces a low number. Sharpe 0.65 looks bad next to optimized Sharpe 1.4 in any presentation context (internal review, fund pitch, paper). The team optimizes to produce a better presentation number. The team is then evaluating an inflated version of the strategy, not the underlying signal.
Reason 2: the team confuses optimization with rigor. Running a parameter-search framework looks more sophisticated than running one backtest with prior parameters. The team interprets sophistication as quality, when in research context the more rigorous approach is to test the prior first and only optimize if the prior shows signal.
Reason 3: software defaults. Many backtesting platforms default to optimization workflows because they produce more visually appealing reports. The team accepts the default. The default is misaligned with research-process discipline.
The fix. Make Stage 2 the explicit first deliverable. Before any team member opens an optimization framework, they must produce the Stage 2 backtest at structural priors, write a one-paragraph interpretation of the result, and decide whether to proceed. The friction is the discipline.
The math of optimization-after-testing vs optimization-before-testing
A simple comparison. Assume the strategy's true Sharpe at the structural prior is SR_true. The Stage 2 prototype produces an unbiased estimate with standard error sigma_IS / sqrt(N). The Stage 4 optimization within the plateau region searches over k_local candidates, producing an estimate with bias sigma_IS times sqrt(2 log k_local).
$$ \widehat{\text{SR}}_{\text{Stage 4}} = \text{SR}_{\text{true}} + \varepsilon_{\text{search}}, \qquad \mathbb{E}[\varepsilon_{\text{search}}] \approx \sigma_{\text{IS}} \cdot \sqrt{2 \log k_{\text{local}}} $$
For k_local approximately 10 (a small final optimization within the plateau), the bias is approximately 2.1 sigma_IS / sqrt(N). This is small compared to the true Sharpe. By contrast, optimization-before-testing searches over k_global candidates spanning many regions of parameter space, with k_global typically 100 to 10000.
$$ \mathbb{E}[\varepsilon_{\text{global}}] \approx \sigma_{\text{IS}} \cdot \sqrt{2 \log k_{\text{global}}}, \quad k_{\text{global}} \gg k_{\text{local}} $$
For k_global = 1000, the bias is approximately 3.7 sigma_IS / sqrt(N), which can swamp the true Sharpe. The Stage 4 optimization is statistically defensible because the plateau-region constraint limits k_local; the optimization-before-testing approach is not defensible because k_global is large and unconstrained.
Anti-patterns
Five mistakes specific to the optimization-sequence problem.
Anti-pattern 1: presenting the optimized Sharpe as the strategy's performance. The optimized Sharpe is the upper end of the search-width distribution, not the unbiased estimate. The right number to present is the structural-prior Sharpe with the plateau-region confidence band; the optimized version is reported as a refinement, not as the headline.
Anti-pattern 2: skipping Stage 2 because the prototype produces a low number. A low number at the structural prior is informative: the strategy may have a small or absent signal, and optimization will not create signal that is not there. The right response is to reconsider the hypothesis, not to optimize.
Anti-pattern 3: combining the optimization and the validation into a single stage. The validation needs to happen on a slice of data not seen during the optimization. If the optimization touched all the available data, the validation is not independent. The article "Why OOS Failure Is Often a Stationarity Failure" framed the IS-OOS-leakage problem; the present anti-pattern is one way the leakage is introduced.
Anti-pattern 4: claiming the optimized parameters are "robust" because the team tried multiple values. Trying multiple values produces a search-width-inflated estimate; it does not produce a robust strategy. The robust strategy is the one chosen from the plateau in Stage 3, with the Stage 4 validation confirming the plateau survives OOS.
Anti-pattern 5: re-running Stage 4 if the OOS underperforms. The OOS is the validation. If the OOS underperforms, the diagnosis is the diagnostic flow from "Why OOS Failure Is Often a Stationarity Failure" and the action is the decommission policy from "How to Detect When a Trading System Is Dying". Re-running the optimization in response to OOS underperformance contaminates the validation slice and converts the optimization-after-testing approach into the optimization-before-testing failure mode.
Decision matrix
| Research stage | Right action | Wrong action |
|---|---|---|
| Stage 1: hypothesis | Write a one-page testable thesis with mechanism | Skip directly to backtest |
| Stage 2: prototype | Backtest at structural-prior parameters, no optimization | Tune parameters to improve the number |
| Stage 3: robustness | Map Sharpe vs each parameter individually, find plateau | Find peak via grid search |
| Stage 4: validation | Regime-stratified, cross-market within family, bootstrap | Combined optimization-and-validation |
| Stage 4 final tweak | Small optimization within Stage 3 plateau, k_local <= 10 | Wide optimization across all parameter space |
| OOS deployment | Trust the structural-prior + plateau result | Re-tune in response to live data |
| OOS underperforms | Run diagnostic flow, decommission per policy | Re-optimize on extended IS |
| Post-mortem | Update structural priors based on what failed | Skip post-mortem to ship next strategy |
The matrix matches research stage to discipline. The pattern: parameter selection is a small final step, not the main research activity. Most of the research time goes to hypothesis articulation, prototype evaluation, and robustness checks.
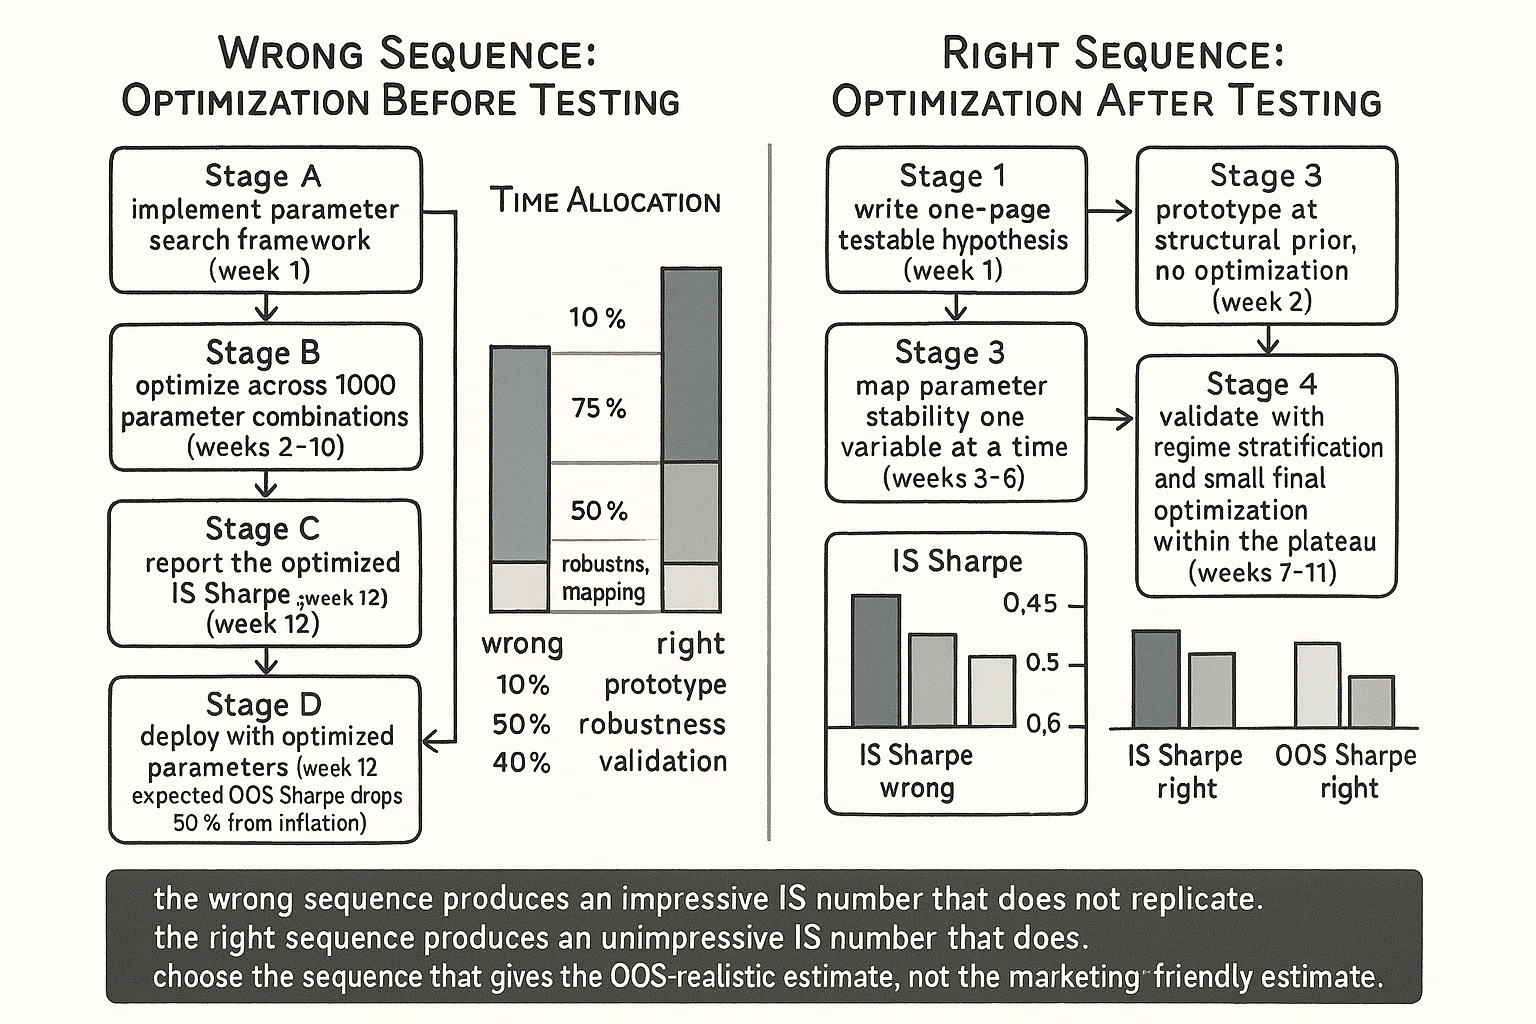
Visualizing the right sequence
KEY POINTS
- The right research process is four stages: hypothesis articulation, minimal-parameter prototype at structural priors, robustness exploration with parameter-stability mapping, validation with optional small final optimization within the plateau region.
- Each stage answers a different question. Stage 2 answers "is there signal?". Stage 3 answers "is the signal robust to parameter perturbation?". Stage 4 answers "does the strategy survive cross-regime, cross-market, and bootstrap-robustness validation?".
- The parameter optimization in Stage 4 is constrained to the plateau region from Stage 3, with k_local on the order of 10 candidates. The optimization-induced bias is small and the resulting estimate is approximately unbiased.
- The wrong order: combine Stages 2-4 into a single optimization that searches across thousands of parameter combinations and reports the maximum IS Sharpe. The bias from this approach scales with sqrt(2 log k_global) and can swamp the true Sharpe. The IS estimate does not replicate OOS.
- Structural priors come from three sources: academic literature, mechanism-based reasoning, cross-asset analogs. The priors are not subject to optimization until Stage 4.
- Three reasons teams skip Stage 2: the prototype produces a low number that looks bad in presentation, the team confuses optimization complexity with research rigor, software defaults push the optimization-first workflow.
- Anti-pattern: presenting the optimized Sharpe as the strategy's performance. The unbiased estimate is the structural-prior Sharpe with the plateau-region confidence band. The optimized version is a refinement, not a headline.
- Anti-pattern: combining optimization and validation into one stage. The validation needs an independent slice; combined search uses all the data.
- Anti-pattern: claiming "robustness" from a parameter search. Searching is not robustness. Robustness comes from the plateau-region selection and the Stage 4 cross-regime cross-market checks.
- Anti-pattern: re-running optimization in response to OOS underperformance. Each re-optimization contaminates the validation. The right response is the diagnostic flow and the decommission policy.
- Most retail and small-shop research compresses the four stages into one optimization run because optimization is the most software-supported part of the workflow. The discipline of separating the stages is the upstream defense against most of the OOS failures.
- The current article gives the procedural sequence. The next article in the publication ("Degrees of Freedom in Trading Systems") covers the parameter-counting framework that makes the search-width bias quantitative.
References
- Testing and Tuning Market Trading Systems - Timothy Masters (Amazon)
- Data Mining Algorithms in C++ - Timothy Masters (Amazon)
- Improving the Robustness of Trading Strategy Backtesting with Boltzmann Machines and Generative Adversarial Networks
- Backtesting Trading Strategies with GAN to Avoid Overfitting
- Futuretesting Quantitative Strategies
- Quantitative Strategies for Momentum and Trend Reversal: Integrating Cross-Sectional and Time-Series Perspectives
- Fiduciary Selection and Monitoring of Investment Managers Under
- Apex Quant: A Multi-Agent Debate Framework for Quantitative Trading
- The GT-Score: A Robust Objective Function for Reducing Overfitting
- Backtest Overfitting in the Machine Learning Era