3.5 Why OOS Failure Is Often a Stationarity Failure
Most OOS failures get blamed on overfitting. Often it is regime change between IS and OOS. Run the diagnostic flow: permutation, pipeline audit, sample size, regime overlap test, in order.
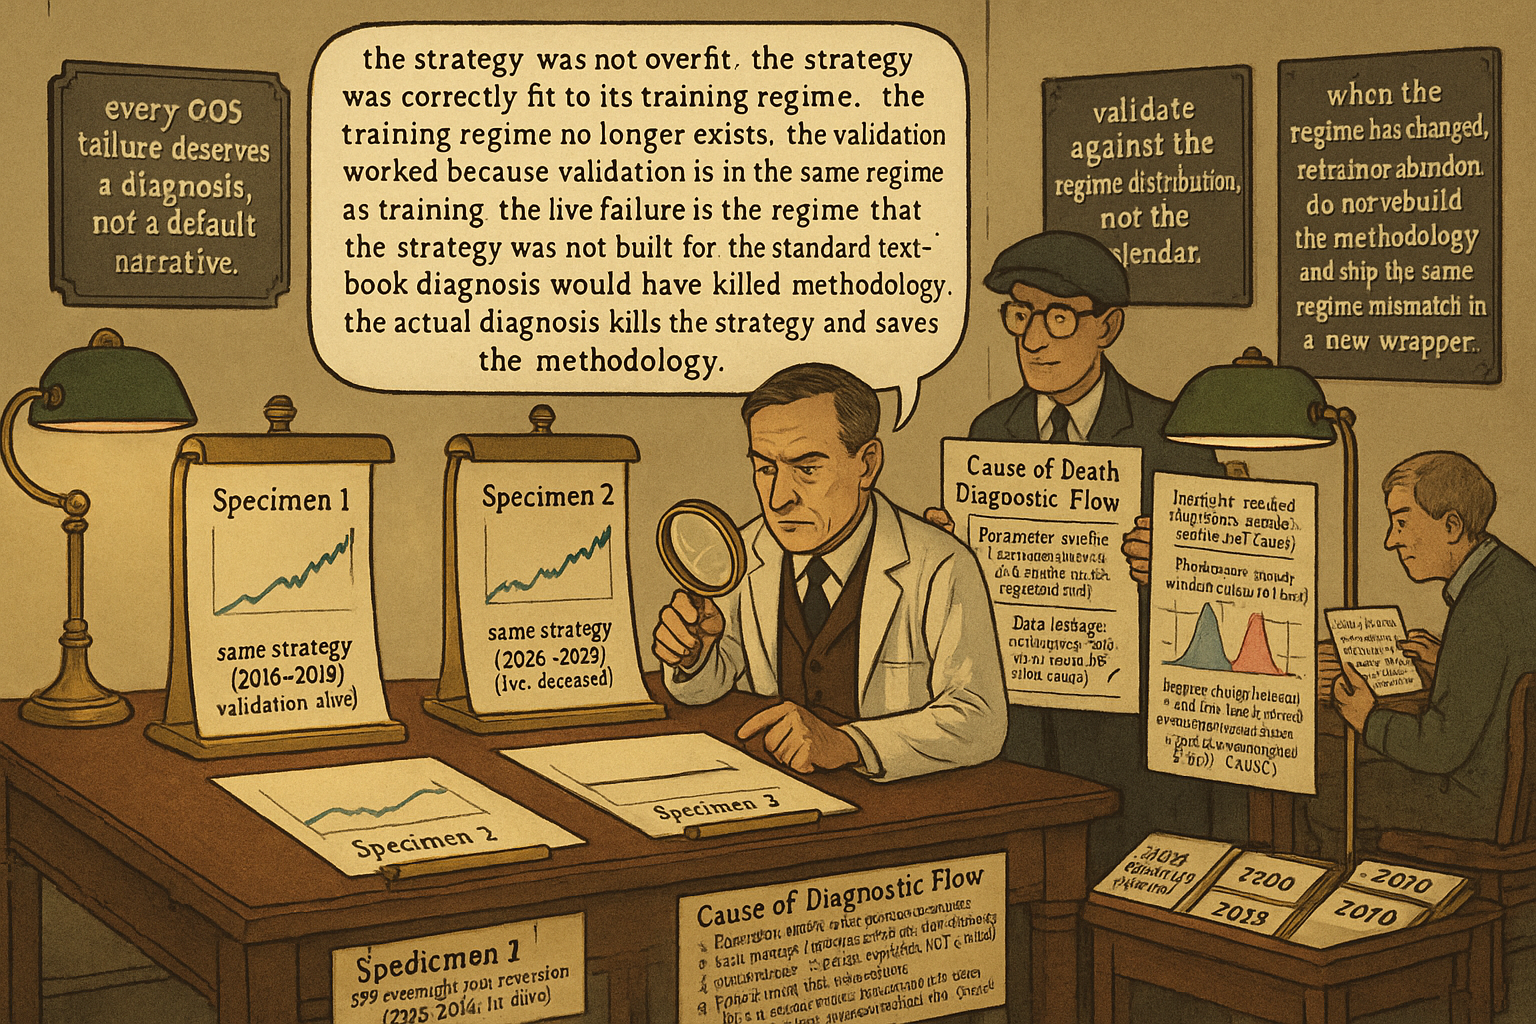
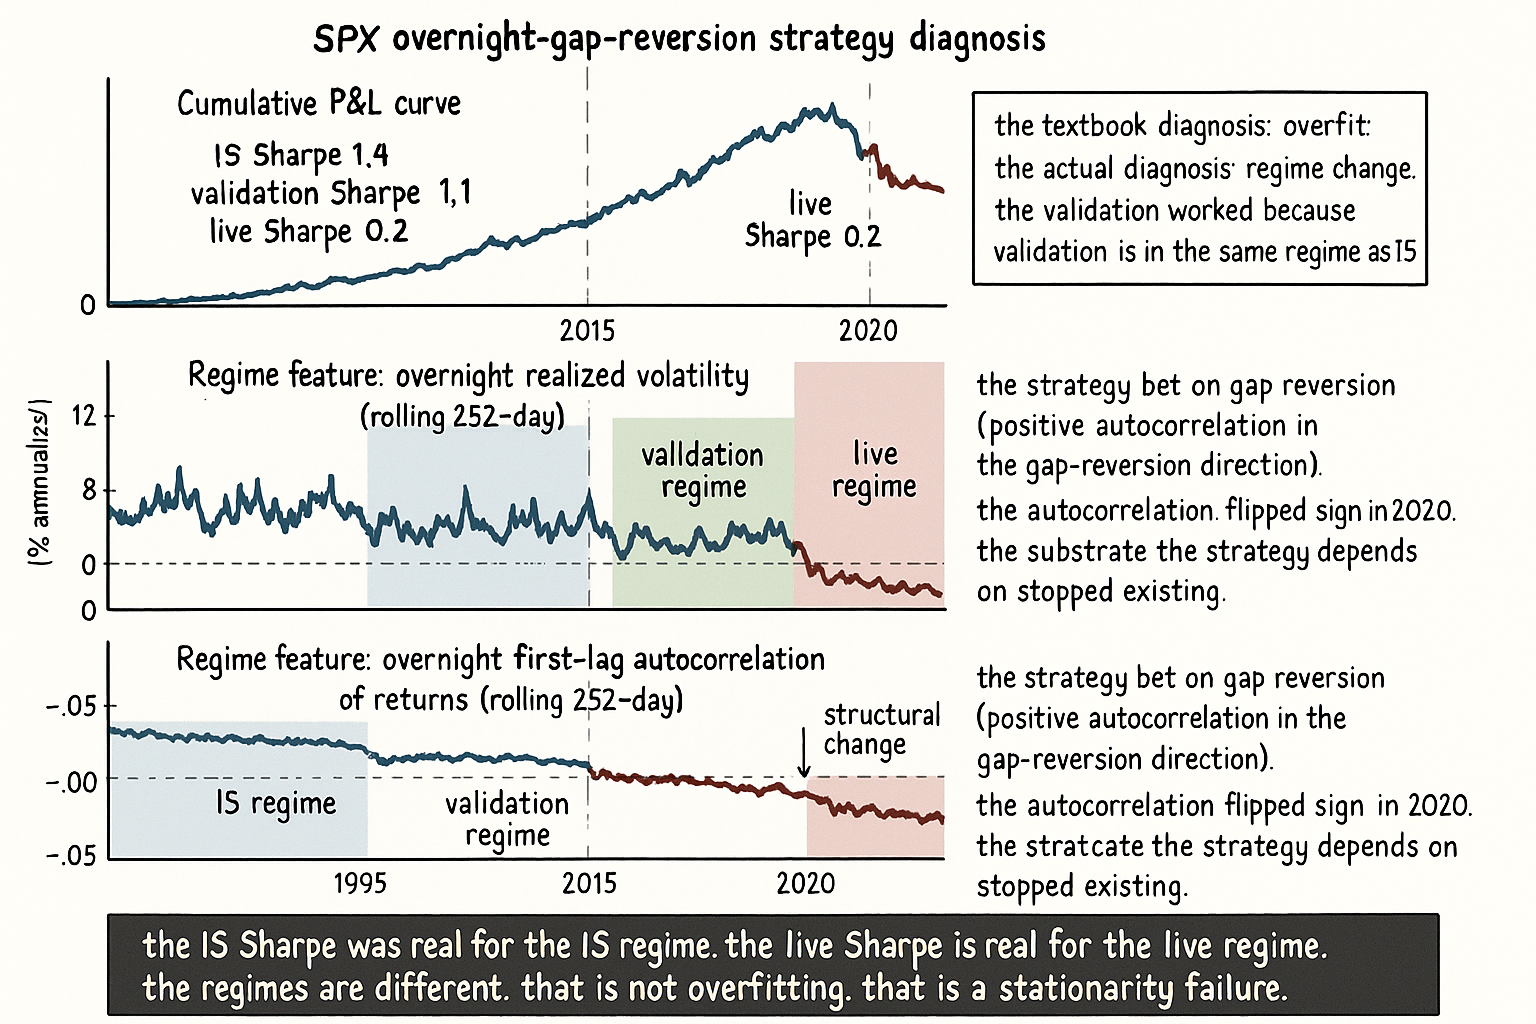
A researcher builds an SPX overnight-gap reversion strategy. Hold-out scheme: train on 1995 to 2014, validate on 2015 to 2019, deploy in 2020. In-sample Sharpe 1.4. Validation Sharpe 1.1. Live 2020 to 2025 Sharpe 0.2. The researcher's first instinct is the textbook diagnosis: the strategy was overfit to the 1995 to 2014 window, the validation period was too short to detect it, the strategy now reveals its true near-zero edge. The researcher decommissions the strategy, posts a "I should have used CSCV and walk-forward" lesson on social media, and moves on.
The diagnosis is wrong. Run the same strategy with the same parameters on a different out-of-sample slice (1990 to 1994 plus 2007 to 2008): Sharpe 1.3. Run it on 2010 to 2014 OOS only (with training on 1990 to 2009): Sharpe 1.2. Run it on 2020 to 2025 with training on any window that does not overlap 2020 to 2025: Sharpe near 0.2. The strategy is not overfit. The strategy worked on every window before 2020 and stopped working on 2020 to 2025. The cause is not the researcher's process; the cause is the regime change between 2019 and 2020 (microstructure shift in overnight session, the increase of options-driven gamma flows, the persistent retail-driven gap fading). The 2015 to 2019 validation worked because that window is in the same regime as 1995 to 2014. The 2020 to 2025 deployment failed because that window is a different regime.
This is the most common form of OOS failure in practical research, and the most often misdiagnosed. The researcher attributes the failure to a fixable methodology problem (overfitting) and rebuilds the methodology in ways that do not address the actual cause (non-stationarity between IS and OOS). The next iteration of the strategy looks more rigorous and fails for the same reason. The article "Stationarity: The Word Every Trader Ignores Until It Kills the Strategy" framed the broad case for stationarity discipline. This article applies the framework to the specific question of OOS failure: when a strategy fails OOS, how often is it a stationarity problem versus an overfitting problem, and what diagnostic distinguishes the two.
The four causes of OOS failure
A strategy that performs worse OOS than IS has four candidate explanations. Each has a different fix.
Cause 1: parameter overfit. The strategy has too many degrees of freedom relative to the IS sample, the optimizer found IS-specific noise, the OOS performance reflects the underlying near-zero true edge. Fix: reduce parameters, regularize, use CSCV, run permutation tests on the IS Sharpe. The article "Degrees of Freedom in Trading Systems" later in this pillar covers the parameter-overfit framework in detail.
Cause 2: data leakage / look-ahead. The strategy used information at training time that it would not have at trading time (future data, in-sample-fitted normalizations applied to OOS, post-hoc-adjusted prices). Fix: rebuild the data pipeline so every transformation is causally clean, with rolling estimators that use only past data.
Cause 3: insufficient sample. The IS sample produced a Sharpe estimate with high standard error; the realized OOS performance is within the noise band of the IS estimate. The strategy was never as good as it looked, and the OOS produced a lower draw from the same distribution. Fix: more data, longer track record, lower expected effect-size threshold for accepting a strategy. The article "Trade-Count Thresholds for Backtest Reliability" covers the sample-size question.
Cause 4: regime change between IS and OOS. The strategy was correct under the IS regime and is incorrect under the OOS regime. The data-generating process changed in some material way (microstructure, macro regime, participant mix, volatility level). The strategy is well-fit to a regime that the OOS is no longer in. The label "overfit" miscategorizes the failure mode. Fix: diagnose the regime change, decide whether to retrain on recent data, decide whether the regime change invalidates the strategy class outright.
The four causes look identical when you only see the IS Sharpe and the OOS Sharpe. They are distinguishable when you look at the right diagnostics. Most published OOS failure cases are diagnosed with cause 1 because parameter overfit is the canonical methodology failure mode and the easiest to test for. In practical research, cause 4 is at least as common, and the false attribution to cause 1 produces no useful corrective action.
The diagnostic flow
A simple decision tree distinguishes the four causes.
$$ \begin{array}{l|l|l} \text{Test} & \text{Outcome} & \text{Implies} \\ \hline \text{Permutation test on IS Sharpe} & \text{not significant} & \text{cause 1: overfit} \\ \text{Permutation test on IS Sharpe} & \text{significant} & \text{not cause 1} \\ \text{IS pipeline audit} & \text{look-ahead found} & \text{cause 2: leakage} \\ \text{IS pipeline audit} & \text{clean} & \text{not cause 2} \\ \text{IS sample sufficiency} & N < 100 \text{ trades} & \text{cause 3: noise} \\ \text{IS sample sufficiency} & N > 200 \text{ trades} & \text{not cause 3} \\ \text{Regime overlap test (IS, OOS)} & \text{overlap low} & \text{cause 4: regime} \\ \text{Regime overlap test (IS, OOS)} & \text{overlap high} & \text{re-examine} \\ \end{array} $$
The flow is sequential. If the permutation test rejects the null (the IS Sharpe is significant under the no-edge null), cause 1 is unlikely. If the pipeline audit finds no look-ahead, cause 2 is unlikely. If the IS sample is large enough, cause 3 is unlikely. If the regime overlap between IS and OOS is low, cause 4 is the leading explanation. The order matters because each test is cheap and each rules out a candidate cause cleanly.
The permutation test mechanics: shuffle the timing of the strategy's returns thousands of times to break any predictive structure, recompute the IS Sharpe on each shuffle, place the realized IS Sharpe in the resulting null distribution. A realized Sharpe in the top 5% rejects the no-edge null. The article "Permutation Tests for Indicator Significance" covers the technique in detail.
The regime overlap test mechanics: characterize each window (IS and OOS) by a vector of macro and microstructure features (rolling realized vol, rolling autocorrelation, rolling correlation to other assets, rolling effective spread). Compute the distance between the IS feature distribution and the OOS feature distribution. Standard tools: Kolmogorov-Smirnov on each feature individually, energy distance for the joint distribution, or a simple sliced-Wasserstein. Low overlap (KS p-value below 0.05 on multiple features, or large joint distance) is the regime-mismatch signature.
The IS / OOS regime overlap test
A practical implementation. Define the regime feature vector at time t.
$$ F_t = \bigl(\,\text{vol}_t,\; \text{ac}_t,\; \rho_t,\; \text{spread}_t,\; \text{trend}_t,\; \dots\,\bigr) $$
Each component is a rolling-window estimator of a stable structural feature. Realized volatility on 252-day window. First-lag autocorrelation of daily returns on 252-day window. Rolling correlation to a broad reference (SPX or AGG) on 252-day window. Effective spread per round-trip. Trend strength (the absolute t-statistic of the daily-return mean over a 252-day window). Add or subtract features depending on what the strategy depends on.
For each feature, compute the empirical distribution across the IS window and across the OOS window separately. Run KS or Anderson-Darling on the two distributions. Aggregate the test statistics or, more practically, plot the two distributions overlaid and look at the visual overlap. A clean IS/OOS regime overlap shows distributions with strong overlap on every feature. A regime-mismatch shows visible separation on at least one feature.
For the SPX overnight-gap example above: the relevant features are overnight realized volatility, the autocorrelation of overnight returns, and the share of total variance contributed by the overnight session. All three shift visibly between 2015 to 2019 and 2020 to 2025 (overnight-session variance share rose, overnight autocorrelation flipped sign in the gap-reversion direction). The KS test rejects equality of distributions on each of these features at p < 0.001. The strategy is operating in a different regime from the one it was tuned on.
Regime overlap, in practice
Three operational interpretations.
Interpretation 1: the OOS performance is informative about the strategy's robustness only when the IS and OOS regimes overlap. A strategy that performs well on a high-overlap OOS slice has been validated against one realization of its target regime. A strategy that performs well on a low-overlap OOS slice has been validated against a different regime than the one it was built for, which is a different and weaker claim.
Interpretation 2: live-deployment risk depends on the overlap between the historical regime distribution and the live-period regime. A strategy that was trained on a wide regime distribution and validated on a wide overlapping distribution has lower regime risk in deployment. A strategy trained narrowly faces high regime risk if the live period is outside the training distribution.
Interpretation 3: the proper denominator for "OOS validation" is the regime distribution, not the calendar. "Five years OOS" is a calendar measure that may cover one regime or six. The right OOS specification is "OOS coverage spans low-vol, high-vol, trending, and mean-reverting regimes with at least N samples in each", which is the topic of the article "Regime Coverage: Why Your Backtest Needs Different Market States" later in this pillar.
Regime mismatch as the diagnosis
Three actions when the diagnosis lands on cause 4.
Action 1: do not deploy the strategy. The IS performance was real for the IS regime, the OOS performance is real for the OOS regime, and the live regime is the OOS regime. The strategy works for a regime that is not the one currently operating. Deploying it is funding a strategy that is mismatched to the live environment.
Action 2: retrain on the OOS regime data. If the strategy class is robust enough that retraining on the new regime produces meaningful parameters, the right action is to use the OOS window as the new IS and re-validate on a fresh OOS that is also in the new regime (if available). The retrained strategy is the same strategy class with new parameters appropriate to the live regime. The article "Why Walk-Forward Testing Is Better Than One Big OOS Split" covers the operational machinery.
Action 3: abandon the strategy class. If the regime change is structural (microstructure overhaul, persistent macro regime change, participant-mix change that is unlikely to revert), the strategy class itself may not survive. The retrain produces parameters that fit the new regime but the underlying signal is no longer there. The post-mortem is the lesson; the research bandwidth moves to a different strategy class.
Distinguishing actions 2 and 3 requires a structural-mechanism understanding beyond pure statistics. Did the regime change because of a permanent structural shift (decimalization, electronic exchange transition, ETF arbitrage growth, persistent low-rate environment) or because of a transient cycle (a particular macro shock, a single-quarter unusual event)? The structural answer drives the action.
Anti-patterns
Five mistakes specific to OOS-failure diagnosis.
Anti-pattern 1: every OOS failure attributed to overfitting. The default narrative in published quant research is "the strategy looked good IS, failed OOS, must have been overfit". The narrative is convenient because it implies a fixable methodology problem. The diagnosis is correct in some fraction of cases and wrong in a comparable fraction. Run the diagnostic flow before committing to the diagnosis.
Anti-pattern 2: rebuilding the methodology to "be more rigorous" without diagnosing the failure. After an OOS failure, the researcher adds CSCV, more cross-validation folds, more permutation tests, and ships the next strategy with more methodology and the same regime mismatch. The next strategy fails the same way. Rigor on the wrong cause does not fix the right cause.
Anti-pattern 3: assuming a longer IS window automatically helps. Doubling the IS window doubles the number of regimes the strategy is fit across, which dilutes the parameter fit across all of them. A strategy that performs well in a single regime may perform mediocrely after being fit on a wide multi-regime window. The right framing is "fit narrowly to a specific regime, validate on the same regime, deploy when the live data is in that regime". The article "Why More Parameters Make a Strategy Easier to Sell and Easier to Break" covers the related concern about within-strategy degrees of freedom.
Anti-pattern 4: choosing the OOS window for convenience rather than regime coverage. The default OOS window in many research frameworks is "the most recent 20% of the data". The window is chosen for cleanness of the time-series split, not for regime coverage. The 20% may all be in one regime, in which case the OOS validates one regime. The proper OOS specification is regime-stratified, not calendar-stratified.
Anti-pattern 5: declaring a strategy validated when the IS and OOS regimes are demonstrably different. The IS and OOS Sharpes both look acceptable, the researcher ships. The KS test on the regime feature distributions rejects equality at p < 0.01. The validation says "the strategy works in regime A and in regime B"; it does not say "the strategy works in regime C", which is what live deployment will face. Acceptable IS and OOS Sharpes across different regimes is a robustness claim, not a same-regime validation.
Decision matrix
| Test result | Most likely cause | Action |
|---|---|---|
| IS permutation test fails to reject | Cause 1: overfit | Reduce parameters, regularize, retest |
| IS pipeline audit finds look-ahead | Cause 2: leakage | Fix pipeline, retest from scratch |
| IS sample N < 100 trades | Cause 3: noise | Collect more data or lower expected effect size |
| Regime overlap KS rejects on key features | Cause 4: regime change | Retrain on new regime or abandon strategy class |
| Multiple causes simultaneously | Combined failure | Address each cause in the order overfit, leakage, sample, regime |
| All tests clean and OOS still failed | Re-examine the test setup | Check for non-overlapping subtle effects |
The matrix is operational. Most real OOS failures fall into causes 1, 3, and 4 with cause 4 being the most often misdiagnosed.
Visualizing the IS/OOS regime mismatch
KEY POINTS
- Most OOS failures get the textbook diagnosis "the strategy was overfit". The default narrative is convenient because it implies a fixable methodology problem. In practical research, regime change between IS and OOS is at least as common a cause and is the most often misdiagnosed.
- Four candidate causes of OOS failure: parameter overfit, data leakage, insufficient sample, regime change. Each has a different fix; the wrong diagnosis produces no useful corrective action.
- The diagnostic flow is sequential and cheap. Permutation test on IS Sharpe rules out overfit. Pipeline audit rules out leakage. Sample-size check rules out noise. Regime overlap test (KS or Wasserstein on feature distributions) identifies regime mismatch.
- The regime overlap test compares the IS distribution and OOS distribution of structural features (realized vol, autocorrelation, cross-asset correlation, effective spread, trend strength). Significant separation on any feature is a regime-mismatch signature.
- The proper denominator for "OOS validation" is the regime distribution, not the calendar. Five years OOS may cover one regime or six. The right specification is regime-stratified, not date-stratified.
- When the diagnosis is regime change, three actions follow: do not deploy if the live regime differs from the historical training distribution, retrain on the new regime if the strategy class survives, abandon the strategy class if the regime change is structural.
- Distinguishing "retrain on new regime" from "abandon strategy class" requires a mechanism-level understanding, not a statistical one. Structural shifts (microstructure, persistent macro regime, participant mix) point to abandonment; transient cycles point to retraining.
- Anti-pattern: rebuilding the methodology with more rigor without diagnosing the failure. Adding CSCV and more cross-validation folds does not fix a regime mismatch.
- Anti-pattern: assuming a longer IS window automatically helps. Doubling the IS window dilutes the parameter fit across more regimes. Fit narrowly to a specific regime, deploy when the live data is in that regime.
- Anti-pattern: choosing the OOS window for calendar cleanness rather than regime coverage. The default 80/20 split or the most-recent-20% rule may not span the regimes the live deployment will face.
- The current article gives the diagnostic flow. The next article in the publication ("Volatility Regimes and Strategy Survival") covers one specific regime axis (volatility) in operational detail, including how to gate strategies on volatility regime in real time.
References
- Testing and Tuning Market Trading Systems - Timothy Masters (Amazon)
- Data Mining Algorithms in C++ - Timothy Masters (Amazon)
- Statistical Overfitting and Backtest Performance
- Avoiding Backtesting Overfitting by Covariance-Penalties
- All that Glitters Is Not Gold: Comparing Backtest and Out-of-Sample Performance of Trading Strategies
- Walk‑Forward Analysis (Chapter 11 in The Evaluation and Optimization of Trading Strategies)
- A Novel Approach to Trading Strategy Parameter Optimization Using Walk-Forward Analysis
- Structural Market Behavior and Systematic Trading
- Experimental Evaluation of an Algorithmic Trading Strategy Against a Benchmark with Monte Carlo Stress Testing
- A novel approach to trading strategy parameter optimization using
- Backtest Overfitting in the Machine Learning Era
- Backtest overfitting in the machine learning era: A comparison of out-of-sample validation techniques for financial time series
- Futuretesting Quantitative Strategies
- Predictive Value of Within-Strategy Permutation Tests for Forward Performance and Backtest Robustness
- Statistical Arbitrage with Mean-Reverting Overnight Price Gaps on High-Frequency Data of the S&P 500
- Dealer Gamma Exposure and Overnight Gap Risk
- 0DTEs: Trading, Gamma Risk and Volatility Propagation
- NON-PARAMETRIC ONLINE MARKET REGIME DETECTION AND APPLICATION TO TRADING STRATEGY ROBUSTNESS
A note on AI. The ideas, research, analysis, and conclusions in this article are my own. I use AI tools to help with editing and wordsmithing, because English is not my first language, and I am not shy about that. AI-generated ideas and AI-assisted writing are not the same thing: the first is empty slop from a generic prompt, the second is a tool for communicating years of real research more clearly. Judge the work by its substance, not by whether software helped polish the prose.