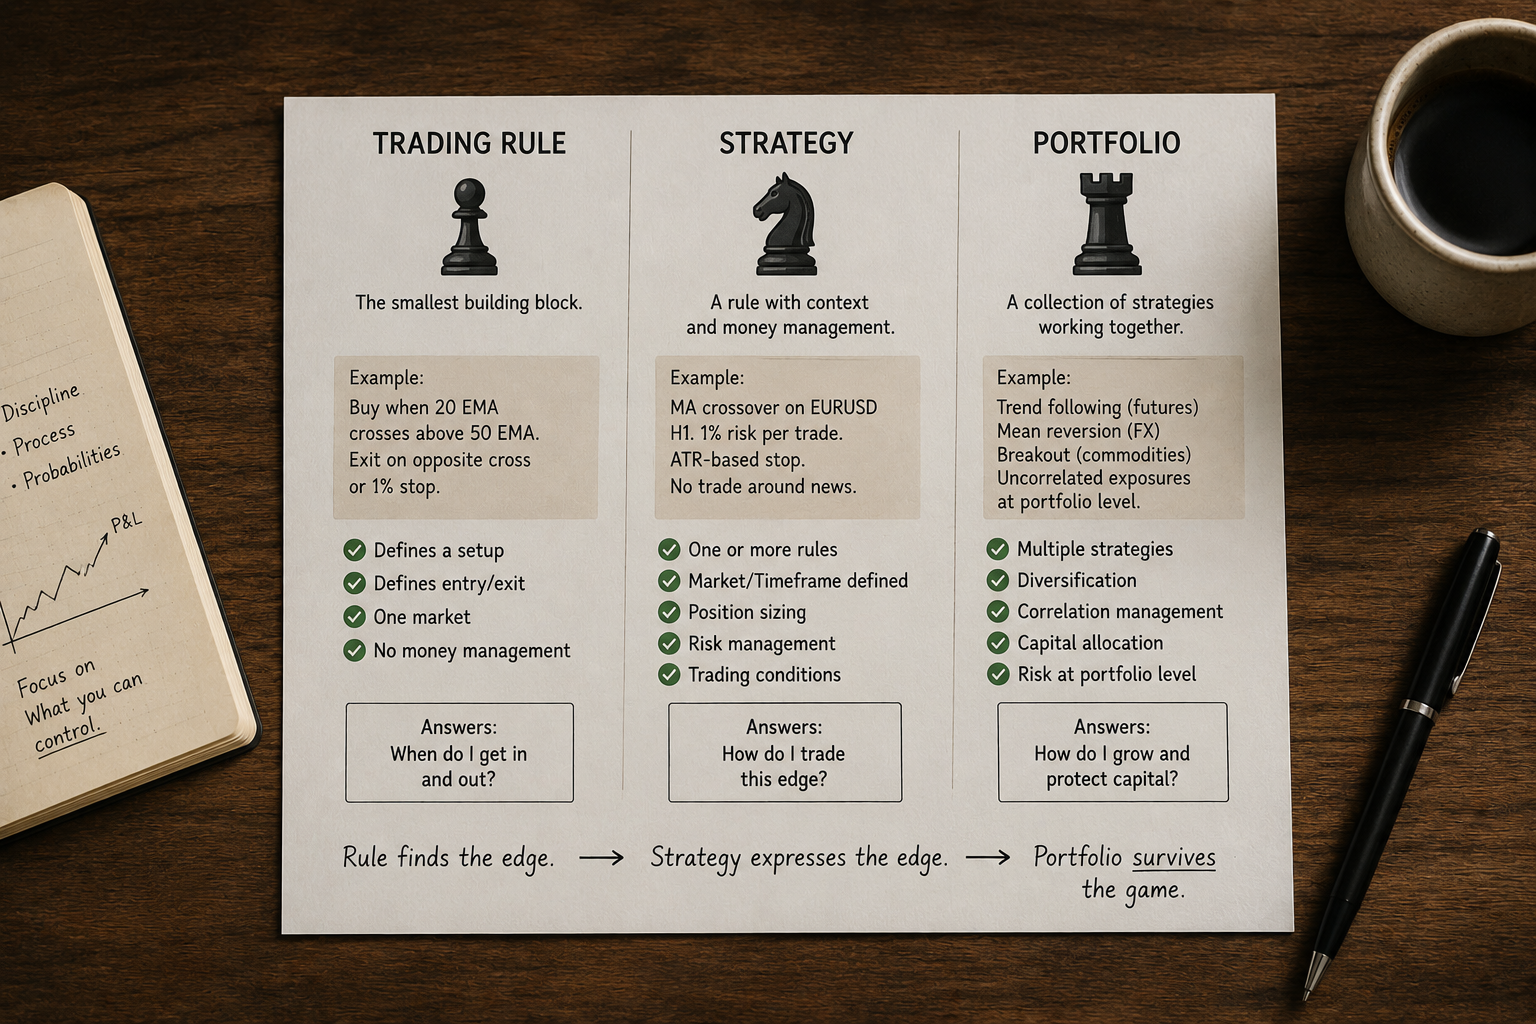
1.3 The Difference Between a Trading Rule, a Strategy, and a Portfolio
Most traders confuse a rule, a strategy, and a portfolio as the same thing. They are not. A rule generates forecasts, a strategy manages risk and sizing, and a portfolio allocates capital across systems. Mixing the layers is why many traders diagnose the wrong problem.
Most trading conversations collapse three different objects into one word. "I have a strategy." That often means: "I have a rule." The collapse is the source of half the diagnostic errors traders make when something goes wrong.
A rule, a strategy, and a portfolio sit at different layers of the stack. Each one is responsible for a different question. Each one fails for different reasons. A live equity curve that disappoints does so at one of these layers. Without the vocabulary to name which, you cannot fix it.
The rule: a forecast generator
A rule is the smallest functional unit. Its only job is to take market data in and produce a forecast out. Nothing else.
Example. Long when the 10-bar EMA of GBPUSD 30-minute closes is above the 30-bar EMA. Short when the inverse holds.
That is the entire rule. No position size. No stop. No capital allocation. No instrument selection. The rule does not know if your account is $5,000 or $5 million. It does not know if you have one rule or fifty. It takes a price series and emits a directional signal, sometimes with a magnitude.
Two properties define a good rule.
The first is predictive power after stripping long bias and market drift. A rule long 70% of the time on an up-trending market produces contaminated raw return. The clean test is to subtract the return of a random rule with the same long/short bias and the same holding-period distribution. The remainder is the rule's predictive content.
The second is that the rule's output is a scaled, continuous number, not a binary buy/sell flag. A scaled forecast lets the next layer translate magnitude into position size. A binary rule throws away information and forces the strategy layer to guess at conviction.
A rule that survives both tests is a candidate. It is not a trading business.
The strategy: rule + sizing + risk wrapper
A strategy takes a rule and wraps it into something that can hold capital without exploding. The strategy layer answers questions the rule cannot:
- How much capital does this position consume?
- How does position size scale as volatility changes?
- What is the maximum exposure per trade?
- What is the maximum exposure across open trades?
- What kills the position outside of the rule's own exit logic?
Same rule, two strategies, two equity curves. The rule says long when fast EMA crosses slow. Strategy A sizes each position to a fixed 1% account risk based on the 30-day ATR. Strategy B sizes each position to 0.5 standard contracts no matter what volatility looks like. After 200 trades, Strategy A produces a smooth equity curve with 8% max drawdown. Strategy B produces a jagged curve with 22% max drawdown because position size is constant while instrument volatility ranges 3x between calm and active regimes.
The rule was identical. The strategies are different products.
The strategy layer is where most retail "rule logic" leaks into. A trader who says "my strategy uses a trailing stop" is mixing rule and strategy. The trailing stop is a strategy-layer decision about how to exit; it sits outside the rule's signal generation. Keeping these separate lets you swap the rule without rewriting the risk layer, and swap the risk layer without breaking the rule.
A clean strategy has four components:
- A rule (forecast in, signal out)
- A position-sizing function (signal + volatility + capital → position size)
- A volatility target (the annualized standard deviation of returns the strategy aims for)
- A stop or kill criterion outside the rule's own exit logic
Strip any of these and you have a half-strategy. A rule with no sizing model is not deployable. A sizing model with no volatility target is leveraged guessing. A strategy with no kill criterion is a system without a smoke detector.
The portfolio: allocation across strategies
A portfolio is one layer up. It takes a list of strategies, each one complete in itself, and decides how much capital each runs at.
Concrete example. You have three working strategies:
- S1: EMA crossover on GBPUSD 30m, target volatility 12%
- S2: Breakout on Brent crude 4h, target volatility 12%
- S3: Carry rank on a basket of G10 FX pairs, target volatility 12%
Each strategy is volatility-targeted at 12%, which means it sizes its own positions to deliver that volatility on its own equity. The portfolio layer answers a different question: what fraction of capital goes to each, and what is the resulting total portfolio volatility?
Equal weights of 33% to each gives a portfolio volatility somewhere between 7% and 12% depending on how correlated the three strategies are. Correlation of 0 collapses the volatility through diversification. Correlation of 1 leaves it at 12%. The same three strategies, with the same individual Sharpes, can produce a portfolio Sharpe ranging from 0.8 to 1.6 depending on the correlation structure.
The portfolio layer is where most retail traders never go. They run one strategy at full size and call it a portfolio. That is a single-strategy account, which is a single point of failure when the strategy decays.
A portfolio has its own design surface:
- Strategy weights (how much capital per strategy)
- Cross-strategy correlation (the structural diversification budget)
- Total portfolio volatility target (the actual risk dial you turn)
- Rules for adding new strategies and retiring dead ones
The distinction is diagnostic
The vocabulary is diagnostic, not academic.
A live account that underperforms raises one question: which layer broke. The answers are different at each layer.
The rule broke if predictive power has decayed in the underlying signal. Diagnose with out-of-sample tests on recent data and benchmark-adjusted return.
The strategy broke if the rule still has signal but execution is leaking edge. Diagnose with slippage analysis, MAE/MFE on closed trades, and drift between expected and realized position size.
The portfolio broke if individual strategies still produce expected returns but the combination is worse than expected. Diagnose with rolling correlation between strategies and contribution analysis on portfolio drawdown.
A trader without this vocabulary points at "the strategy" and re-optimizes the rule, when the rule was fine and the portfolio was the problem. Or throws away a working rule because a sizing bug made the live curve look terrible. The wrong layer gets surgery.
Two retail failure modes from collapsing the layers
A standard retail failure mode looks like this. A trader builds a "strategy" that is a rule with a hardcoded position size of one contract per signal. They run it on one instrument. The first six months produce noisy results because position size is constant while volatility is not. The trader concludes the rule is broken and starts modifying it. Three iterations later, the rule has been curve-fit to the last six months of GBPUSD intraday volatility, the rule no longer has any out-of-sample edge, and the original problem, which was strategy-layer sizing, is still there.
The opposite failure mode also shows up. A trader with a good rule and a clean strategy wrapper runs it at full account size for years. The strategy decays the way every strategy decays. The trader has no portfolio layer to absorb the drawdown, no second strategy to carry the equity curve while the first one is repaired. One bad year and the account is below a credibility threshold the trader cannot recover from emotionally.
Both failures are vocabulary failures dressed up as trading failures.
Each layer in its own file
The work happens in three different files.
The rule lives in a research notebook. Input: a price series and a parameter set. Output: a signal series. The tests are statistical: predictive power, stability across parameter perturbations, robustness across instruments, robustness across time. The rule is judged in isolation, with no money, no costs, no sizing.
The strategy lives in a simulation harness. Input: the rule, a sizing model, a volatility target, a cost model. Output: an equity curve with realistic friction. The tests are economic: net Sharpe after costs, drawdown distribution under Monte Carlo, sensitivity to slippage assumptions, behavior under volatility regime changes.
The portfolio lives in an allocation file. Input: a set of validated strategies, their historical return series, their correlation matrix. Output: capital weights and total volatility target. The tests are structural: diversification ratio, portfolio Sharpe, tail dependence under stress, capacity per strategy.
Edit the file that owns the broken layer. Editing the wrong file produces the wrong fix.
KEY POINTS
- A rule is a forecast generator. Input: market data. Output: a scaled signal. No capital, no sizing, no exits beyond the signal logic itself.
- A strategy wraps a rule with position sizing, a volatility target, and a kill criterion outside the rule's own exits. It is the smallest unit that can hold capital.
- A portfolio is a collection of complete strategies with capital weights, a correlation structure, and a total volatility target. It is the smallest unit that can survive single-strategy decay.
- Same rule, different strategy layers, different equity curves. The rule is not the product.
- Diagnosis follows the layers. Rule failures look like signal decay. Strategy failures look like execution drift. Portfolio failures look like the strategies still working but the combination not.
- A "strategy" with no sizing model, no volatility target, and no external kill criterion is a half-strategy. It is not deployable.
- A "portfolio" that contains one strategy is a single-strategy account, which is a single point of failure.
- Each layer lives in a different research file. Surgery on the wrong layer is the most common mistake.
References
- Evidence-Based Technical Analysis - David Aronson (Amazon)
- Systematic Trading - Robert Carver (Amazon)
- Does Trend Following Still Work on Stocks?
- A Hybrid Systematic-Discretionary Channel Breakout Framework for Nasdaq E-mini Futures
- Does Trade Size Restriction Affect Trading Behavior? Evidence from the Hong Kong–Shanghai Connect
- Classifying Hedge Fund Strategies with Large Language Models
- A Comprehensive Review of Statistical Methods in Quantitative
- Beating the Wick: A Regime-Filtered Intraday Gold Trading Strategy
- Deep Learning for Options Trading: An End-To-End Approach - arXiv
- 1 Hypothesis Testing Ordinary Meaning Daniel Keller – Northern