1.21 Why Simplicity Is a Statistical Weapon
Simplicity is not aesthetic preference, it is statistical advantage. Each parameter inflates standard errors, multiplies the search space, and gives noise a new lever to be mistaken for signal. Simple models generalize because complex ones cannot. The default complexity is lower than people think.

Most traders treat simplicity as a stylistic preference. The clean code, the elegant rule, the chart with one line on it. The aesthetic part of simplicity is real. The aesthetic part is also the least interesting reason to be simple.
The reason to be simple is statistical. Simpler models generalize better. They overfit less. They produce out-of-sample performance closer to their in-sample performance. The mechanism is mathematical and unavoidable: every additional parameter consumes data, inflates the variance of estimates, and provides another lever for noise to be mistaken for signal. Adding complexity is taking on statistical debt that has to be paid back later, usually in live trading.
Simplicity is not a defensive posture. It is an offensive weapon against overfitting, against data mining bias, and against the human tendency to mistake fitted noise for discovered structure. The trader who deploys simplicity as a deliberate tool destroys more bad strategies before they ship than any single backtest filter.
Why complex models look better in-sample
Every model has parameters. A moving-average crossover rule has two (the fast period and the slow period). A multi-factor stat-arb model has dozens. A neural network has millions. Each parameter is a number the researcher chose by fitting the model to data.
Each parameter is also a degree of freedom for the model to bend toward the training sample. With one parameter, the model can fit one shape. With two parameters, the model can fit two shapes simultaneously. With enough parameters, the model can fit any pattern in any sample, including all the noise.
This is not metaphor. It is provable. A polynomial of degree N can fit any N+1 data points exactly. A neural network with enough hidden units can approximate any function on the training set. The fit on the training data does not measure whether the model captured anything real. It measures the model's capacity to fit, which complex models have in abundance.
The in-sample fit of a complex model is therefore not evidence that the model has signal. It is evidence that the model has enough parameters to bend toward whatever was in the sample, including the noise. Out-of-sample, the noise is different, and the bent model fits the new noise badly.
The bias-variance trade-off
The formal version of this story is the bias-variance trade-off. Every model's expected prediction error decomposes into three parts:
Where the bias is the systematic error of the model (how wrong it is on average), the variance is how much the model's predictions change across different training samples, and the irreducible variance is the noise in the outcome that no model could remove.
Simple models tend to have high bias and low variance. They are wrong in consistent ways but stable across samples. Complex models have the opposite: low bias and high variance. They can fit any sample exactly, but their fits differ wildly between samples.
The total error is minimized at some intermediate complexity. For data with high signal-to-noise ratio (physics experiments, controlled trials), the optimum is on the complex side. For data with low signal-to-noise ratio (financial markets), the optimum is much closer to the simple end. Most traders set their complexity at the wrong end of the curve for the data they are working with.
The data-per-parameter problem
The simplest intuition for why complexity is dangerous is the data-per-parameter ratio.
Where N is the number of independent observations in the dataset and K is the number of parameters in the model. Common rules of thumb in econometrics require at least 10 to 30 observations per parameter for reliable estimation. Fewer than 10 means parameter estimates are too noisy to trust.
A daily-bar strategy backtested on five years of data has roughly 1260 observations. The effective N is smaller because of autocorrelation and regime changes, often closer to 200–400. With K = 5 parameters, observations per parameter is 40 to 80. Borderline. With K = 20 parameters, the ratio drops to 10 to 20. Marginal. With K = 100 parameters, the ratio is 2 to 4. Guaranteed overfit.
The number of independent observations in trading data is fundamentally limited by calendar time and market non-stationarity. The number of parameters in any model is chosen by the researcher. The trader who chooses many parameters has chosen to overfit and is then surprised when live results disappoint.
The exploding search space
The data-per-parameter ratio understates the problem because researchers typically search over many possible parameter values, not just one.
Take a rule with five parameters, each tested at ten possible values. The number of distinct rule variations is:
10 × 10 × 10 × 10 × 10 = 100,000 variations
The researcher runs all 100,000 backtests and picks the best one. The "best" variation has a backtested Sharpe that is, by sheer chance, well above the average of the 100,000. The reported Sharpe is the maximum of a distribution of 100,000 noisy samples, not the true expected value of the chosen rule. The selection process is the source of most of the apparent performance.
This is data mining bias and it scales with the search space. A rule with two parameters, each at five values, has 25 variations. The best of 25 is moderately above average. A rule with five parameters at ten values each has 100,000 variations. The best of 100,000 is dramatically above average, even with no real signal in the data.
Simpler rules have smaller search spaces and therefore smaller data mining bias. This is one of the strongest reasons to keep parameter counts low. Every parameter is multiplicative in the search space and the data mining penalty.
Information criteria: the formal penalty for complexity
Statisticians have built explicit penalties for complexity into model selection. The two most common are the Akaike Information Criterion (AIC) and the Bayesian Information Criterion (BIC):
Where K is the number of parameters, N is the sample size, and L̂ is the maximized likelihood of the model. Both criteria reward in-sample fit (the −2 ln(L̂) term) and penalize complexity (the term involving K). Lower is better. BIC penalizes complexity more aggressively than AIC, especially for large samples.
The practical use is to compare two models with different numbers of parameters. The simpler model can have a slightly worse in-sample fit and still be preferred if the gap in fit is smaller than the penalty for the extra parameters. The criteria formalize the intuition that complexity should pay its way: a parameter that improves fit by less than its complexity cost is destroying out-of-sample performance even when it improves in-sample performance.
For trading model selection, AIC and BIC are crude but useful. They are not the right criterion to optimize directly (live performance is the right criterion) but they are a sanity check on whether a more complex model is justified by its in-sample gains.
Visualizing the overfitting curve
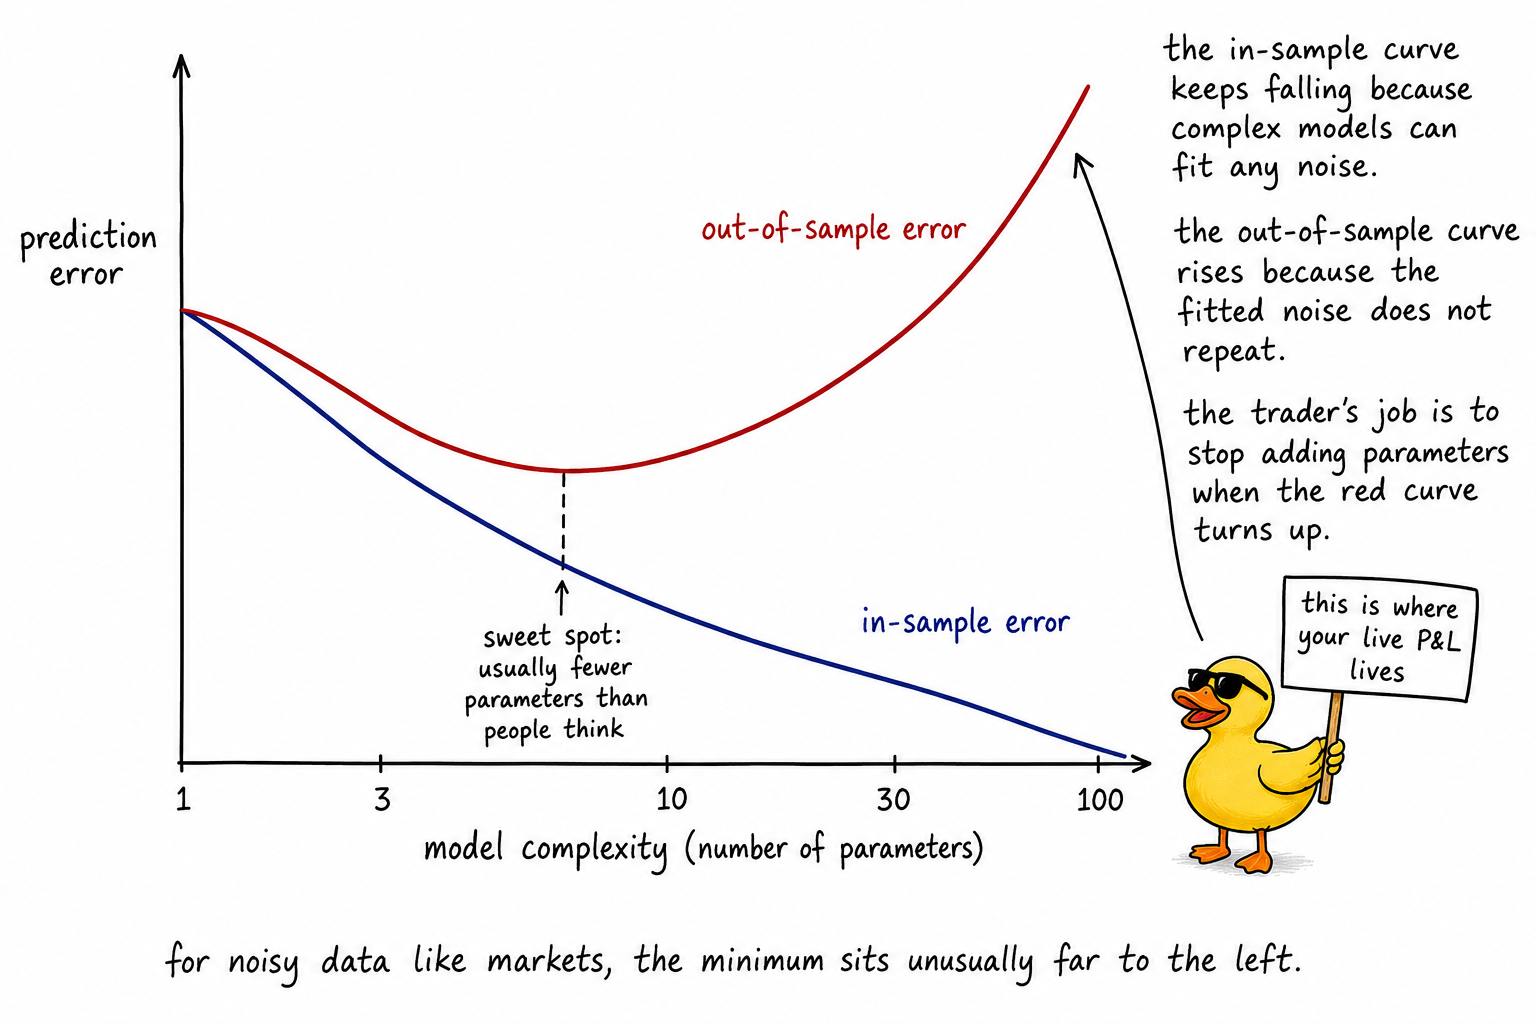
The picture is the central fact of model selection. The in-sample curve is what backtests show. The out-of-sample curve is what live trading delivers. The gap between them is the cost of every additional parameter.
Empirical evidence in trading
The case for simplicity in trading is not just theoretical. The empirical record across decades is consistent.
Trend-following with a single moving-average parameter has produced edge across markets, asset classes, and decades. The same family of strategies with elaborate multi-parameter optimization has rarely outperformed the simpler version in live trading.
Long-only equity index strategies (zero parameters) have outperformed the majority of actively managed funds (many parameters) over multi-decade horizons.
Risk parity strategies that allocate by volatility (one parameter per asset, the target volatility) have outperformed mean-variance optimization (a full covariance matrix worth of parameters) on most realistic out-of-sample windows.
Carry strategies in FX and commodities (one or two parameters: the carry signal and the holding period) have produced more consistent live results than parametric models attempting to forecast the underlying carry returns.
The pattern is not that simple always wins. The pattern is that simple wins more often than expected, and the gap between in-sample and out-of-sample performance is smaller for simple strategies.
When is complexity justified
Complexity is sometimes justified. Three conditions, all of which must hold:
The researcher has substantially more data than parameters. The effective N/K ratio is high enough that each parameter is estimated with low standard error. For trading data, this usually requires either intraday data on very liquid instruments or cross-sectional data across many assets.
Each additional parameter captures a distinct, mechanistically motivated source of variation. The parameters are not redundant or competing for the same signal. Each one has a story for why it should improve out-of-sample performance.
The complex model demonstrates out-of-sample improvement over the simple model under realistic conditions, including transaction costs, sampling variability, and regime changes. The improvement is robust across different out-of-sample windows, not specific to one chosen window.
When all three conditions hold, complexity pays its way. When any of them fails, complexity destroys value. The default assumption is that the conditions do not hold and that the simpler model is the better choice.
What this changes operationally
Three operational shifts.
Track the parameter count of every strategy and treat it as a risk metric on par with leverage or concentration. A strategy with 20 parameters and a Sharpe of 1.5 carries more model risk than a strategy with 3 parameters and a Sharpe of 1.0, even though the first looks better in the backtest.
Add complexity only when each addition pays for itself out of sample. Start with the simplest rule that could plausibly capture the target effect. Add a parameter only when its addition demonstrably improves out-of-sample performance on a held-out window that was not used in any earlier modeling decision.
Treat published strategies with skepticism that scales with their parameter count. A published rule with two parameters has had less opportunity to overfit and is more likely to be real. A published rule with 30 parameters has had more opportunity to overfit and is more likely to be noise that fit the publication's specific sample.
KEY POINTS
- Simplicity is not a stylistic preference. It is a statistical advantage. Simpler models generalize better, overfit less, and produce out-of-sample performance closer to in-sample performance.
- The bias-variance trade-off decomposes prediction error into bias² + variance + irreducible noise. Simple models have high bias and low variance. Complex models have the opposite. Total error is minimized at intermediate complexity; for noisy market data the optimum is much closer to the simple end than most practitioners assume.
- The data-per-parameter ratio (N/K) is the simplest sanity check. Common rules of thumb require at least 10–30 observations per parameter. Trading data with effective N of 200–400 supports only a small number of parameters before overfitting becomes inevitable.
- The search space explodes multiplicatively with parameters. A rule with 5 parameters at 10 values each has 100,000 variations. The "best" of 100,000 is dramatically above average by chance alone, even with no real signal.
- AIC and BIC formalize the penalty for complexity: AIC = 2K − 2 ln(L̂), BIC = K ln(N) − 2 ln(L̂). Lower is better. Both reward in-sample fit and penalize parameter count.
- Empirical evidence across decades favors simplicity: single-parameter trend-following, zero-parameter index strategies, single-parameter risk parity, low-parameter carry. The pattern is that simple wins more often than expected and survives the in-sample to out-of-sample transition better.
- Complexity is justified only when three conditions hold: large N/K ratio, each parameter captures a distinct mechanism, and the complex model demonstrably improves out-of-sample performance. Default assumption: the conditions do not hold.
- Operational fix: treat parameter count as a risk metric, add complexity only when each addition pays for itself out of sample, and apply skepticism to published strategies that scales with their parameter count.
References
- Evidence-Based Technical Analysis - David Aronson (Amazon)
- Systematic Trading - Robert Carver (Amazon)
- Factor Dimensionality and the Bias–Variance Tradeoff in Diffusion
- The Strategic Gap: How AI-Driven Timing and Complexity Shape
- Hypothesis Testing | CFA Institute
- Factor Dimensionality and the Bias-Variance Tradeoff in Diffusion
- [EPUB] Portfolio Structuring and the Value of Forecasting
- Why Financial Markets Do Not Work Well in the Real World - NBER
- The nonstationarity-complexity tradeoff in return prediction - arXiv
- Trading rights for riches: examining variation in provincial foreign