2.1 The Indicator Is More Important Than the Model
The indicator sets the ceiling that no model can break through. A linear regression on a high-quality indicator beats a deep neural network on a low-quality one. Most R&D effort is spent on the model, where the marginal returns are smallest. The bigger gains live in the inputs.
Most trading research effort flows toward models. The trader downloads a new ML library, tunes hyperparameters, runs grid searches, swaps in transformers, ensembles XGBoost with random forests, and reads papers about new architectures for time series. Months disappear. The strategy still underperforms.
The reason is structural. The model is the smaller part of the predictive stack. The indicator is the bigger part. Most retail research has the proportions inverted, spending the bulk of the time on the smallest contributor to performance.
The cleanest formulation: a linear regression on a high-quality indicator will outperform a deep neural network on a low-quality one in most empirical settings. This is not opinion. It is a consequence of how information flows through models, and it is the foundation of the entire indicator engineering pillar of this publication.
The data-processing inequality
Information theory gives the formal statement. For any function f applied to an input X to produce a prediction about target Y:
Where I(·; ·) is the mutual information between two random variables. The inequality says that no transformation of X can carry more information about Y than X itself does. A model is a transformation. Its output cannot be more informative about the target than the input was.
The practical translation: the indicator sets the ceiling on what any model can extract. If the mutual information between the indicator and tomorrow's return is low, no model on that indicator can predict tomorrow's return well. The model can fail to extract what is there. It cannot create signal from nothing.
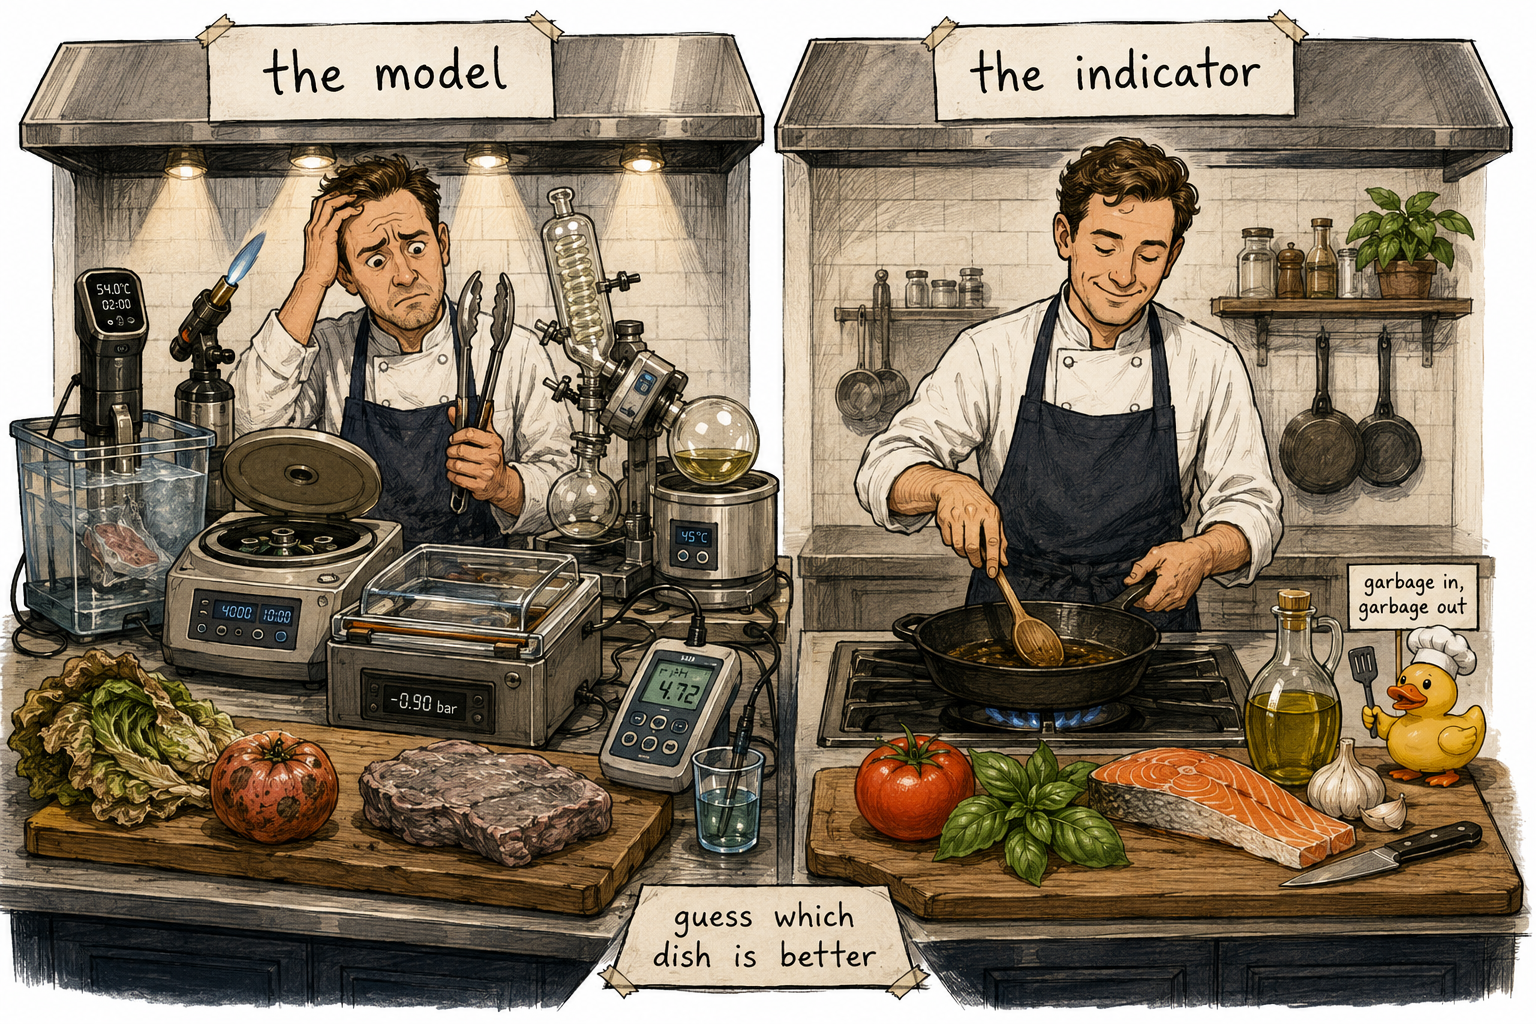
This is the formal version of "garbage in, garbage out." It is also the reason that switching from linear regression to a neural network rarely helps when the indicators are weak. The ceiling is the same.
The hierarchy of trading R&D
Real trading research has four layers, in descending order of impact.
- Data quality. Point-in-time accuracy, survivorship-free universes, dividend handling, corporate actions, trade-time fills not close-time fills. A model trained on bad data is wrong before it starts.
- Indicator quality. Mutual information with the target, stationary distribution, well-spread values, controlled tails, theoretical motivation. The indicators are the language in which the model thinks. Good indicators put the predictive content in front of the model. Bad indicators bury it.
- Model quality. Regularization, validation methodology, choice of objective, hyperparameter selection. The model decides how to combine indicators into a forecast. A good model on good indicators improves marginally over a bad model on the same indicators. A good model on bad indicators usually performs the same as a bad model on bad indicators.
- Execution quality. Slippage, latency, fills, transaction costs. The trade is the realization of the forecast. Good execution converts forecasts into P&L. Bad execution destroys forecasts before they realize.
The retail and academic R&D worlds invert this. Most published work focuses on layer 3. Most retail effort focuses on layer 3. The marginal returns on layer 3 work are small once layers 1 and 2 are clean. The marginal returns on layer 2 work are large at every stage.
Why the field gets this wrong
Three forces push effort toward the model layer.
Models are flashy. A new neural architecture has a paper, a brand, a leaderboard. An ATR-normalized momentum indicator has none of that. Effort follows visible reward, and the visible reward is in the model layer.
ML libraries are convenient. Scikit-learn, PyTorch, and XGBoost make it trivial to drop in a new model with five lines of code. Indicator engineering requires domain knowledge, careful thought, and code written from scratch. Convenience beats correctness in default behavior.
Marketing aligns with model effort, not indicator effort. The vendors of ML tools, ML courses, and ML books have an incentive to convey that the model is the critical part. The vendors of "indicator quality assessment tools" do not exist as an industry, so there is no marketing budget for the correct answer.
The result is a research culture that polishes the smallest contributor to performance. Capital follows attention. Attention follows the loudest marketing. The loudest marketing is in the wrong place.
Worked example: same target, different inputs
Target: predict the sign of SPX's next-day return.
Input 1: raw close price level. Train a logistic regression. Out-of-sample AUC: approximately 0.50. The raw price level has almost no mutual information with the next-day return direction.
Input 2: yesterday's one-day return. Same model. Out-of-sample AUC: approximately 0.51. Slightly informative because of weak autocorrelation, but not by much.
Input 3: yesterday's one-day return, ATR-normalized (divided by 20-day ATR), then passed through a sigmoid transform that compresses tails. Same logistic regression. Out-of-sample AUC: approximately 0.53.
Now try XGBoost on Input 1. AUC: still 0.50. The model upgrade did nothing because the input had no information.
Try a deep transformer on Input 2. AUC: 0.51 ± noise. The model upgrade did nothing because the input did not have much more to give.
The linear regression on Input 3 beats the transformer on Input 1 and the transformer on Input 2. The difference between the worst result and the best result was entirely in the indicator design. The model layer was a constant.
This pattern repeats across most empirical studies of indicator quality versus model complexity. Investing the marginal hour in better indicators usually pays more than investing it in better models.
What "indicator quality" means
Pillar 2 of this publication is a tour of the components of indicator quality. The components, in brief:
Information content. Mutual information, correlation, or other measures of dependence between the indicator and the target. This is the upper bound on what any model can extract.
Stationarity. The indicator's distribution should be stable over time. An indicator whose mean and variance drift across decades is not predicting the same thing in different decades.
Distribution shape. Values should be spread across a meaningful range, not clumped into one or two narrow bands. Clumped distributions force models to focus on the spread and ignore the clumps, where the predictive content often hides.
Tail behavior. Heavy tails with outliers degrade most models. Tails should be controlled by transformation (sigmoid, log, rank) so that extreme values do not dominate the model's loss function.
Theoretical motivation. The indicator should have a reason to be predictive based on market structure, behavioral patterns, or microstructure. An indicator that has no theoretical reason to predict the target is most often capturing noise.
The remaining articles in this pillar work through these components individually: relative entropy as a quality score, range/IQR as a tail diagnostic, sigmoid transformations, ATR normalization, stationarity tests, smoothing filters, frequency-response analysis, and the trade-offs each technique involves.
Visualizing the ceiling
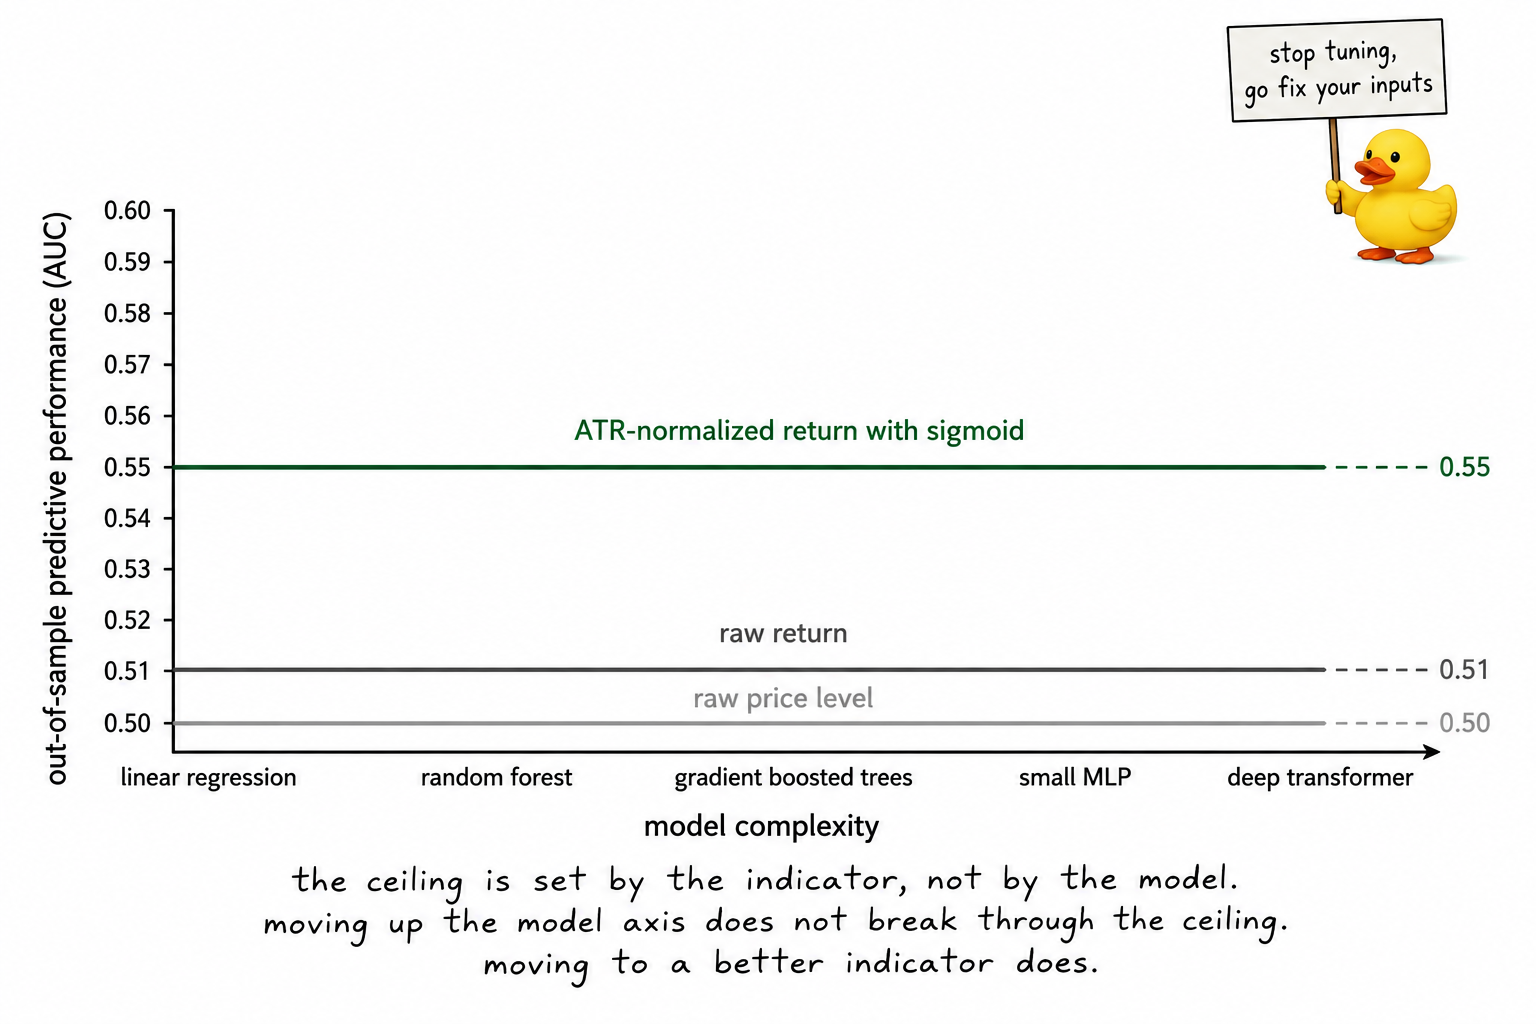
The picture is the central claim. The model axis does not lift the curve. The indicator axis does.
Why a complex model on bad inputs is worse than useless
The asymmetry is not symmetric. A complex model on a bad indicator does not just fail to extract more signal. It actively overfits the noise that is there.
A linear regression on a low-information indicator produces a near-zero coefficient and a near-flat forecast. The model is honest about the input's lack of content. A complex model on the same input has enough capacity to find spurious patterns in the noise. The in-sample fit looks better. The out-of-sample performance is worse because the complex model has memorized noise the simple model ignored.
This is the bias-variance trade-off from article 21 applied to indicator engineering. When the indicator carries no real information, every additional parameter is a parameter consumed by fitting noise. Simple models fail gracefully on bad inputs. Complex models fail catastrophically.
The corollary: a complex model that outperforms a simple one is mild evidence that the inputs contain real structure. A complex model that underperforms a simple one is strong evidence that the inputs are mostly noise. The model class is a diagnostic for the indicator's content, not just a tool for prediction.
What this changes operationally
Three shifts in how research time gets allocated.
Spend most of the R&D time on indicator design, not model selection. The default time budget for a new project is roughly 70% on data preparation and indicator engineering, 20% on modeling, 10% on validation and stress testing. Most retail teams allocate the inverse and underperform for that reason.
Use linear regression as the default model. It is fast, transparent, and reveals indicator problems immediately. If linear regression cannot extract anything from an indicator set, the inputs are weak. Escalating to a more complex model is unlikely to help. The complex model will overfit and look better in sample without extracting more real information.
When a model is failing, fix the inputs before fixing the model. The instinct is to swap models. The right move is to look at the indicators: are they stationary, well-distributed, transformed appropriately, and theoretically motivated? Almost always at least one of these is broken. Fixing it produces more performance than any model change.
KEY POINTS
- The model is the smaller part of the predictive stack. The indicator is the bigger part. Most retail R&D inverts this allocation.
- The data-processing inequality says I(f(X); Y) ≤ I(X; Y). No model can extract more information about the target than the indicator carries. The indicator sets the ceiling.
- The R&D hierarchy in order of impact is: data quality, indicator quality, model quality, execution quality. Effort should flow in that order. Most published work focuses on the third layer.
- A linear regression on a high-quality indicator will usually outperform a deep neural network on a low-quality one. The model upgrade does not break through the ceiling that the indicator sets.
- Indicator quality has five components: information content, stationarity, distribution shape, tail behavior, and theoretical motivation. Each is the subject of subsequent articles in this pillar.
- Complex models on bad indicators do not just fail to extract more signal. They actively overfit the noise that is there and underperform simple models out of sample.
- The model class is a diagnostic for indicator quality. A complex model that does not beat a simple one is strong evidence that the inputs are mostly noise.
- When a model is failing, the default suspect is the inputs, not the model class. Diagnose the indicators first. Escalate to a more complex model only after the inputs have been cleaned.
- Default time allocation for a new project: 70% on data and indicator engineering, 20% on modeling, 10% on validation. Most teams use the inverse.
References
- Statistically Sound Indicators for Financial Market Prediction - Timothy Masters (Amazon)
- Cycle Analytics for Traders - John Ehlers (Amazon)
- Financial Signal Processing and Machine Learning
- Algorithm Design for Stock Price Prediction System Based on
- What Is Quality? (Summary)
- Towards Evaluation of Reimagined Parental Control Tool Through
- Multi-scale periodic analysis of financial indexes for quantitative
- Financial Analysis Techniques | CFA Institute
- A Markov Chain Quasi-Monte Carlo Method for Bayesian Estimation
- TECHNICAL ANALYSIS - CFA Institute Research and Policy Center