3.12 The Difference Between Robustness and Optimization
Optimization climbs the sharpest peak. Robustness picks the widest plateau. The IS-optimal set is rarely robust. The robust set is rarely IS-optimal. OOS is the true distribution. Pick the plateau.
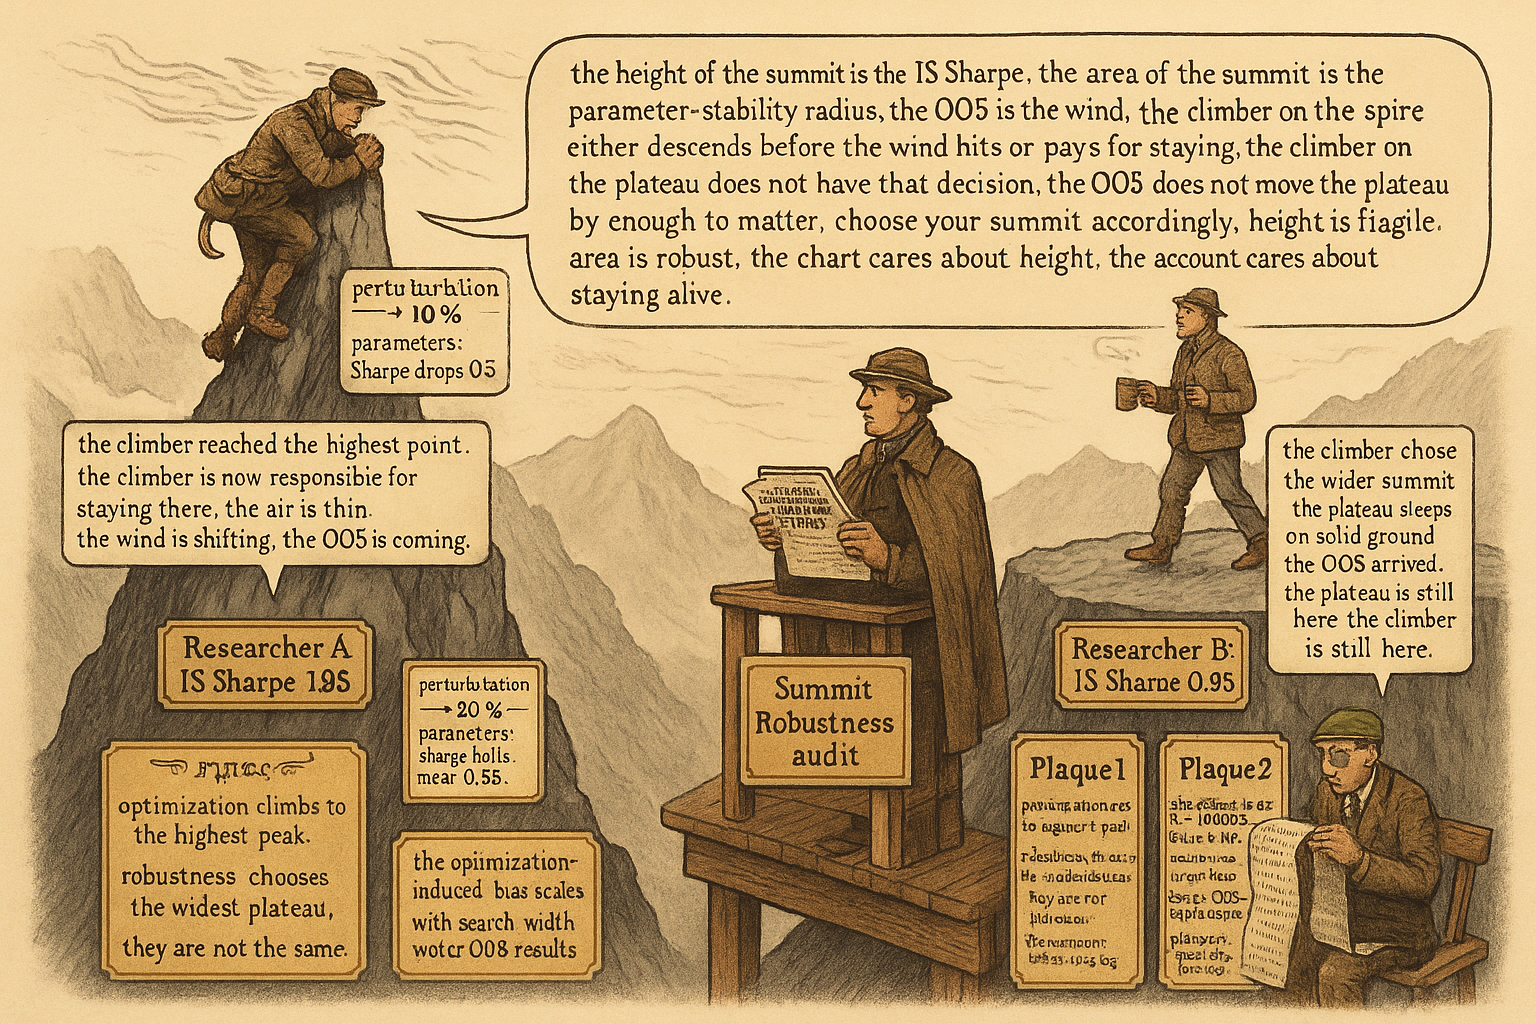
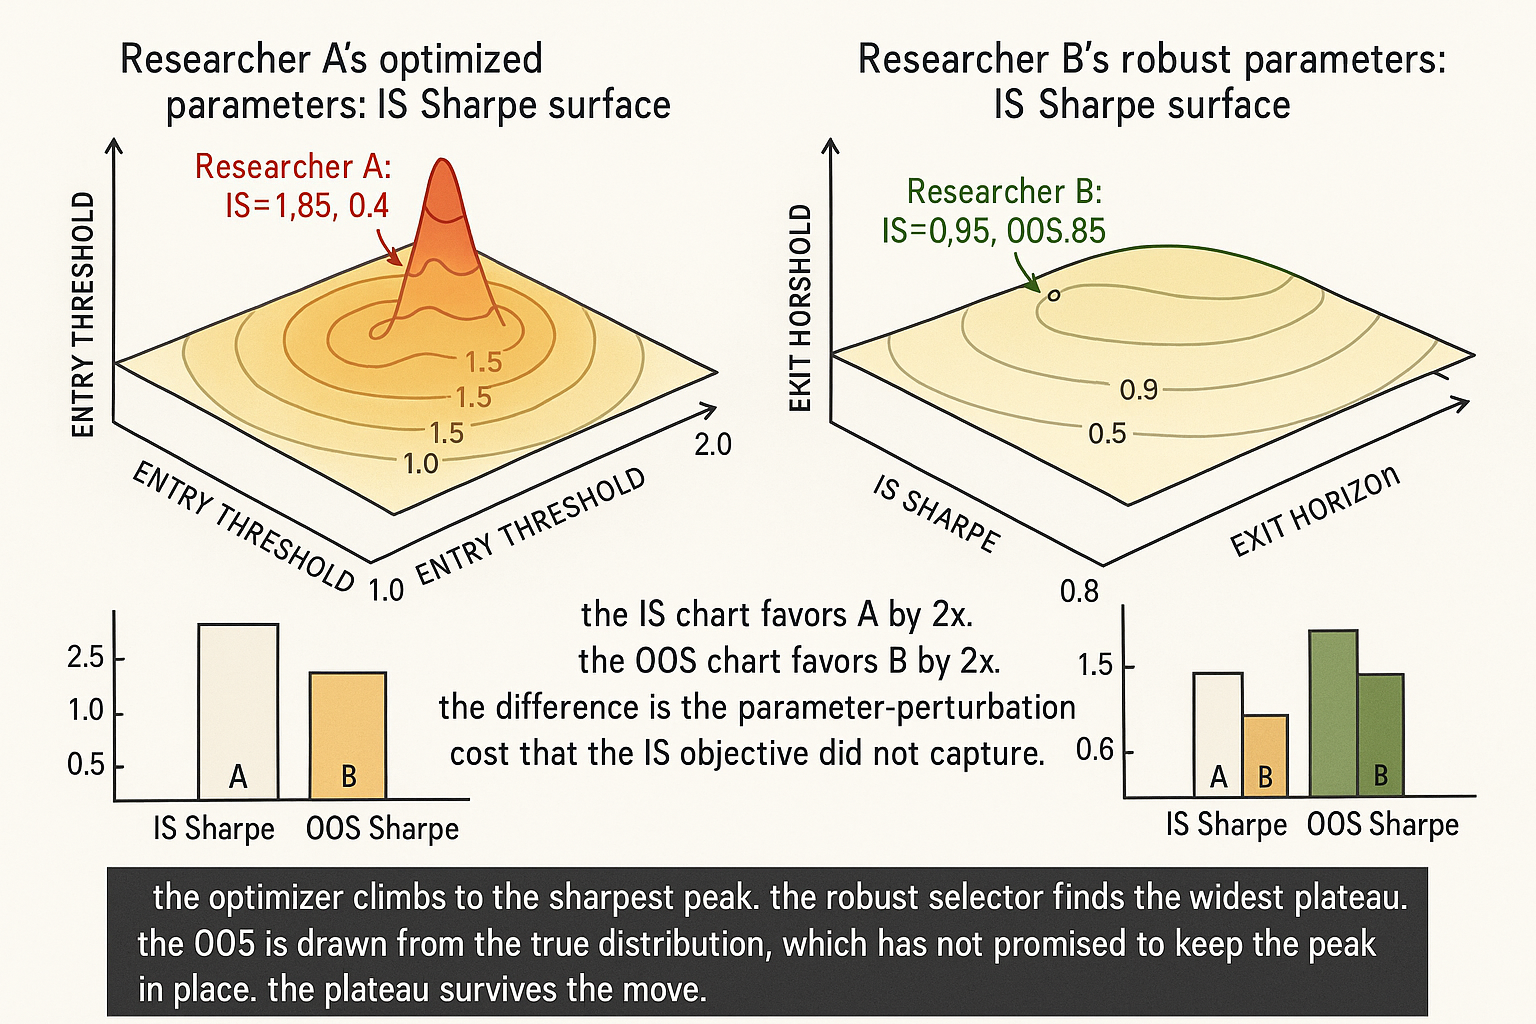
Two researchers build the same nominal strategy: a momentum filter on a basket of 30 futures contracts, with an entry threshold and an exit horizon. Researcher A spends six months optimizing the strategy. The final spec uses entry threshold 1.42 sigma, exit horizon 14 bars, vol-target 12%, instrument-specific position multipliers ranging from 0.7 to 1.3, and a session filter that excludes the first and last 30 minutes. The IS Sharpe is 1.85. Researcher B spends six weeks. The final spec uses entry threshold 2.0 sigma, exit horizon 20 bars, vol-target 10%, equal weights across instruments, no session filter. The IS Sharpe is 0.95. Both strategies ship in January 2022. Live performance through 2024: Researcher A Sharpe 0.4, max drawdown 18%. Researcher B Sharpe 0.85, max drawdown 11%.
Researcher A optimized. Researcher B chose robust. The IS Sharpe favored A by almost a factor of two. The OOS performance favored B by the same factor. The pattern is the structural consequence of the difference between optimization (best in-sample fit) and robustness (insensitivity to parameter and regime variation). Calling it luck or anomaly misses the mechanism. Most published research and most retail trading literature conflates the two. The articles in this pillar so far covered specific cases of the conflation: stationarity violations that killed a tuned strategy ("Stationarity: The Word Every Trader Ignores Until It Kills the Strategy"), regime mismatch between IS and OOS ("Why OOS Failure Is Often a Stationarity Failure"), the rolling-window-length overfit ("Rolling Normalization: Useful Tool or Hidden Overfit?"). This article gives the upstream conceptual frame: optimization is the wrong objective, robustness is the right one, and the two are usually in direct opposition.
Operational definitions
Operational definitions, not philosophical ones.
Optimization. The process of searching parameter space to maximize an in-sample objective (Sharpe, expectancy, profit factor, equity-curve smoothness). The output is a single parameter set that scored highest on the IS objective. The process is well-understood, well-supported by libraries, and produces visually compelling results. The process also produces parameter sets that are tuned to the specific noise of the IS sample.
Robustness. The property that the strategy's performance does not depend sensitively on small changes to parameters, on the specific market or time period of the backtest, or on the inclusion or exclusion of specific trades. A robust strategy with parameter set X has approximately the same realized Sharpe at parameter set X', X+epsilon, and X-epsilon for small perturbations. A robust strategy on SPX has approximately the same Sharpe (within statistical noise) when applied to similar instruments. A robust strategy on 2010-2019 has approximately the same Sharpe on 2000-2009 (after accounting for known regime differences).
The two are not synonyms. The optimal parameter set is typically not robust because the optimizer climbed to a sharp peak that does not survive perturbation. The most robust parameter set is typically not optimal in-sample because it sits at the center of a flat plateau rather than the top of a peak. The article "The Hill, the Spike, and the Cliff: Reading Optimization Surfaces" later in this pillar covers the visual diagnosis of which surface you are climbing.
Optimization loses to robustness OOS
Three structural reasons.
Reason 1: the IS objective contains noise. Any IS Sharpe is the true unobservable Sharpe plus sampling noise. The standard error of an IS Sharpe with N trades is approximately 1 / sqrt(N - 1). Optimizing to maximize IS Sharpe pulls the parameter set toward the peak of the noise plus the peak of the true edge. The OOS realization is drawn from the true distribution and the noise component does not replicate. The OOS Sharpe is lower by the magnitude of the noise contribution.
Reason 2: the parameter surface has many local maxima. A strategy with five parameters over a reasonable grid has thousands or millions of candidate parameter sets. The "best" set is the maximum over a noisy realization of a function with thousands of local maxima. The maximum over many noisy values is biased upward by an amount that scales with the search width and the noise level. The article "Why More Parameters Make a Strategy Easier to Sell and Easier to Break" later in this pillar quantifies this concern; the present article frames the conceptual consequence.
Reason 3: optimization rewards sharpness. A parameter set that produces a high but narrow peak in IS Sharpe is preferred by the optimizer over a parameter set that produces a slightly lower but wider plateau. The narrow peak is fragile to any change in the underlying distribution; the wide plateau is robust. Optimization, as a procedure, chooses the fragile option because the IS objective does not penalize fragility.
Tools for choosing a robust parameter set
Five operational tools.
Tool 1: parameter-stability mapping. Plot the IS Sharpe as a function of each parameter, with all other parameters held at the optimum. A robust optimum sits on a wide plateau where the Sharpe is approximately constant across a range of values. A fragile optimum sits on a sharp peak. Choose the parameter from the plateau region rather than from the peak. The article "Parameter Stability Beats Best Parameter" later in this pillar covers the technique in detail.
Tool 2: bootstrap parameter selection. Bootstrap the IS sample many times and re-optimize on each bootstrap. The distribution of optimal parameters across bootstraps is the parameter uncertainty. A robust strategy has tight bootstrap parameter distributions. A fragile strategy has wide bootstrap distributions. The right parameter choice is the median or mode of the bootstrap distribution, not the global IS optimum.
Tool 3: cross-market robustness. Run the same strategy on multiple comparable markets (SPX, NDX, RTY, EURO STOXX, NIKKEI). A robust parameter set produces positive Sharpe on most or all of them. A fragile parameter set is positive on the original market and near-zero or negative on the others. The article "Why Works on All Markets Is Usually a Red Flag" later in this pillar gives a contrarian view of the cross-market test; the present article uses the test as one diagnostic among several rather than as a sole criterion.
Tool 4: time-period robustness. Run the same strategy on non-overlapping time periods (1990-1999, 2000-2009, 2010-2019). A robust parameter set is positive across most or all of the periods. A fragile set is positive on one and negative on others. Combined with regime stratification (covered in "Regime Coverage: Why Your Backtest Needs Different Market States"), the time-period check is a useful but coarse test.
Tool 5: parameter perturbation. Compute the IS Sharpe at the optimum and at small perturbations of each parameter (e.g., +/-10%, +/-25%, +/-50%). Plot the resulting Sharpes. A robust optimum has gentle declines under perturbation. A fragile optimum has steep declines. Reject parameter sets that lose more than 25% of the IS Sharpe under +/-25% perturbation; the OOS will be much worse than that.
The math of the optimization-vs-robustness trade-off
A simple model that captures the structural pattern. Assume the true Sharpe at parameter set theta is a smooth function with mean SR_true(theta), and the realized IS Sharpe is the true Sharpe plus mean-zero noise with standard error sigma_IS.
$$ \widehat{\text{SR}}_{\text{IS}}(\theta) = \text{SR}_{\text{true}}(\theta) + \varepsilon(\theta), \qquad \mathbb{E}[\varepsilon] = 0, \quad \text{Var}[\varepsilon] = \sigma_{\text{IS}}^2 $$
The optimizer chooses theta_hat = argmax_theta SR_IS(theta). The expected OOS Sharpe at theta_hat is approximately the true Sharpe at the location where the noise was largest, not the location where the true Sharpe is largest. The expected loss from optimization (the gap between the IS optimum's IS Sharpe and the same parameter's OOS Sharpe) scales with sigma_IS times the search width.
$$ \mathbb{E}[\widehat{\text{SR}}_{\text{IS}}(\hat{\theta}) - \text{SR}_{\text{true}}(\hat{\theta})] \approx \sigma_{\text{IS}} \cdot \sqrt{2 \log K} $$
K is the effective number of independent parameter combinations searched. For K = 100, the inflation is approximately 3 standard errors. For K = 10000, it is approximately 4 standard errors. The IS-optimal Sharpe is biased upward by this amount, and the OOS Sharpe falls short of the IS Sharpe by the same amount on average. The robust choice (the median of the parameter-perturbation distribution rather than the IS optimum) avoids the search-width bias and produces an unbiased estimate of OOS performance.
Cases where optimization fits
Three conditions under which optimization is the right tool.
Condition 1: the optimization target is robustness, not in-sample fit. An optimizer can be run on a robustness objective (e.g., minimize the variance of cell-stratified Sharpes from "Regime Coverage: Why Your Backtest Needs Different Market States"). The optimizer is then choosing the parameter set that produces the most consistent performance across regimes, not the highest in-sample number. The result is robust by construction.
Condition 2: the parameter space is small relative to the sample size. With three parameters and 5000 trades, the optimization-induced bias is small. With twenty parameters and 500 trades, the bias is overwhelming. Apply the "10% rule" from the article "The 10% Rule of Degrees of Freedom" as the operational threshold.
Condition 3: the optimization is constrained to plateau regions. Some optimizers (Bayesian optimization with a smoothness prior, regularized optimization with a complexity penalty, multi-objective optimization that includes parameter stability) are designed to find robust optima rather than IS-optimal ones. These produce different parameter choices than the standard maximize-IS-Sharpe procedure.
In most retail and small-shop research, none of the three conditions hold. The default optimizer maximizes IS Sharpe, the parameter space is wide, and the objective is not robustness. The output is by construction not robust.
Anti-patterns
Five mistakes specific to the optimization-vs-robustness conflation.
Anti-pattern 1: presenting the IS-optimal parameter set as the strategy. The IS-optimal set is one realization of an estimator; it is not the strategy. The strategy is the parameter set that survives the robustness checks (parameter perturbation, cross-market, cross-period, bootstrap selection). Reporting only the IS-optimal set hides the strategy's actual fragility.
Anti-pattern 2: treating "we optimized over many parameters" as a virtue. The optimization process inflates the IS Sharpe by an amount proportional to the search width. Wide searches produce more impressive IS results and worse OOS results. The right framing: the search width is a cost, not a feature.
Anti-pattern 3: re-optimizing in response to OOS underperformance. The strategy underperforms; the researcher re-optimizes on the recent data; the new parameters validate well on the new IS and fail on the next OOS. The cycle continues. Each re-optimization is overfitting to the most recent regime. The right response to OOS underperformance is the diagnostic flow from "Why OOS Failure Is Often a Stationarity Failure" and the decommission policy from "How to Detect When a Trading System Is Dying", not re-optimization.
Anti-pattern 4: optimizing on a smoothed equity curve. The optimizer maximizes Sharpe, profit factor, or some similar aggregate. The aggregate hides the within-strategy fragility. A strategy with a smooth equity curve in IS that depends on perfectly-timed regime entries is more fragile than a strategy with a noisier equity curve that does not depend on regime timing.
Anti-pattern 5: assuming optimization reveals the "best" strategy. The optimization reveals the best fit to the IS sample. The two are different. The best strategy is the one with the highest unconditional expected Sharpe, which is best estimated by the median of robust-selection methods, not by the maximum of an IS objective.
Decision matrix
| Research stage | Right tool | Wrong tool |
|---|---|---|
| Strategy hypothesis generation | Domain knowledge + structural priors | IS-Sharpe-driven parameter search |
| Initial validation | Crude parameters, broad backtest | Optimized parameters before validation |
| Parameter selection | Robustness checks, bootstrap median | Maximum IS Sharpe |
| Cross-market test | Equal weights, broad sample | Per-market optimized parameters |
| Pre-deployment | Parameter perturbation, regime coverage | "Final tweak" optimization |
| Live monitoring | Diagnostic panel, kill switches | Re-optimization on live data |
| Post-decommission | Post-mortem, robustness audit | Re-optimization to "save" the strategy |
The matrix maps research stage to the right tool. The pattern: optimization belongs at the end of a robust-selection pipeline, not at the beginning, and not in response to live data. The article "Optimization Comes After Testing, Not Before" later in this pillar covers the procedural version of this principle.
Visualizing the trade-off
KEY POINTS
- Optimization maximizes the in-sample objective. Robustness is the property that performance does not depend sensitively on parameters, market, or time period. The two stand in direct opposition under most conditions, despite being conflated in practice.
- The IS-optimal parameter set is typically not robust because the optimizer climbs to a sharp peak that does not survive perturbation. The most robust parameter set is typically not IS-optimal because it sits on a plateau.
- Three structural reasons optimization loses OOS: the IS objective contains noise, the parameter surface has many local maxima with the maximum-of-noise bias, optimization rewards sharpness over plateau-width.
- The optimization-induced bias scales with sigma_IS times sqrt(2 log K) where K is the effective number of parameter combinations searched. For K=100, the bias is approximately 3 standard errors. For K=10000, approximately 4 standard errors.
- Five tools for choosing robust parameters: parameter-stability mapping (plot Sharpe against each parameter), bootstrap parameter selection (re-optimize on bootstraps and use the median), cross-market robustness (positive on multiple comparable markets), time-period robustness (positive on multiple non-overlapping windows), parameter perturbation (Sharpe survives +/-25% changes).
- Three conditions when optimization is appropriate: the objective is robustness rather than IS fit, the parameter space is small relative to sample size (the 10% rule), the optimizer is constrained to plateau regions through smoothness priors or complexity penalties.
- Anti-pattern: presenting the IS-optimal parameter set as the strategy. The strategy is the parameter set that survives robustness checks, not the one that maximized IS.
- Anti-pattern: treating "we optimized over many parameters" as a virtue. Search width is a cost, not a feature.
- Anti-pattern: re-optimizing in response to OOS underperformance. Each re-optimization overfits to the most recent regime. The right response is the diagnostic flow and the decommission policy.
- Anti-pattern: optimizing on a smoothed aggregate (Sharpe, profit factor) without checking the within-strategy regime sensitivity.
- The current article gives the conceptual frame. The next article in the publication ("Why Works on All Markets Is Usually a Red Flag") covers a contrarian case: the cross-market robustness check, taken naively, can also mislead.
References
- Testing and Tuning Market Trading Systems - Timothy Masters (Amazon)
- Data Mining Algorithms in C++ - Timothy Masters (Amazon)
- Statistical Overfitting and Backtest Performance
- Optimal Trading Rules without Backtesting
- Backtesting
- Backtesting and Simulation (CFA Institute Refresher Reading)
- Improving the Robustness of Trading Strategy Backtesting with Boltzmann Machines and Generative Adversarial Networks
- The GT-Score: A Robust Objective Function for Reducing Overfitting in Data-Driven Trading Strategies
- An Explainable Walk-Forward and Bootstrap Backtesting Framework for Trading Strategies
- Walk Forward Correlation: A Diagnostic for Over-Fitting and Robustness in Algorithmic Trading Systems