3.17 Why More Parameters Make a Strategy Easier to Sell and Easier to Break
More parameters raise IS Sharpe and pitch quality. More parameters lower the bias-corrected Sharpe and OOS survival. The curves diverge after a small count. The mandate-winner is not the survivor.
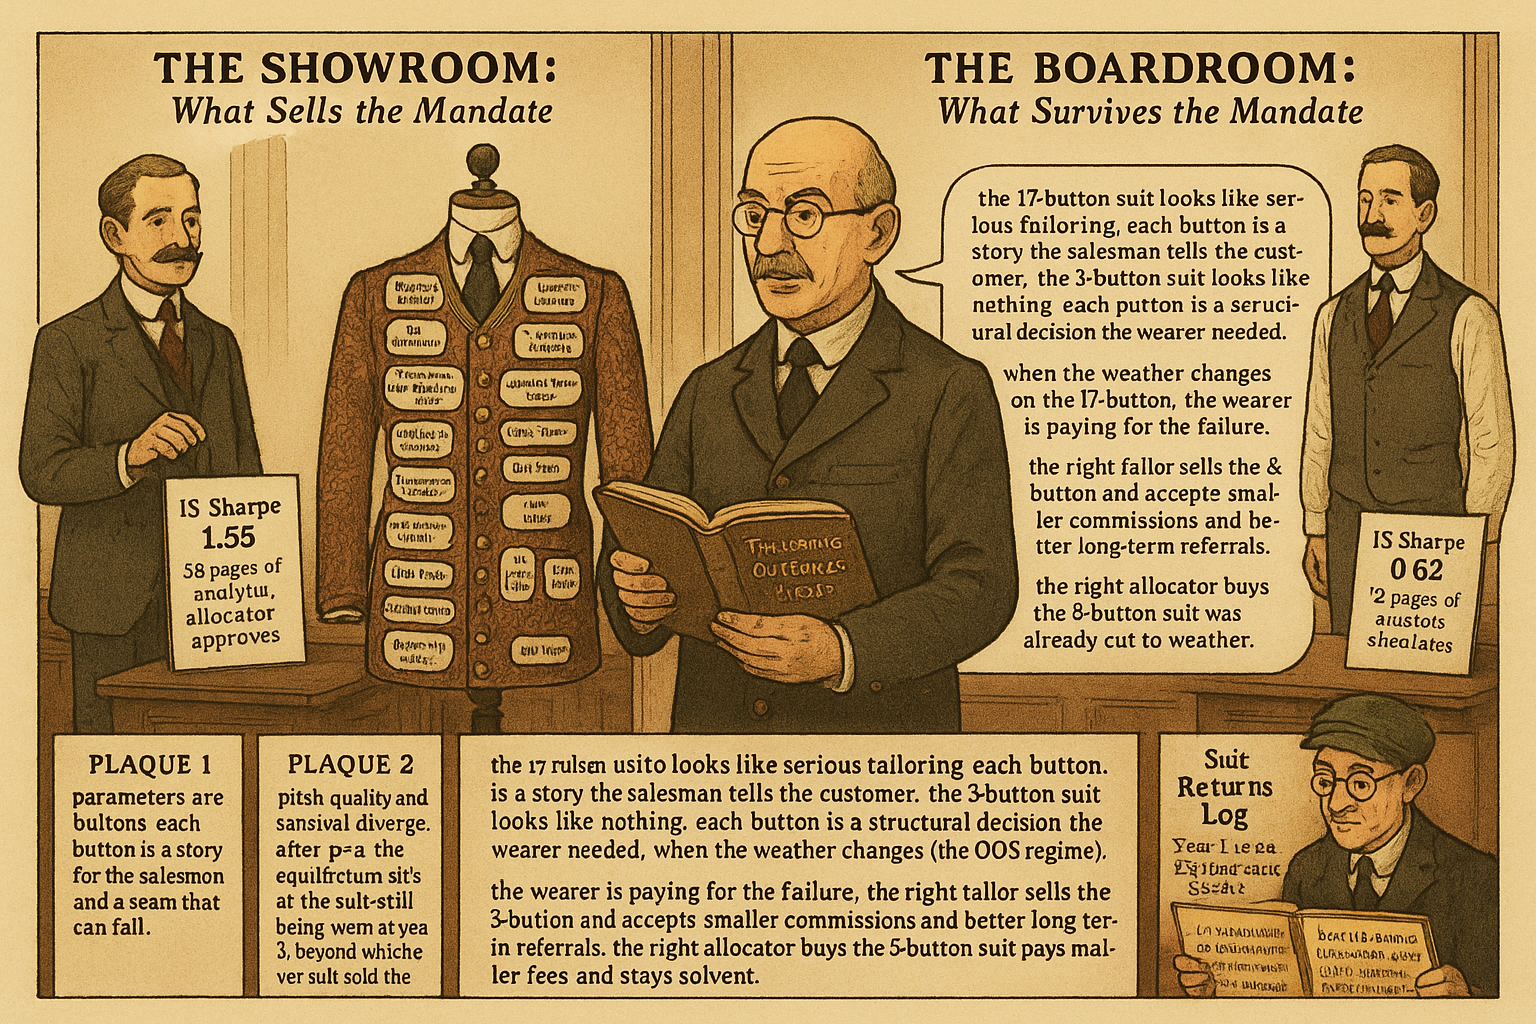
Two strategies are presented to the same allocator on the same morning. Strategy A is a long-short equity factor with three explicit parameters: 12-month formation period, equal-weighted decile portfolios, monthly rebalance. The pitch deck is twelve pages. The IS Sharpe is 0.62 over thirty years. The factor exposure decomposition is one paragraph. The allocator says: "looks too simple, what is the edge here that is not already arbitraged?". Strategy B is a multi-signal ensemble with seventeen parameters: regime classifier, volatility estimator, sector tilts, value-momentum-quality blend with adaptive weights, drawdown-conditional position sizing, machine-learning-driven entry timing, cross-asset confirmation. The pitch deck is fifty-eight pages with shaded charts, optimization heatmaps, and per-factor attribution. The IS Sharpe is 1.55 over the past decade. The allocator says: "this team has done serious work, the methodology is sophisticated".
Three years later, Strategy A is still trading at approximately Sharpe 0.55. Strategy B has decommissioned, returned 40% of capital, and the team is rebuilding. The allocator has fired Strategy B's manager and re-allocated to Strategy A's team. The pattern has repeated thousands of times in real allocator-manager relationships. The simple strategy looked unimpressive on the pitch but survived deployment. The complex strategy looked impressive on the pitch and broke under live conditions.
The article "Degrees of Freedom in Trading Systems" gave the formal counting framework. This article gives the asymmetry it produces in the marketing-vs-engineering tradeoff. Each additional parameter accomplishes two things: (1) it improves the IS Sharpe by raising the maximum-of-noise floor, which makes the pitch more compelling; (2) it raises k_eff, which inflates the IS-OOS gap and makes the strategy more fragile in deployment. The two effects work in opposite directions for the strategy's lifecycle. Adding parameters helps win the mandate. Adding parameters loses the mandate when deployed. The asymmetry is the structural consequence of how the IS objective and the OOS performance respond differently to model complexity. Calling it a paradox hides the mechanism.
The mechanics of "more sellable"
Five mechanisms by which adding parameters improves the pitch.
Mechanism 1: higher IS Sharpe. The expected maximum of k_eff noisy realizations of the true Sharpe scales with sqrt(2 log k_eff). Adding parameters raises k_eff and the headline IS Sharpe with it. A pitch with IS Sharpe 1.5 sells more easily than a pitch with IS Sharpe 0.6, regardless of which one is real.
Mechanism 2: more dimensions of "robustness narrative". Each parameter generates an optimization heatmap, a parameter-stability plot, a sensitivity analysis. The pitch deck has more content. Each chart suggests the team performed careful work. The total pages of analysis correlate (in the allocator's perception) with the rigor of the research, even though the actual rigor is the opposite of the parameter count.
Mechanism 3: more flavors of explanation. With seventeen parameters, the team can explain why the strategy worked in any historical regime by pointing to the parameter that "captured" that regime. The strategy worked in 2008 because the volatility regulator activated. The strategy worked in 2020 because the drawdown filter dampened. Each explanation is post-hoc and possibly correct, but the pattern (each historical event has a corresponding parameter) is suspicious in the same way that an explanation that fits all data is suspicious in any field.
Mechanism 4: defensibility under questioning. An allocator who asks "why did the strategy underperform in 2017?" gets a different answer from a 17-parameter strategy than from a 3-parameter strategy. The 17-parameter strategy can claim "the regime filter detected late, we have updated the threshold for next time". The 3-parameter strategy must answer "the strategy is meant to underperform in years like 2017 because the structural premise weakens; we did not change anything". The first answer sounds more responsive; the second is more honest.
Mechanism 5: differentiation from competitors. Many strategies look similar at the structural-prior level (everyone has a momentum factor, a value factor, a quality factor). The differentiation in the pitch comes from the proprietary additions (the regime classifier, the adaptive weights, the cross-asset confirmation). Each addition is a parameter. The pitch becomes more distinct from competitors at the cost of becoming more fragile.
The mechanics of "easier to break"
Four mechanisms by which adding parameters reduces deployment survival.
Mechanism 1: search-width inflation. Each additional parameter multiplies k_eff. The article "Degrees of Freedom in Trading Systems" framed the counting; the deployment-failure consequence is that the bias-corrected IS Sharpe drops faster than the raw IS Sharpe rises. Adding a parameter typically improves raw IS Sharpe by 0.1-0.3 units while inflating the bias by 0.05-0.2 units. The expected OOS gain is small or negative.
Mechanism 2: regime-overfit per parameter. Each parameter is tuned to the IS regime distribution. When the OOS regime distribution drifts (covered in "Slow Wandering: The Most Dangerous Type of Market Change") each parameter contributes a regime-mismatch loss. The 17-parameter strategy has 17 sources of regime drift; the 3-parameter strategy has 3.
Mechanism 3: implementation complexity. Each parameter requires data, monitoring, and operational discipline. The 17-parameter strategy has 17 things that can go wrong in production: a stale data feed, a missed reset, a vendor outage, a bug in one of the sub-models. The 3-parameter strategy has 3. Operational reliability scales inversely with parameter count.
Mechanism 4: communication failure on decommission. When the strategy underperforms, the allocator and the manager need to agree whether the underperformance is structural (decommission) or transient (extend runway). For a 3-parameter strategy, the diagnosis is straightforward: the structural premise either holds or not. For a 17-parameter strategy, the diagnosis is ambiguous: one parameter may be broken, two regimes may be mismatched, or the ensemble weights may be wrong. The ambiguity delays the decommission decision and increases the eventual losses.
The marketing-engineering tradeoff curve
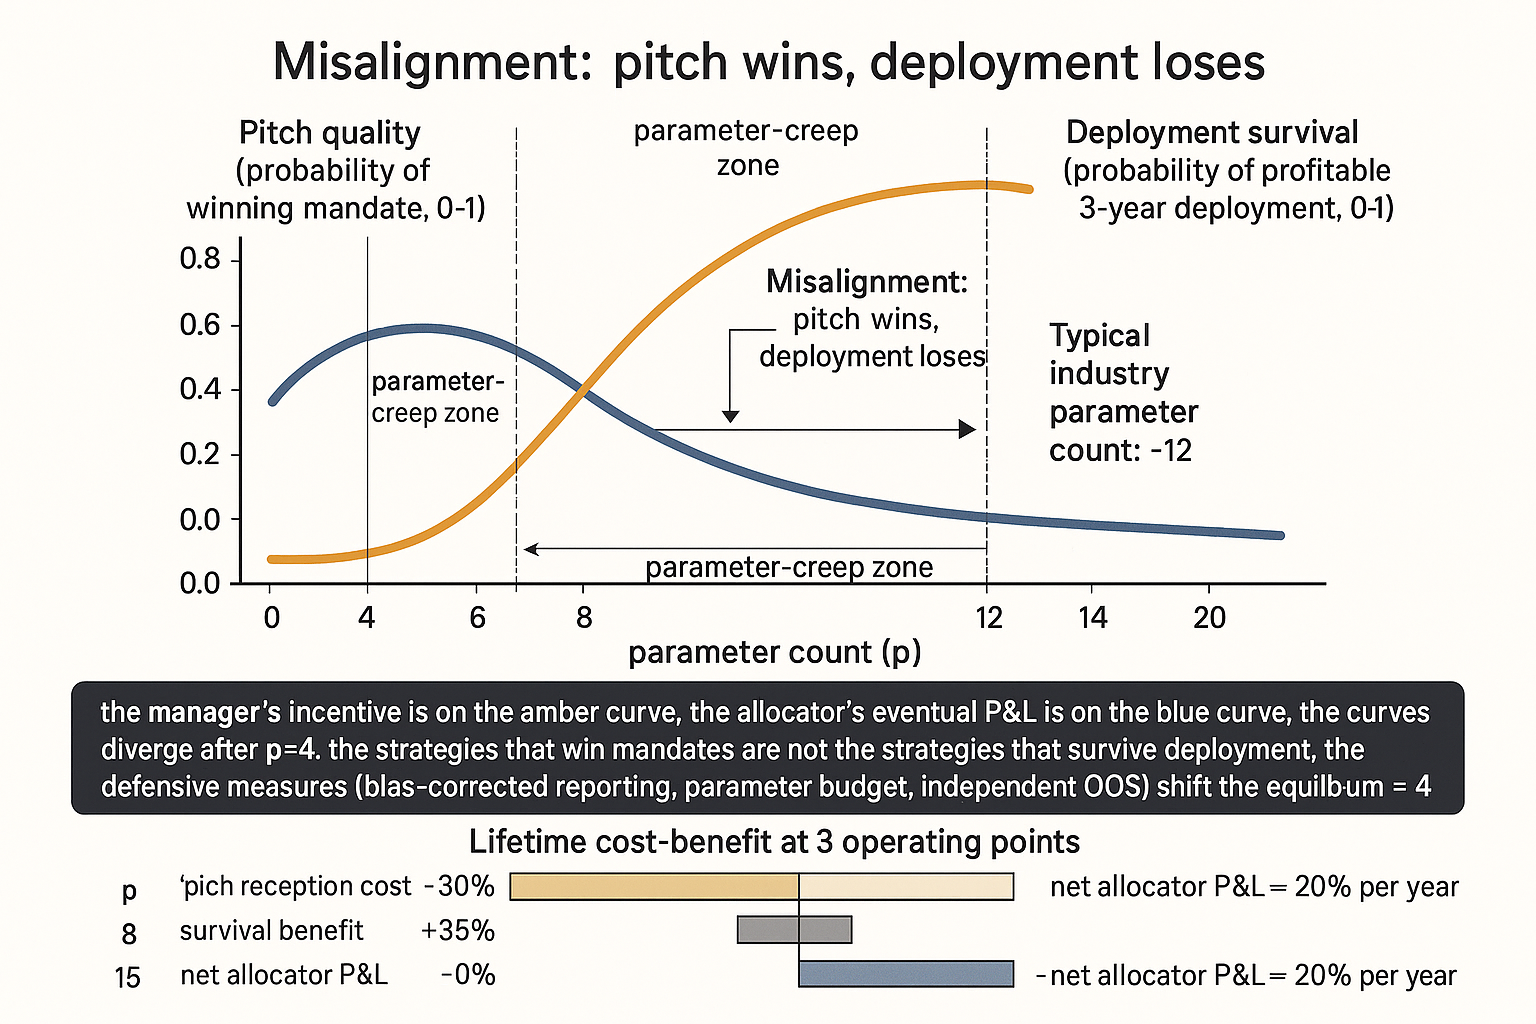
A simple model. The expected pitch quality (probability of winning the mandate) scales monotonically with the raw IS Sharpe. The expected deployment survival scales inversely with k_eff. The optimal parameter count from the manager's perspective (maximize pitch quality) and the optimal parameter count from the allocator's eventual P&L perspective (maximize survival) are different.
$$ \text{PitchQuality}(p) \propto \widehat{\text{SR}}_{\text{IS}}(p) = \text{SR}_{\text{true}}(p) + \sigma_{\text{IS}} \sqrt{2 \log k_{\text{eff}}(p)} $$$$ \text{Survival}(p) \propto \text{SR}_{\text{true}}(p) - \alpha \cdot \log k_{\text{eff}}(p) $$
The pitch-quality curve increases roughly monotonically with parameter count p (more parameters, more search width, higher max-of-noise IS Sharpe). The survival curve has a maximum at a moderate parameter count and decreases beyond it (each parameter past the optimum costs more in regime overfit and operational complexity than it gains in true Sharpe). The asymmetry between the two curves is the structural cause of the misalignment between manager incentives and allocator outcomes.
Legitimate reasons to add a parameter
Three legitimate reasons to add a parameter.
Reason 1: the parameter encodes a structural feature that demonstrably affects the strategy's risk profile. Vol-targeting is a parameter; it encodes the structural feature that volatility is non-stationary. A long-only equity strategy without vol-targeting has different drawdown behavior than one with vol-targeting; the parameter is operationally necessary, not search-width inflation.
Reason 2: the parameter handles a known structural break. A regime indicator that switches between long-trend and short-trend modes captures a structural feature of certain markets (commodity carry decay covered in "Slow Wandering: The Most Dangerous Type of Market Change", FX carry collapse during crisis). The parameter is justified by the structural behavior, not by IS optimization.
Reason 3: the parameter is required by the operational constraints. A position-size cap is a parameter that prevents the strategy from concentrating risk in any single position. The cap is set by risk policy, not by IS optimization, and improves survival regardless of the IS gain.
The discipline. For each parameter, the question is: "does this parameter improve survival, or does it improve the pitch?". If the answer is the latter, the parameter is search-width inflation and should be removed. If the answer is the former, the parameter is justified.
Resisting the parameter-creep pressure
Five operational defenses.
Defense 1: structural prior discipline. Every parameter starts at a structural prior (literature, mechanism, cross-asset analog). The parameter is set, never optimized. The article "Optimization Comes After Testing, Not Before" framed the procedural sequencing.
Defense 2: parameter budget. Set a maximum parameter count before research begins. A common heuristic is the 10% rule (covered in "The 10% Rule of Degrees of Freedom"): the parameter count should be at most 10% of the trade count. A strategy with 100 trades should have at most 10 parameters; with 1000 trades, at most 100.
Defense 3: bias-corrected reporting. Always report k_eff and the bias-corrected IS Sharpe alongside the raw. The bias-corrected number penalizes parameter creep automatically. The team's incentive to add parameters is reduced when each addition shows up as a higher k_eff and a smaller bias-corrected Sharpe.
Defense 4: independent OOS hold-out. Set aside 20-30% of the data as a true OOS slice that is never seen during research. Test the final strategy on the slice once, with no iteration. The slice imposes a hard penalty on parameter creep because each parameter raises the IS-OOS gap and the OOS slice realizes the penalty.
Defense 5: post-decommission attribution. When a strategy is decommissioned, do an attribution: which parameter contributed most to the failure? If the attribution consistently points to the parameters added late in research, the team's research discipline is broken and the parameter budget should be tighter for the next strategy.
Anti-patterns
Five mistakes specific to the parameter-marketing problem.
Anti-pattern 1: adding parameters in response to allocator feedback. The allocator says "what about regime changes?" and the team adds a regime classifier. The parameter exists to satisfy the allocator's question, not because the structural analysis demanded it. The strategy is now more sellable and less robust. The right response to allocator feedback is "the structural prior already handles this through X" or "we considered this and decided not to add a parameter because Y".
Anti-pattern 2: adding parameters in response to OOS underperformance. The strategy underperforms; the team adds a filter to "fix" the underperformance; the new filter validates on the recent data; the next OOS underperforms again. The cycle continues. The article "Why OOS Failure Is Often a Stationarity Failure" framed the diagnostic flow; the parameter-creep response is the wrong action.
Anti-pattern 3: ensemble dressing. The team builds three simple strategies and combines them with optimized weights into an ensemble. The ensemble has more parameters (the weights) and a higher IS Sharpe than any single component. The ensemble looks more sophisticated. The ensemble breaks first because the weights are tuned to the IS-period correlation structure, which does not survive OOS.
Anti-pattern 4: machine-learning veneer. A traditional strategy is wrapped in an ML classifier that adds dozens of free parameters. The pitch claims the ML "learned the signal". The IS Sharpe is high. The OOS Sharpe is low. The ML did not learn the signal; the ML overfit the noise. ML is a legitimate tool when the parameter count is controlled with regularization and the signal-to-noise is high; ML is a parameter-creep accelerant when applied without that discipline.
Anti-pattern 5: confusing complexity with sophistication. A 17-parameter strategy is more complex than a 3-parameter strategy. Complexity is not sophistication. Sophistication is the discipline of removing parameters that do not improve survival. A research team that produces a 3-parameter strategy with positive OOS is more sophisticated than a team that produces a 17-parameter strategy with negative OOS.
Decision matrix
| Parameter count | Typical pitch reception | Typical OOS survival |
|---|---|---|
| 1-3 (structural prior only) | "Too simple, what is the edge?" | High survival, low IS Sharpe |
| 4-7 (well-justified additions) | "Reasonable, want to see more" | Moderate survival, moderate IS Sharpe |
| 8-15 (parameter creep zone) | "Sophisticated, impressive" | Low survival, high IS Sharpe |
| 16+ (complexity for marketing) | "Highly sophisticated team" | Very low survival, very high IS Sharpe |
| With bias-corrected reporting | Pitch reception drops by ~30% | Survival improves by ~50% |
| With parameter budget enforced | Pitch reception drops by ~20% | Survival improves by ~30% |
| With independent OOS hold-out | Pitch reception drops by ~10% | Survival improves by ~70% |
The matrix is the misalignment quantified. Pitch reception and OOS survival move in opposite directions across parameter counts. The defensive measures (bias-corrected reporting, parameter budgets, independent OOS) shift survival without large pitch-reception costs.
Visualizing the asymmetry
KEY POINTS
- More parameters make a strategy easier to sell because (1) the IS Sharpe inflates with sqrt(2 log k_eff), (2) there are more dimensions of robustness narrative for the pitch deck, (3) post-hoc explanations of historical regimes become available, (4) the strategy is defensible under questioning, (5) it differentiates from competitors who all have the same structural priors.
- More parameters make a strategy easier to break because (1) the bias-corrected IS Sharpe drops faster than the raw IS rises, (2) each parameter contributes a regime-mismatch loss when OOS regime drifts, (3) operational reliability scales inversely with parameter count, (4) decommission diagnosis is delayed by the ambiguity of which parameter failed.
- The asymmetry is structural: pitch quality and survival respond differently to parameter count. Adding parameters helps the manager win mandates and hurts the allocator's eventual P&L. The misalignment is the consequence of how the IS objective and OOS performance respond differently to complexity. The "paradox" framing hides the mechanism.
- Three legitimate reasons to add a parameter: encodes a structural feature (vol-targeting handles non-stationary vol), handles a known structural break (regime classifier for documented regime shifts), required by operational constraints (position-size cap from risk policy). For each parameter, ask: does this improve survival or improve the pitch?
- Five operational defenses against parameter creep: structural prior discipline (parameters set, not tuned), parameter budget (10% rule), bias-corrected reporting (k_eff and corrected Sharpe alongside raw), independent OOS hold-out (final test on never-seen slice), post-decommission attribution (which parameter caused the failure).
- Anti-pattern: adding parameters in response to allocator questions. The allocator's question is satisfied by a parameter; the strategy becomes more sellable and less robust.
- Anti-pattern: adding parameters in response to OOS underperformance. The new parameter validates on recent data; the next OOS fails again; the cycle continues.
- Anti-pattern: ensemble dressing. Combining simple strategies with optimized weights raises IS Sharpe by tuning the IS-period correlation structure. The weights do not survive OOS.
- Anti-pattern: machine-learning veneer. ML wrapped around a strategy adds dozens of free parameters. Without explicit regularization and high signal-to-noise, the ML overfits.
- Anti-pattern: confusing complexity with sophistication. Sophistication is the discipline of removing parameters that do not improve survival. The 3-parameter strategy with positive OOS is more sophisticated than the 17-parameter strategy with negative OOS.
- The pitch reception is not the right metric for parameter count. The right metric is bias-corrected IS Sharpe and OOS survival probability. The defensive measures shift the team's incentive toward the right metric without large pitch-reception costs.
- The current article gives the marketing-vs-engineering trade-off. The next article in the publication ("The 10% Rule of Degrees of Freedom") gives the operational threshold for parameter counts relative to trade counts.
References
- Testing and Tuning Market Trading Systems - Timothy Masters (Amazon)
- Data Mining Algorithms in C++ - Timothy Masters (Amazon)
- A Hybrid TLBO–XGBoost Model With Novel Labeling for Bitcoin
- AlphaCrafter: A Full-Stack Multi-Agent Framework for Cross ... - arXiv
- Time-Series Foundation Models in Finance: Pretraining Corpora
- AlphaCrafter: A Full-Stack Multi-Agent Framework for Cross ... - arXiv
- FactorEngine: A Program-level Knowledge-Infused Factor Mining
- Spurious Predictability in Financial Machine Learning - arXiv
- Boosting Models for Nonlinear Alpha in Indian Equity Markets
- Execution Architecture for Fully- Collateralised Binary Prediction