1.2 Why Traders Lose Even When Their Ideas Are Good
Most traders do not lose because their ideas are bad. They lose in the gap between signal and execution. Costs, sizing, psychology, bias, concentration, and strategy decay quietly destroy profitable systems long before the idea itself fails.
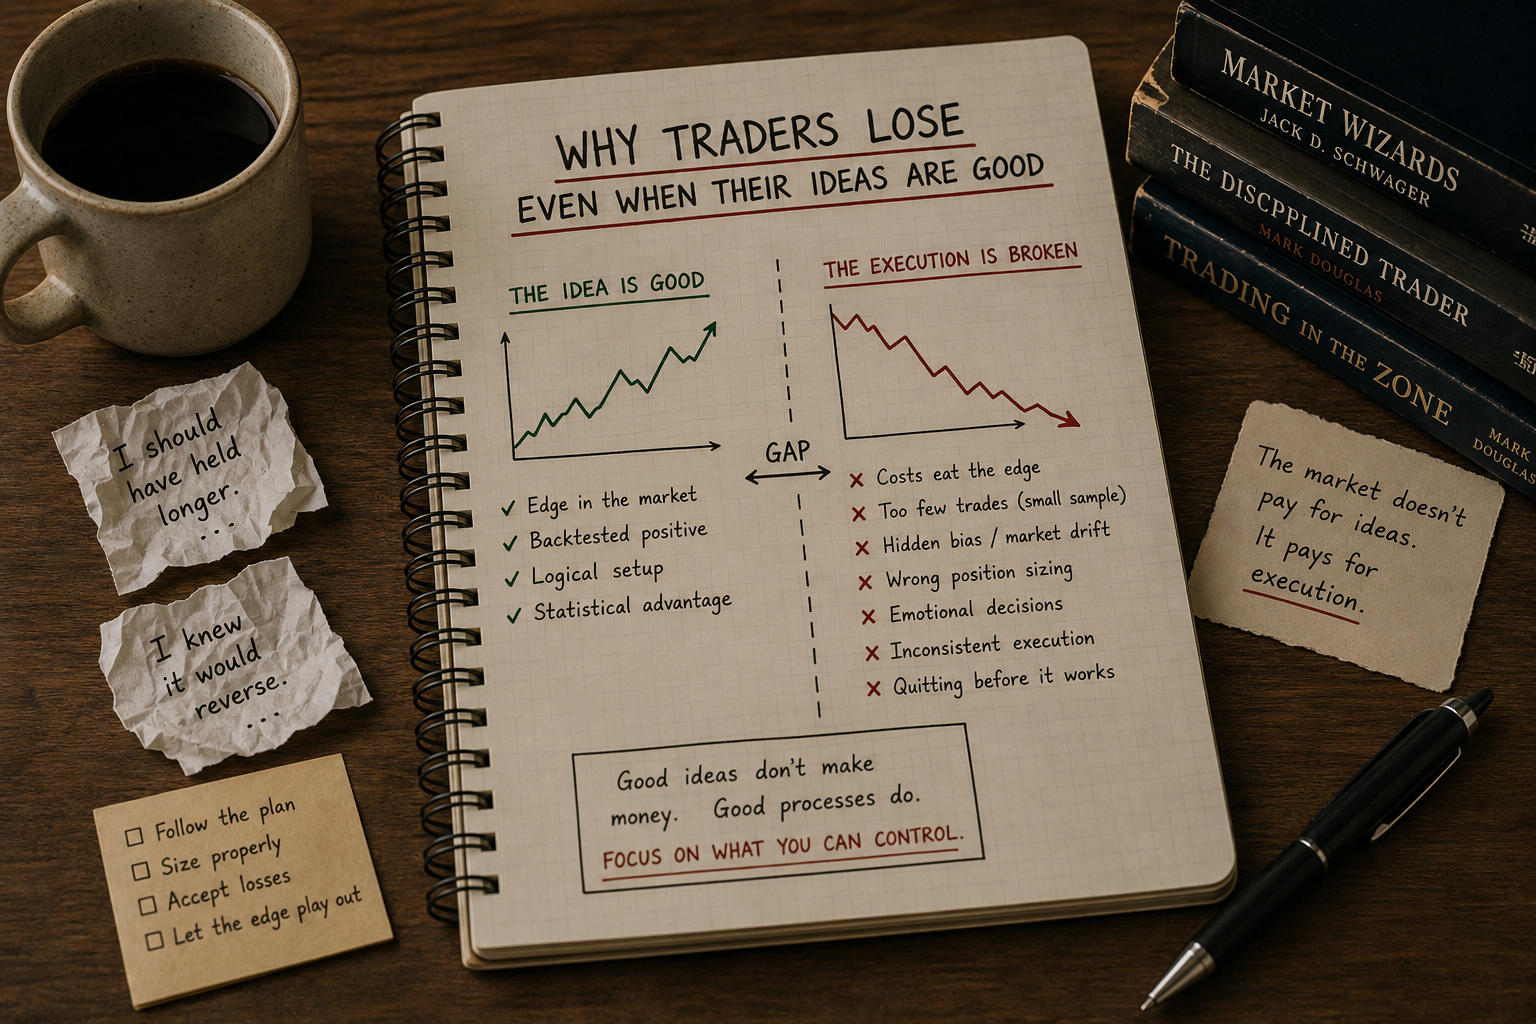
A good idea is the cheap part. The hard part is everything between the idea and the equity curve.
Most retail trading is a sequence of decent intuitions ground into losses by the gap between "this should work" and "this did work." You can have a rule with statistical edge and still bleed for years. The signal-to-P&L path runs through seven execution layers, and each one is a tax. The cumulative tax is enough to take a Sharpe-1 system and deliver Sharpe-zero results to your broker.
The cost gap: your signal is smaller than your spread
Run a moving-average crossover on GBPUSD 30-minute bars without an exit. Long when the fast crosses the slow, flip on the opposite cross. Five years of data. Long side: average winning trade $206, average losing trade $35, percentage of profitable trades 36%. Net positive. Average trade is $35.
Subtract $30 per round-trip for commission, slippage, and spread. Average trade collapses to $5. One bad month and the system is in the red on a per-trade basis. The math was right. The idea was right. The execution layer was too expensive for the signal.
This is the normal state of retail strategies. Edge per trade is small, often $5 to $40 on retail position sizes. Costs are not small. A 1-pip spread on a 30-minute breakout system targeting 8 pips eats 12.5% of gross profit per trade. A 0.5% commission on a daily mean-reversion system targeting 1% moves eats half. Backtests that omit costs are not backtests. They are price-action poetry.
Strip costs before you fall in love with an equity curve. If the average trade after costs is below 1.5x your worst-case slippage assumption, the system is not tradeable, no matter what the Sharpe looks like.
The sample gap: 30 trades is noise
A new trader runs a backtest, sees 30 trades, sees a 65% win rate, ships it. The 95% confidence band on a 65% win rate from 30 trades runs from around 47% to 80%. The true win rate could be anywhere from barely profitable to exceptional. You do not know which.
The rough rule for trade count is that the standard error in trading metrics scales with $\sqrt{n+1}$. At 100 trades the error band is around 10%. At 1,000 trades it is around 3%. Below 100 trades the system metrics are uninformed. You are looking at a random sample of an unknown distribution and pretending it is a parameter estimate.
Two corollaries follow.
The first is that strategies producing few trades require a lot more history. A breakout system on daily bars that fires 20 times a year needs five years of data to reach 100 trades. Anything less is a story dressed up as evidence.
The second is that the cleanest-looking equity curves often come from the smallest samples. A 15-trade strategy with no losers has an undefined error band, which is the same as no information. You see a straight line, you assume signal. There is no signal you can measure.
The bias gap: half your "edge" is drift
Anything long-biased on US equities since 1976 looks good. The SPX returned 4.22% annualized from 1976 to 2004 with no help from you. A rule long 60% of the time captures 2.5% of that drift before producing a single forecast. A rule long 90% of the time captures 3.8%. Half your edge is the long-only ETF you could have bought without a strategy.
The fix is to build a benchmark with the same long/short bias as your rule but no signal. Random entries with matched holding period and matched bias. Subtract that return from your rule's return. What remains is the predictive power. Most retail strategies that survive cost-stripping fail this second filter. The rule had no edge to begin with. The trader was being paid by the market, not by the rule.
Traders who confuse drift for edge do two destructive things. They run the rule on the short side and watch it die. They run the rule on a different market with different drift and watch it die. The edge was never portable. It was a long-only ETF in a fake nose.
The sizing gap: same signal, different account
Two traders run the same system. Same entry, same exit, same instrument, same data. Trader A risks 0.5% per trade. Trader B risks 4% per trade.
Over 200 trades with a 55% win rate and a 1.2 reward/risk ratio, Trader A finishes the year up around 20% with a max drawdown around 8%. Trader B finishes the year up around 60% with a max drawdown around 35%. Trader B then hits a normal six-trade losing streak, the equity curve becomes unbearable, and the account closes the system for emotional reasons before the rules ever fire an exit.
Position size is not a knob you tune for return. It is the parameter that decides whether you survive the system's natural drawdown distribution. Doubling risk-per-trade doubles drawdown. Doubling risk-per-trade also doubles return, until leverage costs and slippage non-linearities kick in. The asymmetry favors smaller size for most retail traders.
Two heuristics. Cap risk-per-trade so that the worst historical drawdown leaves your account above 70% of starting equity. Run a Monte Carlo of trade reorderings on your backtest and look at the 95th-percentile drawdown across permutations, not just the realized one. The realized drawdown is one path. There were thousands of equally likely paths, and some of them ended your account.
The brain gap: you are not the trader in the backtest
The backtest assumes a trader who takes every signal, sizes every trade the same way, holds to the exit, and does not skip when the chart "looks ugly." That trader does not exist in your seat.
The errors are predictable. You skip the trade that came after three losers because your gut said "this run is bad." That skipped trade was the 35% winner that paid for the streak. You override a stop because price "almost turned" your way. The override turns a 1R loss into a 4R loss. You take profit early because the chart "looks toppy." You give up the right-tail trades that carry the year. You revenge-trade after a loss with double size. You undo six months of risk management in a single afternoon.
The signature of these errors is asymmetric. You add to losers, cut winners. The expected live equity curve diverges from the backtest in the direction your discretion injects. Run your own live trade log against the mechanical version of the same rules. The mechanical version wins. The gap is the bill for being human.
The stable fix is removing the discretionary surface. Pre-compute today's signals and batch the orders before the open. Walk away from the screen. If you cannot watch without intervening, do not watch.
The portfolio gap: one good idea is not a business
A single good system is a single point of failure. Volatility regimes change. Spread structure changes. The instrument's personality changes. The rule that worked on GBPUSD 2010-2015 stops working in 2017 because intraday volatility collapses. You did not do anything wrong. The kitchen ran out of duck fat.
A portfolio of five uncorrelated rule families, each running at one-fifth size, produces lower realized volatility, lower drawdown, and a higher Sharpe than any individual rule run at full size. Diversification across rule families is the only free lunch the market still serves. Most retail traders refuse it because running five mediocre-looking systems feels worse than running one good-looking system, even when the portfolio Sharpe is double the individual one.
The non-obvious result is that the average correlation between different rules trading the same instrument tends to be higher than the average correlation between the same rule trading different instruments. Diversification across instruments is cheaper and more reliable than diversification across rule variants on one instrument. Spread the recipe across kitchens, not across knives in the same kitchen.
The decay gap: every idea ages
Costs accounted for. Sample size respected. Bias stripped. Sizing calibrated. Brain removed from the loop. Portfolio diversified. The idea will still age. The market structure that produced the edge changes. New participants arrive, old participants leave, the spread tightens, the volatility regime shifts.
200 live trades and meaningful statistical evidence often arrive when the rule is 60% of the way through its useful life. By the time you trust the system, the system is preparing to die.
The defense is process. Set a kill criterion before going live. Drawdown beyond 1.5x the worst historical. Average trade collapsing below cost threshold. Three consecutive months of negative expectancy. When any criterion fires, the system goes off, no matter how loyal you feel to it. Then back to research and the next one. The pipeline matters more than any single rule.
The actual cause of most losses
Map the standard retail loss path and the story is not bad ideas. The story is decent ideas killed by cost, sample, bias, sizing, discretion, concentration, and decay, in that order. Each tax compounds the previous. A 1.0 Sharpe rule loses 0.2 to costs, another 0.2 to sample uncertainty becoming live sizing errors, another 0.3 to discretionary execution, another 0.2 to concentration risk. By the time the rule is on a live account, the realized Sharpe is negative. The trader concludes that "trading doesn't work" or that they need a better signal. The bleed happens between signal and P&L. The signal was never the bottleneck.
A good idea is the entry ticket. Execution is the show.
KEY POINTS
- Edge per trade in retail systems is small. Costs are not. Strip transaction cost, spread, and slippage before evaluating any equity curve.
- 30 trades is noise. Standard error scales as $\sqrt{n+1}$. You need 100+ trades for the metrics to mean anything.
- Long-biased rules in long-biased markets look profitable for free. Build a bias-matched random benchmark and subtract its return before claiming edge.
- Position size determines survival, not return. Cap risk so the worst historical drawdown leaves you above 70% of starting equity.
- The trader in your seat is not the trader in the backtest. Discretionary overrides break the expected distribution in predictable ways.
- One system is a single point of failure. Five uncorrelated systems at one-fifth size beat any single system at full size.
- Every working idea decays. Write a kill criterion before going live and keep the research pipeline running.
- The signal is rarely the bottleneck. The seven execution layers between signal and P&L are where most retail losses are manufactured.
References
- Evidence-Based Technical Analysis - David Aronson (Amazon)
- Systematic Trading - Robert Carver (Amazon)
- Evidence-Based Technical Analysis: Applying the Scientific Method and Statistical Inference to Trading Signals
- Evaluating Trading Strategies
- Systematic Testing of Systematic Trading Strategies
- Estimation Risk, Market Efficiency, and the Predictability of Returns
- Comparing Discretionary and Systematic Hedge Fund Performance
- Traditional Traders vs. Quant Traders: A Comparative Analysis of Discretionary and Quantitative Trading Approaches in Modern Financial Markets
- The Specification and Power of the Sign Test in Event Study Hypothesis Tests Using Daily Stock Returns
- Applications of the Chi-Square Distribution in Quantitative Finance