3.13 Why "Works on All Markets" Is Usually a Red Flag
"Works on all markets" usually hides per-market tuning, cherry-picking, or long-bias. Real edges are family-specific. Demand the full matrix: fixed parameters, after costs, multi-test corrected.

A strategy is pitched in a published research paper. The headline claim: "the system delivers Sharpe ratios above 1.2 across 38 markets including SPX, NDX, RTY, NIKKEI, EUR-STOXX, EURUSD, GBPUSD, USDJPY, gold, copper, crude oil, natural gas, soybeans, corn, wheat, BTC, ETH, US 10-year Treasuries, German Bunds, and others." The reader's first instinct, which the article's tone is designed to encourage, is admiration: "wow, a strategy that works everywhere must capture something universal, like trend or mean reversion or risk premium." The reader's better instinct, which experienced researchers have learned the hard way, is skepticism: a strategy that delivers Sharpe 1.2 on natural gas (one of the most volatile, cost-heavy, regime-shifting markets) and on US 10-year Treasuries (one of the most heavily intermediated, central-bank-dominated markets) is doing something fishy in either the backtest, the optimization, or the framing.
Markets are not interchangeable. SPX has a strong long-run drift, low overnight gaps, deep order books, and tight bid-ask spreads. Natural gas has no long-run drift, large overnight gaps, thin order books, and wide spreads with seasonal storage-driven structural shifts. EURUSD has a near-zero unconditional drift, deep liquidity, microstructure dominated by central-bank flows. BTC has high vol, fragmented liquidity, regime breaks driven by retail flows and exchange events. A strategy that "works" on all of these probably has been tuned per-market with different parameters, evaluated with different cost assumptions, or filtered to the regimes where each market happens to comply with the strategy's premise. The article "The Difference Between Robustness and Optimization" framed cross-market robustness as one tool among several. This article gives the contrarian view: cross-market claims, taken at face value, are more often a sign of overfitting or misframing than a sign of a universal edge.
"Works on all markets", in practice
Five common reframings of the universal claim, each less impressive than the headline.
Reframing 1: works on all markets after per-market optimization. The strategy template (e.g., "buy when 14-day RSI is below 30, exit at 50") is applied to 38 markets, but the entry threshold, exit threshold, lookback period, vol target, and stop-loss are optimized separately for each market. The "universal" claim hides 38 separate optimizations, each with its own degrees of freedom and its own search-width bias. The article "Why More Parameters Make a Strategy Easier to Sell and Easier to Break" frames the per-strategy degrees-of-freedom problem; multiplied by 38 it becomes a much larger problem.
Reframing 2: works on the markets in our cherry-picked sample. The 38 markets reported are the ones where the strategy worked. The other markets where the strategy failed (probably 60 to 100 of them) were dropped from the report. The selection bias inflates the apparent universality.
Reframing 3: works after applying market-specific filters. The natural-gas instance excludes summer storage seasons. The Treasury instance excludes Fed announcement days. The SPX instance excludes the first and last 30 minutes. Each filter is reasonable in isolation; cumulatively they encode a substantial market-specific specification that contradicts the "universal" framing.
Reframing 4: works at universal-direction-bias scale. The strategy is approximately long-biased and earns the market-wide long-run drift on most equity-class markets. The "universal" Sharpe is the universal long-bias premium plus residual noise. Strip out the long-bias contribution and the strategy has near-zero Sharpe on its own merits. This is the most common pattern in academic equity-strategy papers.
Reframing 5: works after silencing the worst markets through "outlier filtering". Two or three markets in the universe produce extreme losses (e.g., natural gas during the 2021 Texas freeze, BTC during the 2022 LUNA collapse). The headline number is computed after Winsorizing or removing these "outlier" events. The Winsorization is presented as a methodology choice; in practice it removes precisely the events that would have killed the strategy's claim of universal applicability.
Real edges are market-specific
Three structural reasons.
Reason 1: each market has its own microstructure. Tick size, bid-ask spread, exchange fee structure, liquidity profile, market-maker concentration, dark pool fraction. A microstructure-sensitive strategy (mean reversion at intraday horizons, market making, latency arbitrage) earns different gross returns on different microstructures and pays different transaction costs. A strategy that is parameter-tuned to SPX's microstructure does not naively transfer to BTC's microstructure.
Reason 2: each market has its own participant mix. SPX is dominated by institutional flow, retail through ETFs, and HFT. Natural-gas futures are dominated by physical hedgers and producers. Gold has central-bank reserves, jewelry demand, and macro-hedge flows. EURUSD has trade flows, central-bank flows, and macro speculation. The participant mix determines what kinds of patterns are economically sustainable. Trend follows persist on FX because central banks intervene slowly. Mean reversion persists on equities because rebalancing flows. Carry persists on bonds because pension-funding constraints. The same strategy framework picks up different subsets of these patterns on different markets.
Reason 3: each market has its own macro driver. Equities respond to growth and earnings. FX responds to interest-rate differentials and balance-of-payments. Bonds respond to inflation and central-bank policy. Commodities respond to supply, weather, and storage. The strategies that exploit one macro driver do not automatically exploit the others. A strategy "premised on supply-demand-imbalance trends" works on physical commodities and is misapplied on financial assets.
The exception. A genuine universal pattern occasionally exists: long-only buy-and-hold of a broad equity index harvests the equity risk premium on every developed-market equity universe. The trend-following premium harvested by CTAs has been positive across most futures markets across decades. Both exceptions are documented, replicated, and have low Sharpes (0.4 to 0.7) that are consistent with their structural origin. A "universal" strategy that claims Sharpe 1.5+ across 38 markets makes a different and much stronger claim than a refinement of the equity-premium or trend-following premium, one that does not survive the standard skepticism.
The cross-market test, done correctly
The right cross-market protocol corrects for the failure modes above.
Step 1: select a market family with a clear common structural premise. Equity indices with similar microstructure (SPX, NDX, RTY) are one family. G10 FX crosses are another. Liquid commodity futures are a third. Crypto majors are a fourth. The within-family test is informative because the structural premise is similar; the across-family test is mostly a red flag for over-claiming.
Step 2: use the same parameter values across markets in the family. No per-market optimization. The parameter values come from a structural prior, the article "The Difference Between Robustness and Optimization" gave the selection rule. If the strategy needs different parameters for SPX and NDX, it is tuned to SPX-specific noise rather than to a universal SPX-NDX-RTY pattern.
Step 3: apply realistic per-market transaction costs. SPX costs and BTC costs differ by an order of magnitude. The same strategy template that delivers Sharpe 1.0 on SPX after costs may deliver Sharpe 0.2 on BTC after costs, even with the same gross signal strength. Report after-cost results per market.
Step 4: report the full matrix, not the headline aggregate. For each market in the family, report Sharpe, max drawdown, profit factor, and number of trades. The strategy is deployment-ready on a market when its row in the matrix is positive; it is not ready on a market where its row is near-zero or negative, regardless of the aggregate.
Step 5: account for the cross-market correlation. The portfolio Sharpe of 38 strategies (one per market) is approximately sqrt(N_effective) times the average per-market Sharpe, where N_effective accounts for correlations between markets. The naive average overstates the result. SPX and NDX have rho approximately 0.95 so they count as approximately one independent strategy, not two. The naive aggregation overstates the diversification benefit.
The math of the multiple-comparison problem
A simple model. Suppose the researcher tests the strategy on K markets and reports the markets where the IS Sharpe exceeds threshold T. Under the null hypothesis (the strategy has zero true edge on any market), the probability that at least m of the K reported Sharpes exceed T by chance scales with K and with the per-market false-positive rate.
$$ \Pr(\text{at least } m \text{ false positives}) = 1 - \sum_{j=0}^{m-1} \binom{K}{j} p^j (1 - p)^{K - j} $$
For K = 100 markets tested and per-market false-positive rate p = 0.05 (the conventional 5% level), the probability of finding at least 5 false positives is approximately 56%. The probability of finding at least 10 is approximately 1.5%. Reporting "the strategy works on 10 markets at p < 0.05" without correction for the 100-market search is misleading; the correct framing is "we cannot reject the null after multiple-comparison correction".
The correction. Apply Bonferroni or Benjamini-Hochberg to the per-market p-values. Bonferroni is conservative (multiply each p-value by K). Benjamini-Hochberg is less conservative (controls the false-discovery rate). Either is correct; reporting raw per-market p-values without any correction is not.
Anti-patterns
Five mistakes that show up in cross-market claims.
Anti-pattern 1: "the strategy is robust because it works on 38 markets". Robust means insensitive to perturbation. Cross-market is one perturbation axis, but with per-market optimization the apparent robustness is an illusion. Run the constrained-parameters version of the cross-market test, not the per-market-optimized version.
Anti-pattern 2: averaging Sharpes across uncorrelated and correlated markets equally. The portfolio Sharpe scales with sqrt(N_effective), not sqrt(N). Equity indices in the same region carry pairwise correlations above 0.8 and contribute almost no diversification. The naive average inflates the apparent benefit.
Anti-pattern 3: reporting only the markets where the strategy works. Cross-market validation requires reporting the full matrix including the markets where the strategy fails. A strategy that works on 10 of 38 markets is informative; a strategy reported on 10 markets without the other 28 is selection bias.
Anti-pattern 4: applying the strategy to markets where the structural premise does not hold. A momentum strategy applied to mean-reverting commodity-spread markets is misapplied; the negative results on the misapplied markets are diagnostic rather than universal failure. The right cross-market test is within a market family with a shared structural premise.
Anti-pattern 5: claiming universality as a virtue. The claim "this strategy works on all markets" carries less operational weight than "this strategy works on the markets where the underlying mechanism applies and fails elsewhere". The second form is falsifiable and more useful. The former is a marketing claim that real researchers should be suspicious of.
Cases where the universal claim holds
Three signs that distinguish an honest cross-market claim from an overfit one.
Sign 1: the parameters are identical across markets and structurally motivated. The 12-1 momentum factor uses the same 12-1 horizon on every market because the horizon is set by the academic literature's structural prior, not by per-market tuning. The aggregate Sharpe of approximately 0.4 to 0.7 is consistent across decades.
Sign 2: the strategy is reported with after-cost numbers per market and the worst markets are positive but small, not negative. A strategy that earns Sharpe 0.3 on the slowest market and Sharpe 0.7 on the fastest market is structurally consistent. A strategy that earns Sharpe 1.5 on every market is suspicious.
Sign 3: the failure modes are documented per market. The honest paper says "the strategy struggles on natural gas during the storage-season transition months" or "the strategy underperforms on FX during high-vol risk-off regimes". The dishonest paper says "the strategy works everywhere". Honest cross-market reporting includes the per-market failure modes; dishonest cross-market reporting suppresses them.
Decision matrix
| Cross-market claim | Likely interpretation | Action |
|---|---|---|
| Same parameters, full matrix, after costs, Sharpes 0.3-0.7 | Honest, structurally consistent | Validate within market family |
| Per-market optimized, Sharpes 1.0+ across 30+ markets | Per-market overfitting, multiple-comparison-uncorrected | Reject claim |
| Headline aggregate without per-market matrix | Selection bias likely | Demand the full matrix |
| Universal claim that crosses asset families (equity to bonds to crypto) | Different mechanisms | Reject the universality framing |
| Sharpes high on backtest, low or negative on the largest hostile event days | Outlier suppression | Demand event-level transparency |
| Failure modes documented per market | Honest reporting | Treat as informative robustness signal |
| No documented failure modes | Suspicious | Investigate or reject |
| Cross-market Sharpe matches sqrt(N_effective) scaling, not sqrt(N) | Honest diversification accounting | Treat as informative |
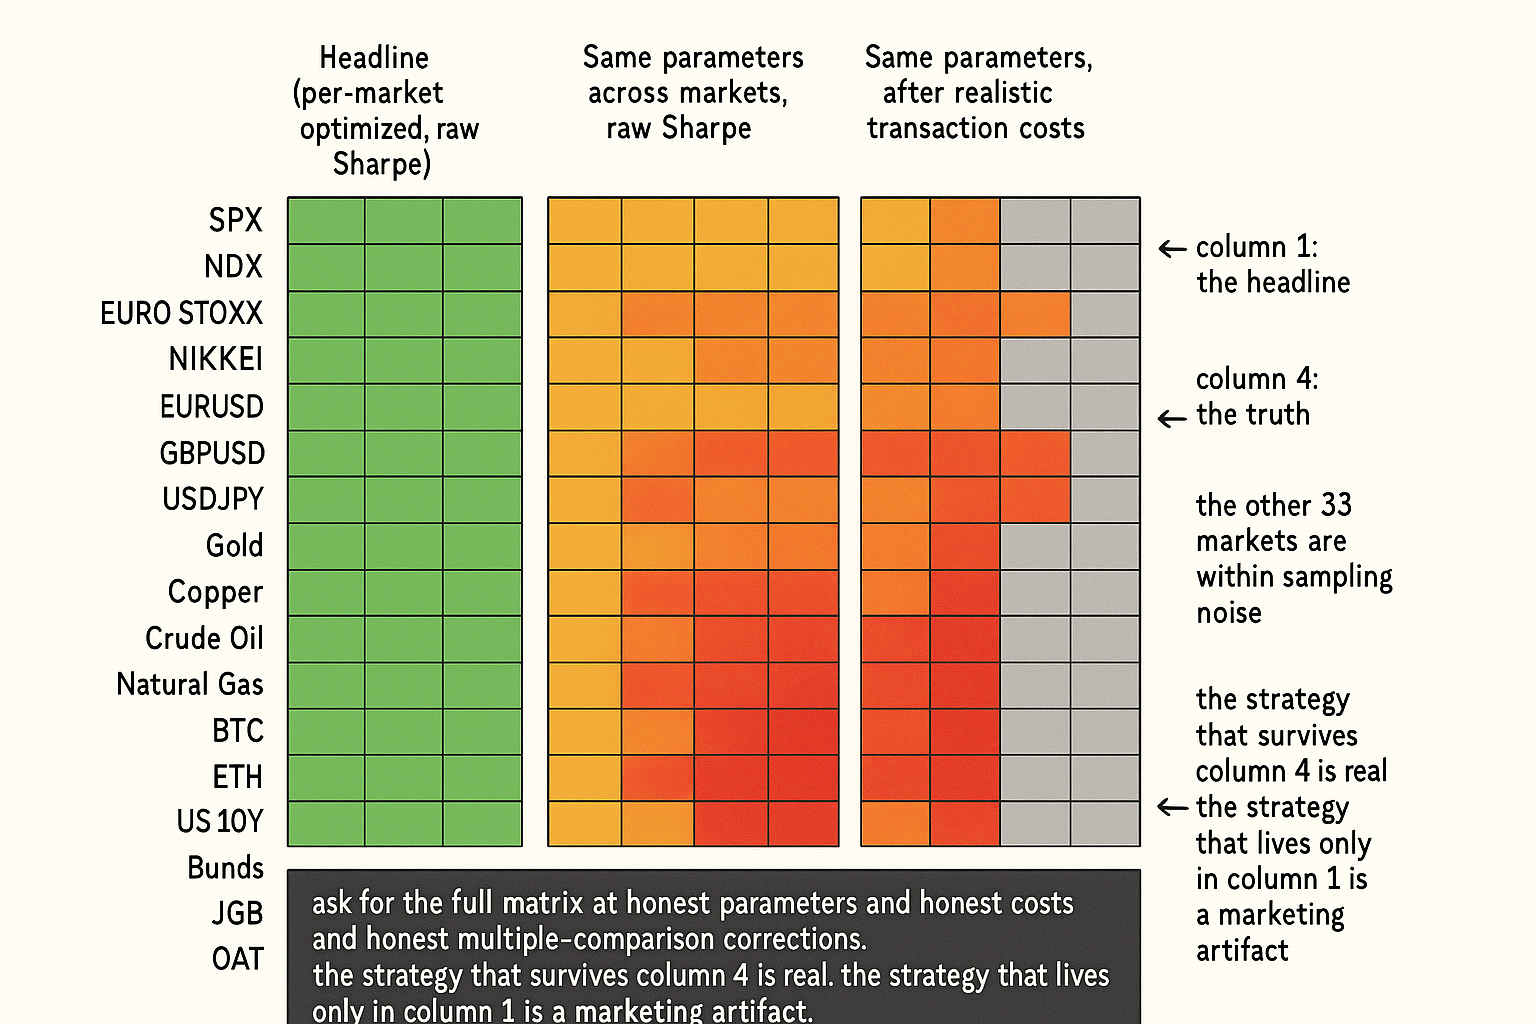
The matrix is operational. The pattern: ask for the full per-market matrix, the same parameters, after-cost numbers, and per-market failure-mode documentation. A claim that survives all four asks is informative. A claim that fails one or more is a red flag that the universality is at least partly methodology-driven.
Visualizing the cross-market claim
KEY POINTS
- A strategy that claims to work on every market in a heterogeneous universe (equity indices, FX, commodities, bonds, crypto) is more often a sign of methodology issues than a sign of a universal edge. Markets have different microstructures, participant mixes, and macro drivers; a single strategy framework rarely captures all of them.
- Five common reframings hide behind the universal claim: per-market parameter optimization, cherry-picked sample of markets where the strategy worked, market-specific filters that contradict the universality framing, exposure to a universal long-bias rather than a strategy-specific signal, outlier suppression that removes the worst events.
- Three structural reasons genuine edges are usually market-specific: each market has its own microstructure (tick size, spreads, fee structure, liquidity), each market has its own participant mix (institutional, retail, HFT, hedgers), each market has its own macro driver (growth, rates, supply-demand, central-bank flows).
- Two genuine universal patterns exist and have known low Sharpes: equity-premium long-only buy-and-hold (Sharpe approximately 0.4 to 0.5 across markets), trend-following premium across futures (Sharpe approximately 0.5 to 0.7 across decades). A claim of higher universal Sharpe is a different and much stronger claim that requires extraordinary evidence.
- The right cross-market protocol: select a market family with a shared structural premise, use the same parameter values across the family, apply realistic per-market transaction costs, report the full matrix not the aggregate, account for cross-market correlation when computing portfolio Sharpe.
- Multiple-comparison correction is mandatory. Testing 100 markets with per-market false-positive rate 0.05 produces an expected 5 spurious significant results under the null. Bonferroni or Benjamini-Hochberg correction is the operational fix.
- Three signs of an honest cross-market claim: identical structurally-motivated parameters across markets, after-cost numbers per market with the worst markets positive but small not negative, documented failure modes per market.
- Anti-pattern: treating "works on 38 markets" as proof of robustness without examining the parameter consistency, the multiple-comparison correction, or the per-market matrix.
- Anti-pattern: averaging Sharpes across correlated markets equally. The portfolio Sharpe scales with sqrt(N_effective), and N_effective is much smaller than N when the markets are correlated.
- Anti-pattern: reporting only the markets where the strategy works. The cross-market test requires the full matrix including failures.
- The current article gives the skeptical view of cross-market claims. The next article in the publication ("Market Personality: Why Gold, FX, Crypto, and Equities Need Different Systems") covers the constructive version: what each market class requires from a strategy framework.
References
- Testing and Tuning Market Trading Systems - Timothy Masters (Amazon)
- Data Mining Algorithms in C++ - Timothy Masters (Amazon)
- Boosting Models for Nonlinear Alpha in Indian Equity Markets
- (PDF) A novel approach to trading strategy parameter optimization
- Optimal Linear Signal: An Unsupervised Machine Learning ... - arXiv
- FactorEngine: A Program-level Knowledge-Infused Factor Mining
- 1 Introduction - arXiv
- (Non-Parametric) Bootstrap Robust Optimization for Portfolios and
- A Hybrid TLBO–XGBoost Model With Novel Labeling for Bitcoin
- The GT-Score: A Robust Objective Function for Reducing Overfitting
- Backtesting Strategies Based on Multiple Signals
- Backtest Overfitting in the Machine Learning Era
- Walk Forward Correlation: A Diagnostic for Over-Fitting and Structural Edge
- Backtest overfitting in the machine learning era: A comparison of out-of-sample validation techniques in finance
- Investment Model Validation
- A Novel Approach to Trading Strategy Parameter Optimization Using Walk-Forward Optimization Window Parameterization
- A Bootstrap Equality Test for Value at Risk and Expected Shortfall
A note on AI. The ideas, research, analysis, and conclusions in this article are my own. I use AI tools to help with editing and wordsmithing, because English is not my first language, and I am not shy about that. AI-generated ideas and AI-assisted writing are not the same thing: the first is empty slop from a generic prompt, the second is a tool for communicating years of real research more clearly. Judge the work by its substance, not by whether software helped polish the prose.