3.19 Trade-Count Thresholds for Backtest Reliability
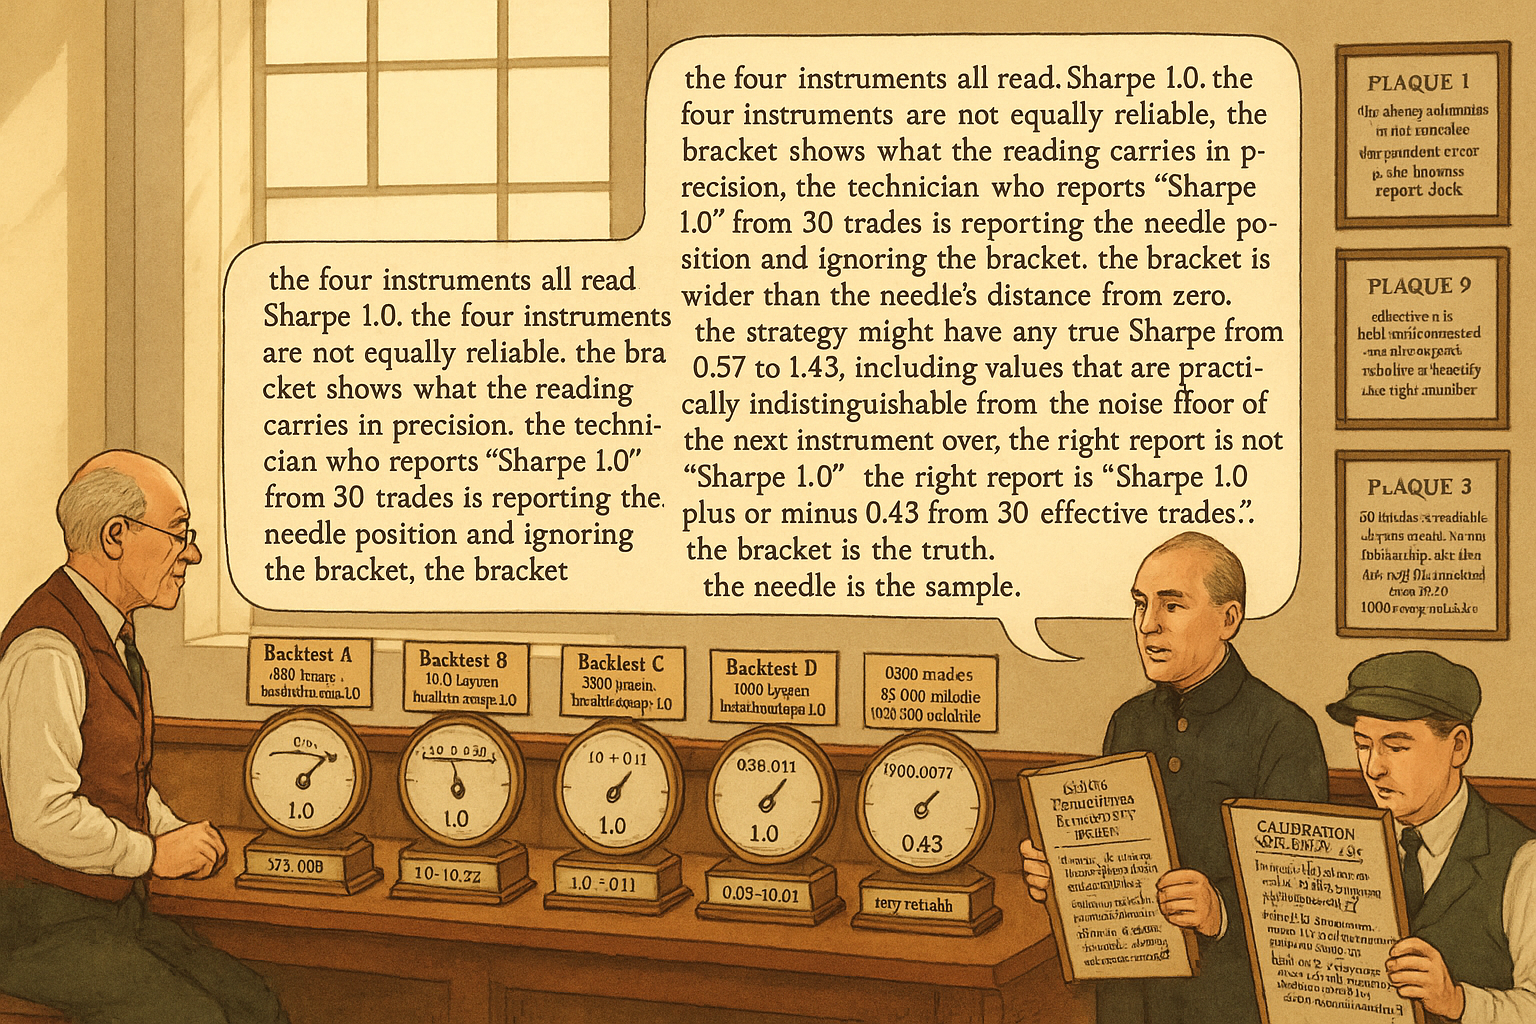
The standard error of a Sharpe estimate is roughly 1/sqrt(N). At SR=1.0, 100 trades give CI +/-0.24, 500 give +/-0.11. Effective N corrects for hold-time, cross-section, gating. Report the bracket.
A trader presents a backtest. The strategy traded 240 times over five years on a single instrument with average per-trade P&L of 0.4 R-multiples and standard deviation of 1.6 R-multiples. The annualized Sharpe is approximately 0.96. The trader's pitch claims the Sharpe is "above 0.95, statistically significant, and reliable for deployment". The question that should follow but rarely does: how reliable is a Sharpe estimate from 240 trades?
The answer is quantitative. The standard error of an annualized Sharpe estimate from N independent trades is approximately sqrt((1 + 0.5 SR^2) / N) for the unconditional case, or roughly 1/sqrt(N) for small Sharpes. For SR = 0.96 and N = 240, the standard error is approximately 0.07, and the 95% confidence interval is approximately [0.82, 1.10]. The true Sharpe could be anywhere in this band. If the true Sharpe is 0.5 (the realistic value for many "edge-y" strategies after mean reversion to the population), the OOS realization is plausibly within the band the IS estimate is consistent with, but the OOS would be 0.5 not 0.96. The IS Sharpe of 0.96 carries a confidence band: "0.96 plus or minus 0.14, with a likely overestimate from search-width bias on top".
The article "Degrees of Freedom in Trading Systems" framed the search-width bias. The article "The 10% Rule of Degrees of Freedom" gave the relative ratio between parameters and trades. This article gives the absolute trade-count requirements: for a given Sharpe and a given confidence threshold, how many trades does the strategy need to produce a reliable estimate. The answer is calibrated by the standard error of the Sharpe and the desired statistical power. The article "Why 30 Trades Is Not a Strategy" later in this pillar covers the specific (and very common) misuse of the 30-trade central-limit-theorem threshold; the present article gives the general framework.
The standard error of a Sharpe estimate
For an unbiased Sharpe estimate from N independent observations of per-period returns with mean mu and standard deviation sigma, the standard error of the Sharpe (in the same time units as the observations) is approximately:
$$ \text{SE}(\widehat{\text{SR}}) \approx \sqrt{\frac{1 + \tfrac{1}{2} \text{SR}^2}{N}} $$
For small Sharpes (SR < 1), the formula simplifies to approximately 1/sqrt(N). For SR = 0.5 and N = 100, SE approximately 0.10, 95% confidence interval approximately [0.30, 0.70]. For SR = 1.0 and N = 100, SE approximately 0.12, CI approximately [0.76, 1.24]. The CI is wide unless N is large.
For the annualized Sharpe (where the per-period observations are typically daily or weekly), the formula adjusts for the annualization factor. If T is the number of trading periods per year (252 for daily, 52 for weekly, 12 for monthly), the annualized Sharpe is the per-period Sharpe times sqrt(T), and the standard error scales similarly. For a strategy with 250 trading days per year of returns:
$$ \text{SE}(\widehat{\text{SR}}_{\text{ann}}) \approx \sqrt{\frac{1 + \tfrac{1}{2} \text{SR}_{\text{ann}}^2 / T}{N_{\text{years}} \cdot T}} \cdot \sqrt{T} $$
The result. For an annualized Sharpe of 1.0 from one year of daily data (N approximately 250), SE approximately 0.45. The 95% CI is approximately [0.10, 1.90]. One year of data is uninformative about the true Sharpe. For three years of data, SE approximately 0.27, CI approximately [0.46, 1.54]. For ten years of data, SE approximately 0.14, CI approximately [0.72, 1.28]. The trade-count requirement is large.
Sample-size targets by Sharpe and confidence
Operational targets calibrated against published practice and observed deployment outcomes.
For a strategy with true Sharpe approximately 0.5 (a typical structural premium):
| N trades | SE(SR) | 95% CI | OOS reliability |
|---|---|---|---|
| 30 | 0.18 | [0.14, 0.86] | unreliable |
| 100 | 0.10 | [0.30, 0.70] | weakly reliable |
| 250 | 0.064 | [0.37, 0.63] | moderately reliable |
| 500 | 0.045 | [0.41, 0.59] | reliable |
| 1000 | 0.032 | [0.44, 0.56] | very reliable |
For a strategy with true Sharpe approximately 1.0 (a strong edge):
| N trades | SE(SR) | 95% CI | OOS reliability |
|---|---|---|---|
| 30 | 0.22 | [0.57, 1.43] | unreliable |
| 100 | 0.12 | [0.76, 1.24] | weakly reliable |
| 250 | 0.077 | [0.85, 1.15] | moderately reliable |
| 500 | 0.055 | [0.89, 1.11] | reliable |
| 1000 | 0.039 | [0.92, 1.08] | very reliable |
For a strategy with true Sharpe approximately 2.0 (an exceptional edge):
| N trades | SE(SR) | 95% CI | OOS reliability |
|---|---|---|---|
| 30 | 0.32 | [1.37, 2.63] | unreliable |
| 100 | 0.17 | [1.66, 2.34] | weakly reliable |
| 250 | 0.11 | [1.78, 2.22] | reliable |
| 500 | 0.077 | [1.85, 2.15] | very reliable |
| 1000 | 0.055 | [1.89, 2.11] | very reliable |
Reading the tables. "Reliable" means the 95% confidence interval excludes Sharpe = 0 by a wide margin and the half-width of the CI is small relative to the point estimate. "Weakly reliable" means the CI excludes Sharpe = 0 but the half-width is comparable to the point estimate, so the strategy has demonstrated nonzero edge but the magnitude is uncertain. "Unreliable" means the CI is wide enough that the strategy could have any value from near-zero to substantial edge.
Effective trade count, defined
The headline trade count from a backtest is rarely the effective N. Three corrections.
Correction 1: hold-time overlap. A strategy that holds positions for 30 days and observes returns daily has approximately N_observations / 30 effective independent trades. The 240 daily-observation strategy from the opening with a 5-day average hold has effective N approximately 50, not 240. The standard error scales accordingly.
Correction 2: cross-sectional dependence. A long-short equity strategy with 100 positions per side over 24 months has 4800 position-observations but the effective independent decision count is closer to 24 (the rebalance count) or 24 times the number of independent factor exposures (typically 3-7 in a well-constructed factor strategy). Effective N is the count of independent decisions, not positions.
Correction 3: regime gating. A strategy that trades only when a regime indicator is active (covered in "Volatility Regimes and Strategy Survival") has effective N equal to the trade count within the active regime, not the total observation count. A strategy gated to high-vol regimes that occur 20% of the time over 10 years of daily data has approximately 250 effective trades, not 2500.
The honest count. Apply the corrections in sequence: divide by hold time, account for cross-sectional dependence, restrict to within-regime if gated. The result is the effective N to use in the Sharpe-confidence-interval calculation.
Trust requirements beyond raw N
Five additional requirements, each independently necessary.
Requirement 1: sample regime coverage. The article "Regime Coverage: Why Your Backtest Needs Different Market States" framed the requirement; the trade count must distribute across regimes the strategy will encounter live. A strategy with 1000 trades all in low-vol bull markets has zero effective N for high-vol bear-market deployment. The deployment regime determines which subset of trades is informative.
Requirement 2: search-width correction. The article "Degrees of Freedom in Trading Systems" framed the bias. The trade count provides the standard error; the parameter count provides the bias. Both matter. A high N with a high p / N ratio still produces an unreliable IS Sharpe because the bias from optimization dominates.
Requirement 3: realistic costs. A backtest that ignores transaction costs over-states the Sharpe by 0.2-0.5 for active strategies. The trade-count threshold for "reliable" depends on the cost-adjusted Sharpe, not the gross Sharpe.
Requirement 4: independent OOS slice. The IS Sharpe with confidence interval is one estimate. The OOS realization on a slice never seen during research is the validation. Both are required; neither alone is sufficient. The article "Why OOS Failure Is Often a Stationarity Failure" framed the diagnostic flow when the OOS underperforms the IS.
Requirement 5: structural premise. A statistically significant IS Sharpe on a strategy with no economic mechanism is suspicious in a way that a statistically significant Sharpe on a structural premium is not. The trade count is a noise-control diagnostic; it does not certify the underlying mechanism.
Extending N when needed
Three approaches.
Approach 1: lengthen the backtest. Use longer history. The trade-off: older data may be from a different personality (covered in "Market Personality: Why Gold, FX, Crypto, and Equities Need Different Systems") and the resulting N is mixing trades from different regimes. The article "Slow Wandering: The Most Dangerous Type of Market Change" framed the personality-drift problem.
Approach 2: broaden the universe. Apply the strategy to multiple markets within a family (cross-market test from "Why Works on All Markets Is Usually a Red Flag", but within-family). The trade count multiplies. The trade-off: cross-market correlation reduces effective N by a factor that depends on the within-family correlation; for tightly-correlated indices like SPX and NDX, the multiplier is approximately 1.2-1.5x, not 2x.
Approach 3: Monte Carlo augmentation. Bootstrap the existing trades to estimate the Sharpe distribution under resampling. Useful for confidence intervals but does not extend the underlying information; the bootstrap mean equals the IS mean and the bootstrap variance is determined by the IS variance. Covered in "Monte Carlo for Trading Systems" later in this pillar.
The general rule. Lengthen and broaden first; bootstrap second; do not artificially extend N by counting overlapping observations.
Anti-patterns
Five mistakes specific to the trade-count question.
Anti-pattern 1: declaring a backtest reliable based on the calendar length, not the trade count. A 5-year backtest of a strategy that trades twice per month has 120 trades. A 5-year backtest of a strategy that trades twice per day has 2500 trades. The reliability of the Sharpe estimate is very different despite the same calendar length.
Anti-pattern 2: counting daily observations as trades for a hold-30-day strategy. The 240 effective trades become 8 effective trades after the hold-time correction. The Sharpe estimate's standard error is 5-6x larger than the naive calculation suggests.
Anti-pattern 3: using the 30-trade threshold from intro statistics. The 30-trade threshold is for the central limit theorem to apply to the sample mean's distribution; it has nothing to do with the precision of the Sharpe estimate or the OOS reliability. Covered in detail in "Why 30 Trades Is Not a Strategy".
Anti-pattern 4: ignoring search-width inflation when computing the confidence interval. The standard error formula assumes an unbiased estimator. The IS Sharpe from an optimization is biased. The right confidence interval is around the bias-corrected Sharpe, not the raw Sharpe.
Anti-pattern 5: declaring a strategy "reliable" without the regime-coverage check. A strategy with 1000 trades all in one regime has 1000 noisy estimates of the within-regime Sharpe and zero estimates of the across-regime Sharpe. The reliability is regime-conditional.
Decision matrix
| True Sharpe | Required N for reliable estimate | Required N for very reliable |
|---|---|---|
| 0.3 | 600+ | 2000+ |
| 0.5 | 250 | 1000 |
| 0.7 | 150 | 500 |
| 1.0 | 100 | 400 |
| 1.5 | 70 | 250 |
| 2.0 | 50 | 200 |
The matrix maps true Sharpe to required N. The pattern: stronger edges need fewer trades to validate. Most realistic strategies have true Sharpe between 0.3 and 0.8, requiring N between 250 and 1000 effective trades.
Visualizing the trade-count requirement
KEY POINTS
- The standard error of a Sharpe estimate from N independent observations is approximately sqrt((1 + 0.5 SR^2) / N). For small Sharpes, SE approximately 1/sqrt(N). The 95% confidence interval is approximately [SR - 2 SE, SR + 2 SE].
- For an annualized Sharpe of 1.0 from one year of daily data, the SE is approximately 0.45 and the CI is approximately [0.10, 1.90]. One year of data is uninformative.
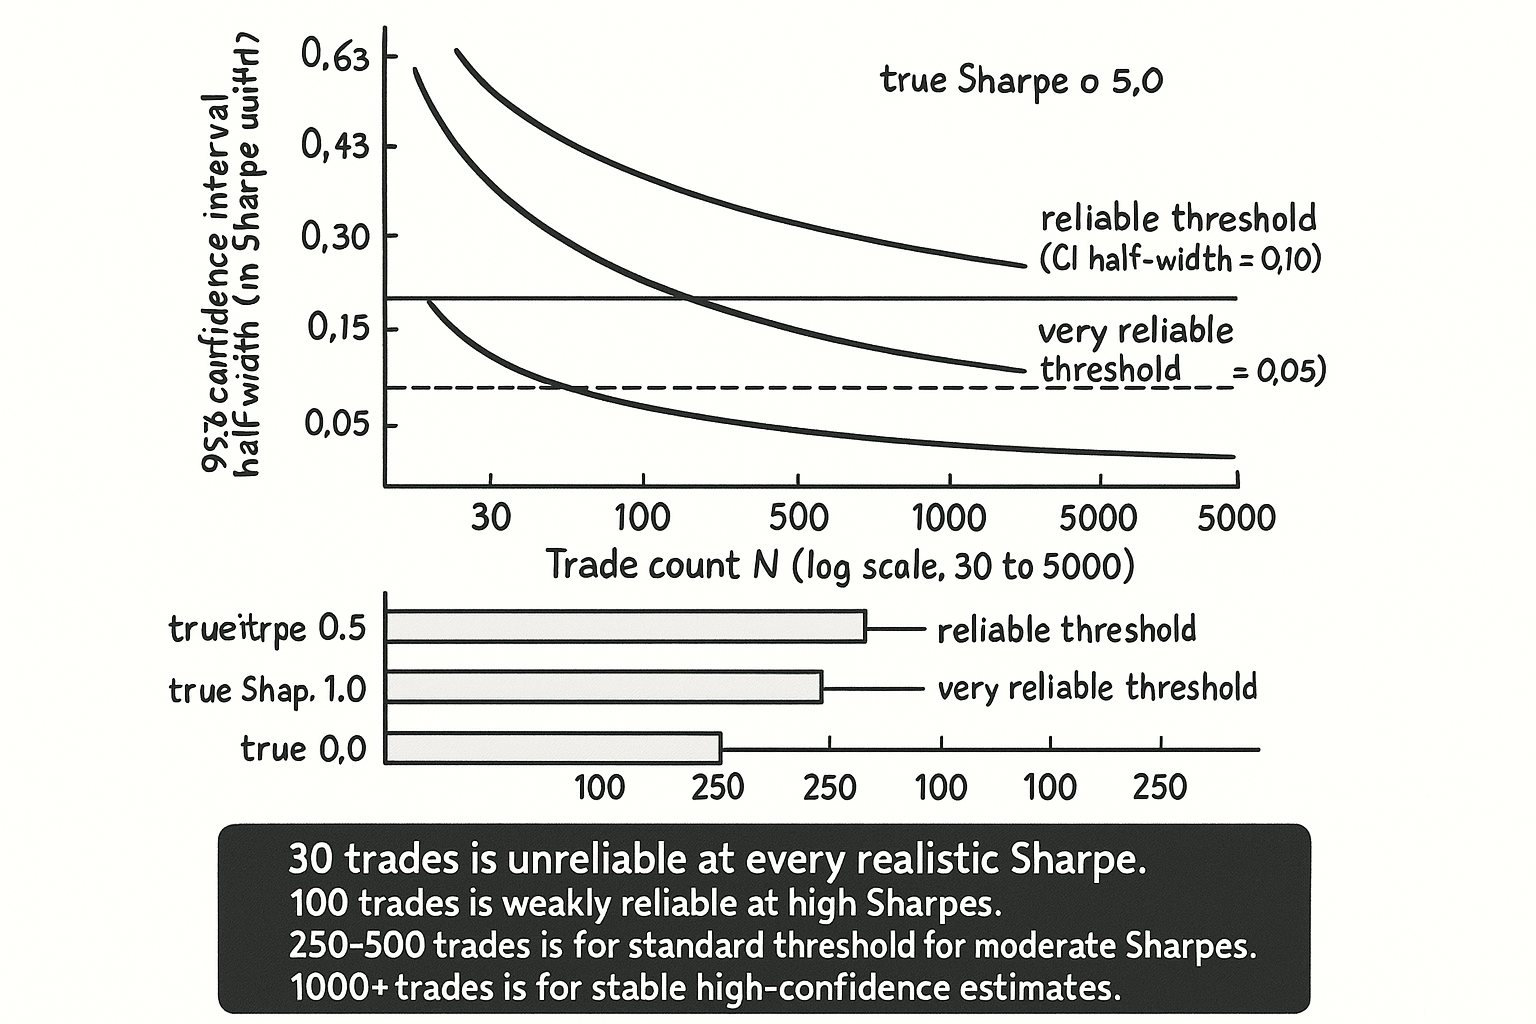
- Operational trade-count thresholds: 100 trades = weakly reliable, 250 trades = moderately reliable, 500 trades = reliable, 1000+ trades = very reliable. The thresholds depend on the true Sharpe magnitude.
- Effective N is not the headline trade count. Three corrections: divide by hold-time overlap, account for cross-sectional dependence (effective N approximately rebalance count for cross-sectional factors), restrict to within-regime trade count if gated.
- A 240-day-observation strategy with 5-day hold time has effective N approximately 48, not 240. A long-short factor with 4800 position-observations has effective N approximately 24-72, not 4800. A regime-gated strategy active 20% of the time over 10 years has approximately 250 effective trades, not 2500.
- The trade count provides the standard error of the Sharpe estimate. The parameter count (from "Degrees of Freedom in Trading Systems") provides the bias. Both matter; high N with high p / N still produces unreliable estimates.
- Five additional requirements beyond raw N: sample regime coverage, search-width correction, realistic costs, independent OOS slice, structural premise. The trade count is a noise-control diagnostic, not a certification.
- Three approaches to extending N: lengthen the backtest (with personality-drift caveat), broaden the universe within a market family (with correlation correction), Monte Carlo augmentation for CI estimation only (does not extend underlying information).
- Anti-pattern: declaring a backtest reliable based on calendar length, not trade count. A 5-year backtest with 120 trades and one with 2500 trades are not equivalent.
- Anti-pattern: counting daily observations as trades for hold-many-days strategies. Apply the hold-time correction.
- Anti-pattern: using the 30-trade threshold from intro statistics. The 30-trade threshold is unrelated to Sharpe estimation precision.
- Anti-pattern: ignoring search-width inflation when computing CIs. The CI should be around the bias-corrected Sharpe.
- Anti-pattern: declaring "reliable" without regime-coverage check. Reliability is regime-conditional.
- The current article gives the general framework for trade-count requirements. The next article in the publication ("Why 30 Trades Is Not a Strategy") covers the specific misuse of the 30-trade central-limit-theorem threshold in trading-system evaluation.
References
- Testing and Tuning Market Trading Systems - Timothy Masters (Amazon)
- Data Mining Algorithms in C++ - Timothy Masters (Amazon)
- The Statistics of Sharpe Ratios
- Robust Performance Hypothesis Testing with the Sharpe Ratio
- How to Use the Sharpe Ratio
- Evaluating Trading Strategies
- Backtest Overfitting in the Machine Learning Era
- Spurious Predictability in Financial Machine Learning
- Persistent Anomalies and Nonstandard Sharpe Ratios
- Online Quantitative Trading Strategies - NYU Stern