3.20 Why 30 Trades Is Not a Strategy
The 30-trade CLT threshold is about the sampling distribution of the mean, not deployment readiness. SE is 0.27 R for typical sigma. CI is wide. Each strategy property needs 200-1000 trades, not 30.
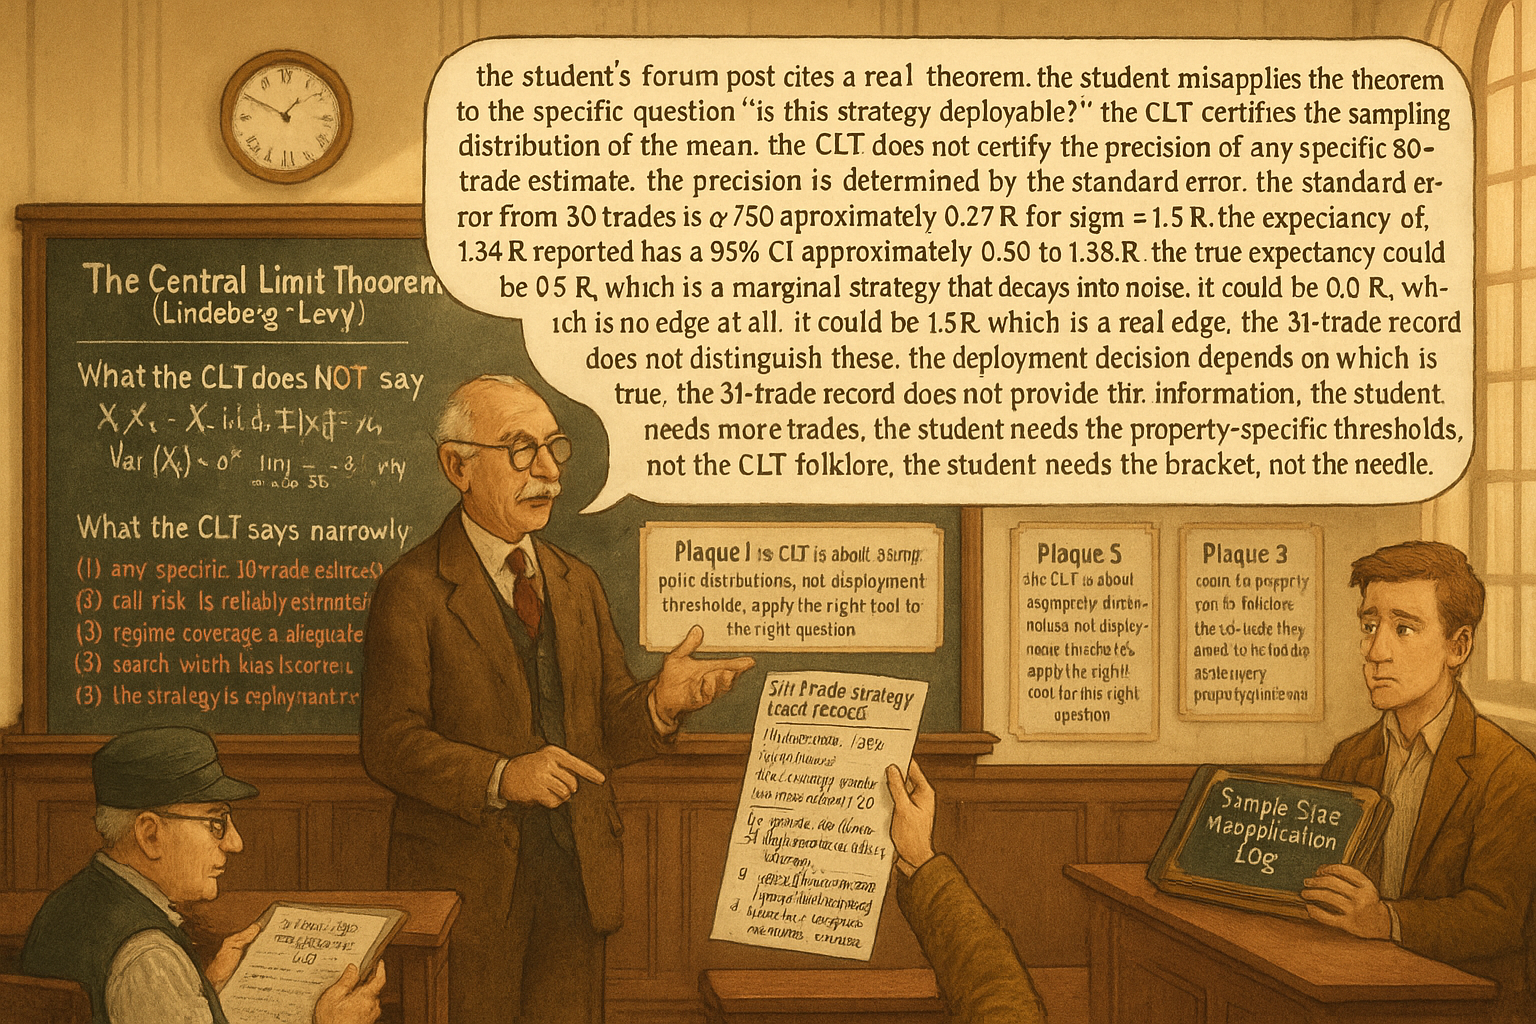
A trading-system seller posts a track record on a forum: "31 trades, 71% win rate, average win 2.3R, average loss 1.0R, expectancy 1.34R per trade, this strategy works". The post receives admiration. A reader counts the consecutive wins (the longest streak is six) and finds the result impressive. Some viewers accept the data as evidence the strategy is profitable and consider deploying capital. The objection that the seller anticipates and dismisses: "but you only have 30 trades". The seller's response is a paraphrase from intro statistics: "30 is the threshold for the central limit theorem. Anything above 30 is a valid sample." The forum accepts the response. Several readers deploy the strategy. Within six months, the realized win rate is 52%, the average win is 1.5R, the average loss is 1.4R, and the expectancy is approximately 0.1R per trade. The strategy was deployable on the 31-trade evidence in the same sense that a coin flipped 31 times that produced 22 heads is deployable as "biased toward heads" - which is to say, not at all.
The "30 trades" threshold has a real origin in introductory statistics: the central limit theorem says the sample mean of independent observations becomes approximately normally distributed for n above approximately 30, regardless of the underlying distribution shape. The CLT is true. The CLT does not say what the trading-system seller above implied it said. The CLT applies to the distribution of the sample mean as an estimator, not to the precision of any specific estimate from a specific sample. The sample mean from 30 trades is normally distributed around the true mean with standard error sigma / sqrt(30); the standard error is large unless sigma is very small. For a typical trading-system R-multiple distribution with sigma approximately 1.5, the SE of the sample mean from 30 trades is approximately 0.27 R-multiples. The expectancy of 1.34 R-multiples reported above has a 95% CI of approximately [0.80, 1.88]. The true expectancy could be 0.5 R-multiples (a marginally profitable strategy that decays into noise) or 0.0 (no edge at all, the headline was sample variance), or 1.5 R-multiples (a real edge). The 31-trade record does not distinguish between these.
The article "Trade-Count Thresholds for Backtest Reliability" gave the general framework for sample-size requirements. This article isolates the specific and very common failure mode of treating 30 trades as adequate evidence. The 30-trade threshold is the most-cited piece of statistical folklore in retail trading, and it is the wrong threshold by a factor of 5-30 depending on which strategy property is being estimated. The article enumerates which properties the 30-trade threshold fails for and gives the right thresholds in each case.
The CLT, narrowly stated
The central limit theorem (Lindeberg-Levy version): for independent identically distributed observations X_1, X_2, ..., X_n with finite mean mu and finite variance sigma^2, the sample mean (1/n) sum X_i converges in distribution to N(mu, sigma^2 / n) as n grows. The threshold "n approximately 30" comes from the empirical observation that for many common distributions (uniform, exponential, mild-skew), the normal approximation is accurate at n approximately 30.
The CLT's actual claim. The estimator (sample mean) has a known sampling distribution.
The CLT's silences. The estimator from a specific sample is a precise estimate of mu. It is not. The standard error sigma / sqrt(n) for n = 30 and sigma = 1.5 is 0.27, which is large for almost any expectancy a trading system would claim. The CI half-width at 95% is approximately 2 SE = 0.54. A reported expectancy of 1.0 R-multiple from 30 trades has a 95% CI of approximately [0.46, 1.54], which is consistent with edges ranging from "barely profitable" to "very strong".
The CLT, five additional silences. Five things the CLT does not address, each material for trading-system validation.
Silence 1: tail risk. The CLT applies to the sample mean. Tail-risk metrics (max drawdown, 95th-percentile loss, kurtosis) are functions of the entire empirical distribution, not the mean. Their estimation precision depends on the tail-region count, not the total n. With 30 trades, the largest observed loss is the 30th-quantile estimate; the actual 99th-quantile loss is unobserved. The strategy's tail risk is unmeasured.
Silence 2: regime coverage. The CLT assumes i.i.d. observations. Trading-system observations are not i.i.d. across regimes. 30 trades from a single regime do not characterize the strategy's behavior across regimes. The article "Regime Coverage: Why Your Backtest Needs Different Market States" framed the regime-stratification requirement; 30 trades is below the per-regime threshold for almost any meaningful regime stratification.
Silence 3: serial correlation. Trading-system trades are often serially correlated (consecutive losses come in clusters during drawdowns; consecutive wins come in clusters during favorable regimes). The CLT's i.i.d. assumption is violated. The effective n is less than the headline n; for a strategy with autocorrelation rho approximately 0.3 across consecutive trades, the effective n is approximately n times (1 - rho) / (1 + rho) approximately 0.54 n. The effective sample size from 30 trades is approximately 16 trades.
Silence 4: parameter-search bias. The 30 trades are typically the result of selecting from many candidate strategies and reporting the best. The article "Degrees of Freedom in Trading Systems" framed the bias; for 30 trades and a search width k_eff = 100, the bias on the IS expectancy is approximately sigma sqrt(2 log 100) / sqrt(30) approximately 0.78 R-multiples, which can swamp the apparent edge.
Silence 5: cost-and-slippage uncertainty. 30 trades is a small sample for estimating the average cost impact, the slippage distribution, and the worst-case execution outcomes. The cost-uncertainty band on the expectancy is wider than the trade count suggests.
Right thresholds for specific strategy properties
Six strategy properties with their actual sample-size requirements.
Property 1: expectancy / mean per-trade P&L. Required N for reliable estimate at typical sigma approximately 1.5: 200-500 trades. The 30-trade threshold underestimates by 7-17x.
Property 2: Sharpe ratio. From "Trade-Count Thresholds for Backtest Reliability", required N for reliable estimate at SR approximately 0.5-1.0: 250-500 trades. 30 trades is unreliable by 8-17x.
Property 3: win rate (binary outcome). Standard error of win rate is sqrt(p (1-p) / N). For p = 0.6 and N = 30, SE = 0.089, CI half-width = 0.18. The 71% win rate from 30 trades has 95% CI [0.53, 0.89]; the true win rate could be anywhere from "barely better than coin flip" to "strong edge". Required N for CI half-width of 0.05: approximately 384 trades for p = 0.5, fewer for very high or very low p.
Property 4: maximum drawdown. The expected maximum drawdown from N trades scales with sqrt(N) and the per-trade volatility. A 30-trade backtest's worst-observed drawdown is approximately 25% of the long-run-expected maximum drawdown for a strategy with no negative skew. The strategy's true tail-risk profile is severely underestimated. Required N for stable max-drawdown estimation: 1000+ trades, with the regime-stratified version of the analysis.
Property 5: per-regime behavior. With 4-6 distinct regimes and the requirement of approximately 50 trades per regime for any meaningful within-regime estimate, the total trade count for regime-stratified validation is 200-300 minimum, ideally 500-1000.
Property 6: cost / slippage profile. The right-tail of the per-trade cost distribution (worst execution) is sampled poorly with 30 trades. Required N for stable cost-distribution estimation: 200+ trades, with explicit attention to the tail.
The pattern. Every strategy property of interest has a sample-size requirement well above 30 trades. The CLT-derived 30-trade threshold is a starting point for asymptotic statistical theory, not a deployment threshold for trading-system validation.
The 30-trade threshold's persistence
Three structural reasons.
Reason 1: it is taught as a rule of thumb in introductory statistics. The phrase "n above 30 for the CLT" is widespread in textbooks and is incorrectly transferred to "n above 30 is enough for reliable estimation". The transfer is wrong but easy to make.
Reason 2: it justifies what retail traders want to do. A retail trader wants to deploy after running a strategy for a few weeks or a few months. 30 trades fits this timeline. The CLT-derived threshold provides a statistical-sounding justification for the desired conclusion.
Reason 3: it is rarely challenged in retail forums. The seller cites the CLT; the audience accepts the citation; the few skeptics who object are dismissed as "too academic" or "moving the goalposts". The forum has no mechanism to enforce a higher threshold because there is no allocator-style deployment-failure feedback.
The fix. Replace the CLT-threshold with the property-specific thresholds from the matrix above. Cite the actual sample-size requirement for the property being estimated, not the CLT.
The math of 30-trade unreliability
A simple calculation. For a strategy with true Sharpe SR = 0.7 (a strong but realistic structural edge), the observed IS Sharpe from 30 independent observations has SE approximately sqrt(1 + 0.5 (0.7)^2) / sqrt(30) approximately 0.21. The 95% CI is approximately [0.28, 1.12].
$$ \widehat{\text{SR}}_{30} \in [\text{SR} - 2 \cdot \text{SE}, \text{SR} + 2 \cdot \text{SE}] = [0.28, 1.12] \text{ when } \text{SR} = 0.7, N = 30 $$
The CI of [0.28, 1.12] spans from "barely useful" to "exceptional". A 30-trade record cannot distinguish "this strategy has Sharpe 0.3" from "this strategy has Sharpe 1.1". The strategy's deployment decision should depend on which of these is true; the 30-trade record does not provide the information.
For a strategy with true Sharpe SR = 0 (no edge at all), the observed IS Sharpe from 30 trades has SE approximately 0.18 and 95% CI approximately [-0.37, 0.37]. By chance alone, approximately 5% of zero-edge strategies will produce IS Sharpe above 0.37 from 30 trades. With multiple strategies tested (the article "Degrees of Freedom in Trading Systems" framed the search-width bias), the probability of finding such a false positive grows quickly.
$$ \Pr(\widehat{\text{SR}}_{30} > 0.5 \mid \text{SR} = 0) \approx 0.07 $$
Given a zero-edge strategy and 30 trades, there is approximately a 7% probability of seeing an IS Sharpe above 0.5 by chance alone. With 10 strategies tested, the probability of at least one false positive at this threshold is approximately 1 - (1 - 0.07)^10 = 0.52. The 30-trade record cannot distinguish a 7%-luck false positive from a real edge.
Anti-patterns
Five mistakes specific to the 30-trade misuse.
Anti-pattern 1: citing the CLT as evidence the strategy is reliable. The CLT certifies the sampling distribution of the mean; it does not certify the precision of any specific estimate. The right citation is the standard error formula and the resulting CI, which for 30 trades is wide.
Anti-pattern 2: declaring a strategy proven after 30 live trades. Live trades after deployment are valuable for OOS validation, but 30 OOS trades cannot reject the null hypothesis "the strategy has no edge" against a realistic alternative. The OOS sample needs to be large enough to detect the expected edge with adequate statistical power; for typical edges, 30 trades is insufficient by a factor of 5-15.
Anti-pattern 3: averaging "30 trades good" with "more trades better" as if both perspectives have weight. The first perspective is wrong; averaging it with correct perspectives produces wrong conclusions. The right framing is that 30 trades is unreliable across all strategy properties of interest.
Anti-pattern 4: applying the 30-trade threshold to per-regime trade counts. With 6 regimes and 30 trades total, each regime has 5 trades on average; per-regime estimates are useless. The per-regime requirement is approximately 50 trades minimum, which means the total trade-count requirement scales with the number of regimes.
Anti-pattern 5: forum or social-media validation. A strategy with 30 trades that has been admired in a forum is not a validated strategy. The number of forum upvotes does not enter the standard error formula. The strategy needs the trade count, the parameter count, the regime coverage, the cost realism, and the OOS hold-out before deployment. None of these are in the forum metric.
Decision matrix
| Strategy property | Required N | 30 trades is short by |
|---|---|---|
| Expectancy (mean per-trade P&L) | 200-500 | 7-17x |
| Sharpe ratio | 250-500 | 8-17x |
| Win rate (CI half-width 0.05) | 384 | 13x |
| Max drawdown (stable estimate) | 1000+ | 33x+ |
| Per-regime behavior (6 regimes) | 300+ | 10x |
| Cost / slippage tail | 200+ | 7x |
| Search-width bias correction | depends on k_eff, typically 500+ | 17x+ |
| Out-of-sample validation | matches IS requirements | 7-30x |
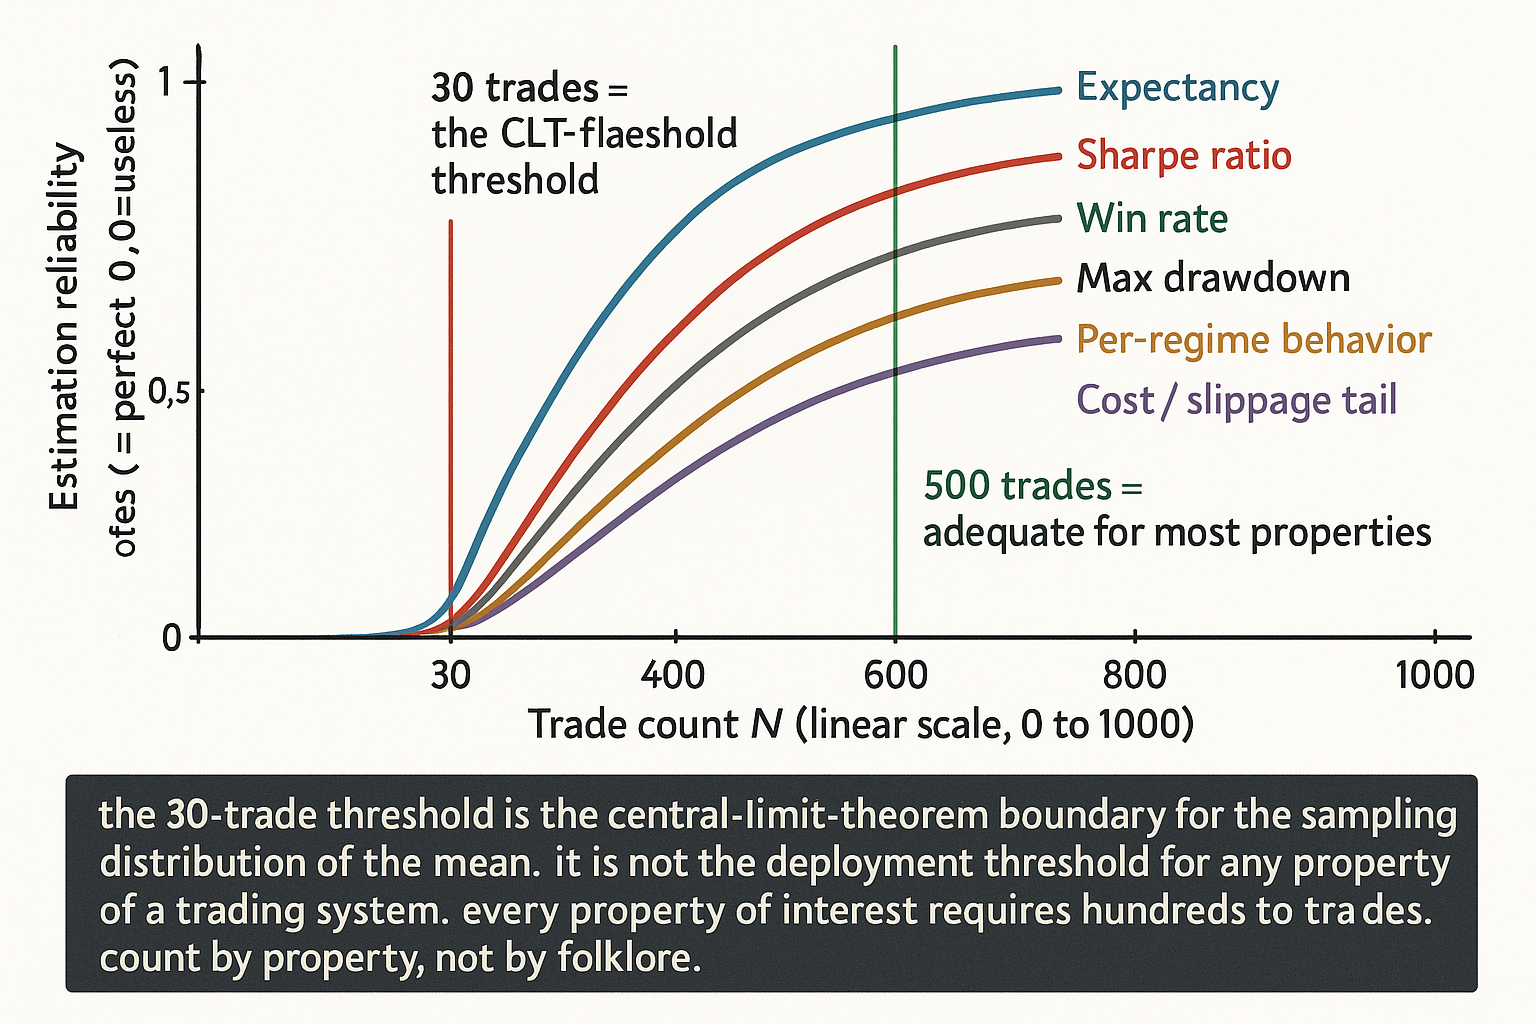
The matrix maps strategy property to actual sample-size requirement. The pattern: 30 trades is unreliable across every property of interest, by a factor of 5-30 depending on the property.
Visualizing the 30-trade fallacy
KEY POINTS
- The "30 trades" threshold has a real origin in the central limit theorem: the sample mean of i.i.d. observations becomes approximately normally distributed for n above approximately 30. The CLT says the sample mean has a normal sampling distribution; it does not say any specific 30-trade estimate is precise.
- The standard error of a sample mean from 30 trades is sigma / sqrt(30) approximately 0.27 for typical sigma approximately 1.5 R-multiples. The 95% CI is approximately +/-0.54, which is wide for any expectancy a trading system would claim.
- The CLT is silent on five trading-system requirements: tail risk (the largest observed loss in 30 trades is approximately the 30th-quantile, not the 99th-quantile), regime coverage (30 trades fits in one regime), serial correlation (effective n is approximately 0.5 n for typical autocorrelation), parameter-search bias (search-width inflation is large at small N), cost-and-slippage tail (the right-tail of cost distribution is undersampled).
- Right thresholds for specific properties: expectancy 200-500 trades, Sharpe 250-500, win rate 384 for CI half-width 0.05, max drawdown 1000+, per-regime stratification 300+, cost tail 200+. 30 trades is short by 5-30x depending on the property.
- For a true Sharpe of 0.7, the IS Sharpe from 30 trades has 95% CI approximately [0.28, 1.12]. The 30-trade record cannot distinguish a barely-profitable strategy from an exceptional one.
- For a true Sharpe of 0, the probability of seeing IS Sharpe above 0.5 from 30 trades is approximately 7% by chance alone. With 10 strategies tested, the probability of at least one false positive is approximately 52%.
- The 30-trade threshold persists because (1) it is taught as a CLT rule of thumb in introductory statistics, (2) it justifies what retail traders want to do (deploy after weeks/months not years), (3) it is rarely challenged in retail forums where there is no allocator-style deployment-failure feedback.
- Anti-pattern: citing the CLT as evidence the strategy is reliable. The CLT certifies the sampling distribution of the mean, not the precision of any specific estimate.
- Anti-pattern: declaring a strategy proven after 30 live trades. OOS sample needs adequate statistical power to detect the expected edge.
- Anti-pattern: applying the 30-trade threshold to per-regime trade counts. With 6 regimes, the per-regime count from a 30-trade total is 5, which is useless.
- Anti-pattern: forum or social-media validation. The number of upvotes does not enter the standard error formula.
- The right framing: deployment requires the trade count appropriate to the property being estimated, not the CLT-folklore threshold. For most realistic strategies, the deployment-ready threshold is 250-1000 effective trades distributed across regimes.
- The current article isolates the 30-trade misuse. The next article in the publication ("Monte Carlo for Trading Systems") covers the bootstrap and synthetic-path techniques that can extend the information from a given trade count to provide CI estimates and what-if scenarios.
References
- Testing and Tuning Market Trading Systems - Timothy Masters (Amazon)
- Data Mining Algorithms in C++ - Timothy Masters (Amazon)
- Limitations of Quantitative Claims About Trading Strategy Evaluation
- Experimental Evaluation of an Algorithmic Trading Strategy Against Multiple Benchmark Models
- Structural Market Behavior and Systematic Trading
- A Rigorous Walk-Forward Validation Framework for Market Microstructure-Aware Algorithmic Trading
- AlphaEval: A Comprehensive and Efficient Evaluation Framework for Automated Alpha Mining Models
- How to Evaluate Trading Strategies: Single Agent Market Replay or Multi-Agent Interactive Simulation?
- Using a Deep Learning Model to Simulate Human Stock Traders in the Market
- GT-Score: A Robust Objective for Backtest-Driven Trading Strategy Optimization
- Central Limits and Financial Risk
- Evaluating Risk Forecasts with Central Limits
- Backtesting
- The GT-Score: A Robust Objective Function for Reducing Overfitting in Backtested Trading Strategies
A note on AI. The ideas, research, analysis, and conclusions in this article are my own. I use AI tools to help with editing and wordsmithing, because English is not my first language, and I am not shy about that. AI-generated ideas and AI-assisted writing are not the same thing: the first is empty slop from a generic prompt, the second is a tool for communicating years of real research more clearly. Judge the work by its substance, not by whether software helped polish the prose.