6.13 When a Drawdown Means the System Is Broken
Every system draws down, so depth alone is no kill signal. Compare the live drawdown to the permutation envelope, set a breach line before the pain, and act when it's crossed instead of freezing.
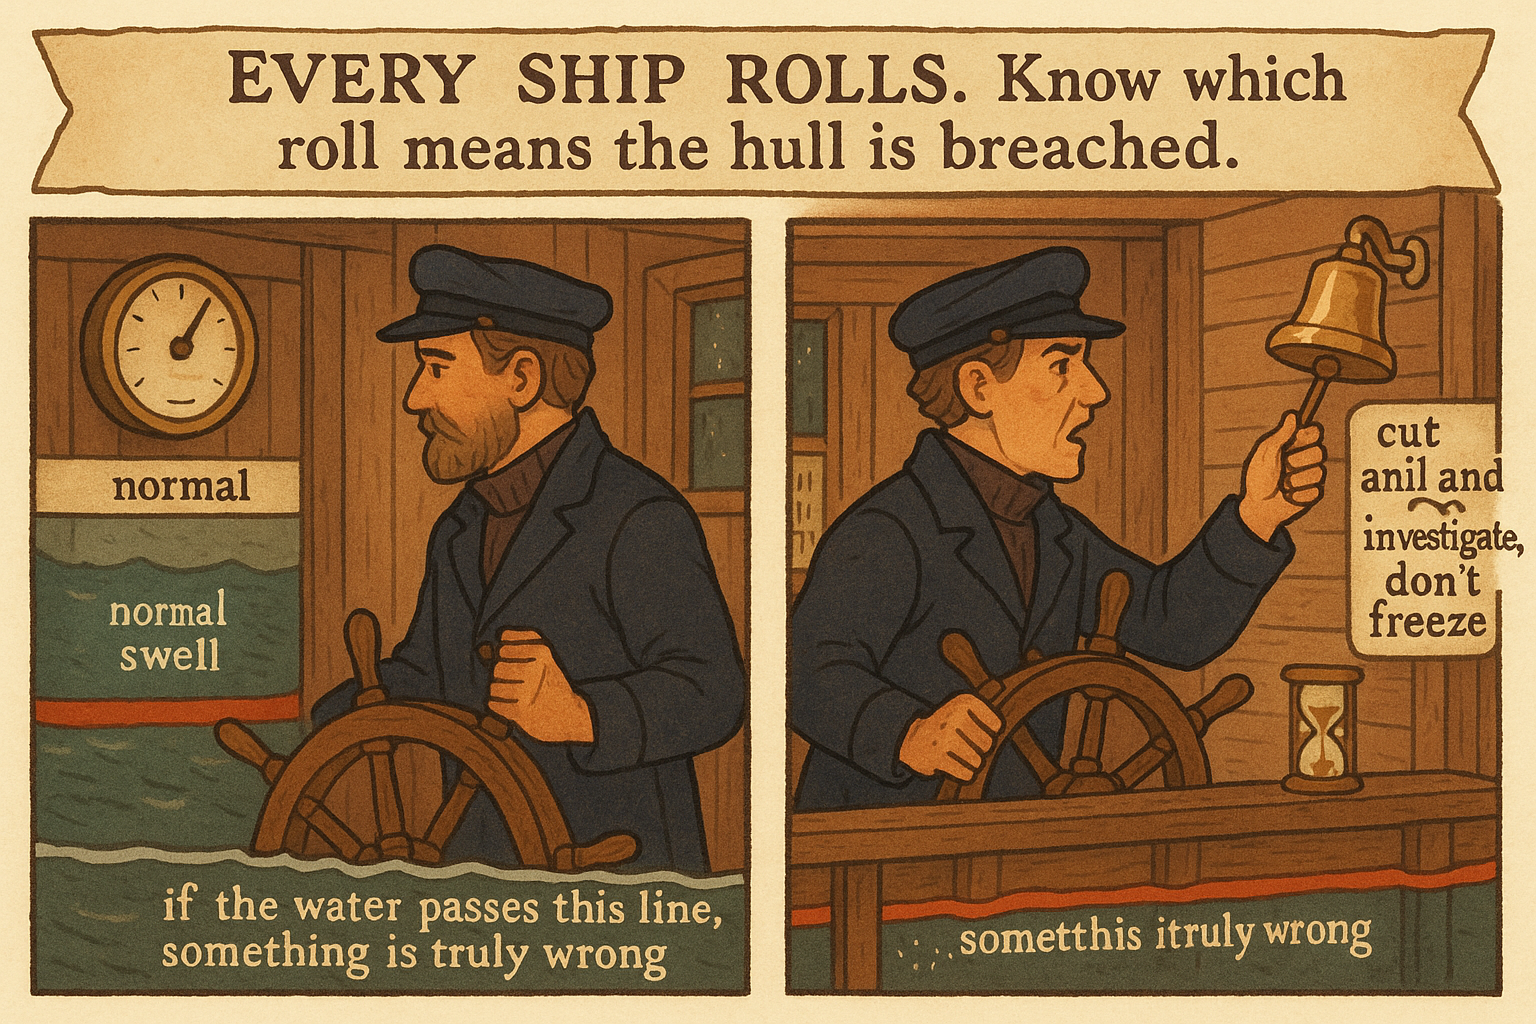
Every system draws down, so a drawdown by itself proves nothing. The hard question is whether this drawdown is the normal cost of the strategy or the moment the edge died, and traders get it wrong in both directions: they kill good systems in routine dips and ride dead ones into the ground hoping for a recovery that is never coming. The honest answer comes from comparing the drawdown you are living through against the drawdowns the system should produce if it still works. "Average Drawdown vs Extreme Drawdown" built that envelope; this is how you use it as a kill signal.
The envelope tells you what normal looks like
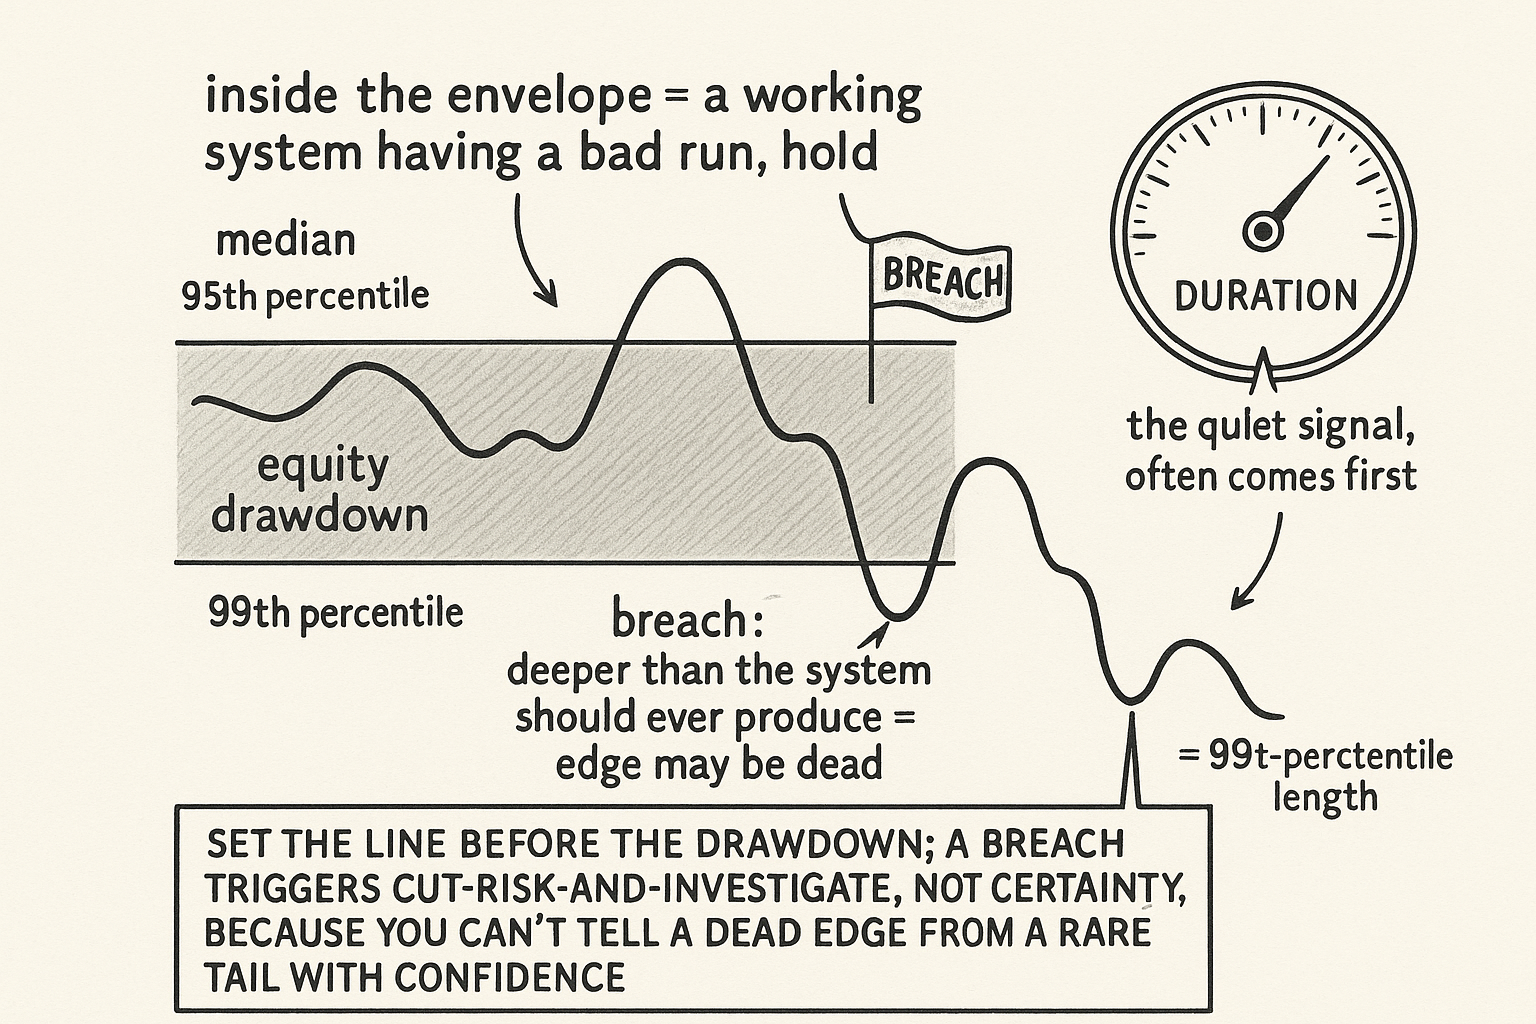
The Monte Carlo permutation distribution from the previous article is not just a capital-planning tool. It is a definition of normal. If the system's edge is intact, the drawdowns it produces should fall inside the distribution of drawdowns its own trades generate when reshuffled. A dip that lands in the body of that distribution, even a painful one near the median or up toward the 95th percentile, is consistent with a working system having a bad run. You expected drawdowns of that depth; one showed up; nothing is broken.
The signal that something has changed is a drawdown that exits the envelope. When the depth or the duration runs past what the permutation distribution says should happen, deeper than the 99th percentile, or lasting far longer than any reshuffle of the historical trades produces, the working-system hypothesis is in trouble. A drawdown that the system's own statistics say should almost never happen, happening, is evidence that the trades generating it are no longer drawn from the same distribution as the backtest. The edge that produced the historical trades may be gone.
$$ \text{kill signal: } \quad \text{maxDD}_{\text{live}} > \text{DD}_{99} \quad \text{or} \quad \text{duration}_{\text{live}} > \text{Dur}_{99} $$
Set the threshold before the drawdown, not during it. Pick a percentile of the permutation distribution, the 99th depth or the 99th duration, and commit to treating a breach as a reason to investigate or stop. The point of fixing it in advance is to remove your judgment from the moment when your judgment is worst, deep in a losing streak, desperate for the recovery, every bias pulling you to hold. A pre-committed statistical line is the only thing that overrides the desperation.
Depth alone is not enough, watch duration and character
A breach of the depth envelope is the loud signal, and duration is the quiet one that often comes first. A system can stay inside its depth limits while drawing down for far longer than it ever did historically, grinding sideways-to-down for a period the backtest never produced. That extended flat-to-bleeding stretch, even without a record depth, is its own warning, because a working edge should recover within roughly the timeframes its history shows, and one that does not is behaving like a different system. Watch both, and watch the character of the trades from "Drawdown Is Not Just a Number: It Is a Diagnosis": losses arriving in the conditions that historically favored the system are worse news than the same depth arriving in a regime the system was never built for.
The caveat that keeps you honest: the envelope assumes the future trade distribution matches the past, and a breach can mean either the edge died or you simply hit the genuine tail that the permutation underweighted because it broke up loss clustering. You cannot distinguish a dead edge from an unlucky-but-alive one with certainty, which is why a breach triggers investigation and a size reduction rather than instant, permanent shutdown. Cut risk when the line is crossed, dig into whether the edge logic still holds, and decide from the evidence, accepting that you will sometimes kill a system that would have recovered and sometimes hold one that is already dead. The line does not make you right; it makes you act instead of freeze.
Visualizing the kill signal
KEY POINTS
- A drawdown alone proves nothing, since every system draws down. The question is whether it is the normal cost of the strategy or the death of the edge.
- The permutation distribution defines normal. Drawdowns inside the body of the distribution, even painful ones near the 95th percentile, are consistent with a working system having a bad run.
- The kill signal is a drawdown that exits the envelope: deeper than the 99th percentile or lasting far longer than any reshuffle produces. A drawdown the system's own statistics say should almost never happen is evidence the trades changed distribution.
- Set the threshold before the drawdown and commit to it, to remove your judgment from the moment it is worst, deep in a losing streak with every bias pulling you to hold.
- Watch duration, not just depth. An extended flat-to-bleeding stretch longer than history ever produced is its own warning, and it often arrives before a record depth.
- A breach can mean a dead edge or a genuine tail the shuffle underweighted. You cannot be certain, so a breach triggers a risk cut and investigation, not instant permanent shutdown. The line makes you act instead of freeze.
References
- Systematic Trading - Robert Carver (Amazon)
- Trading Systems - Urban Jaekle Emilio Tomasini (Amazon)
- DRAWDOWN: From Practice to Theory and Back Again
- Optimal Portfolio Strategy to Control Maximum Drawdown
- Measuring Strategy-Decay Risk: Minimum Regime Performance and the Decay Gap
- Behavioral Finance: Theories and Evidence
- A Survey of Behavioral Finance
- Factor Investing and Asset Allocation
- Portfolio Structuring and the Value of Forecasting
- Journal of Behavioral Finance (journal home)