6.11 Drawdown Is Not Just a Number: It Is a Diagnosis
A drawdown's depth tells you almost nothing. The same dip can be a trend system paying its fee or a dead edge. Read the trades underneath; the diagnosis decides the treatment, not the number.
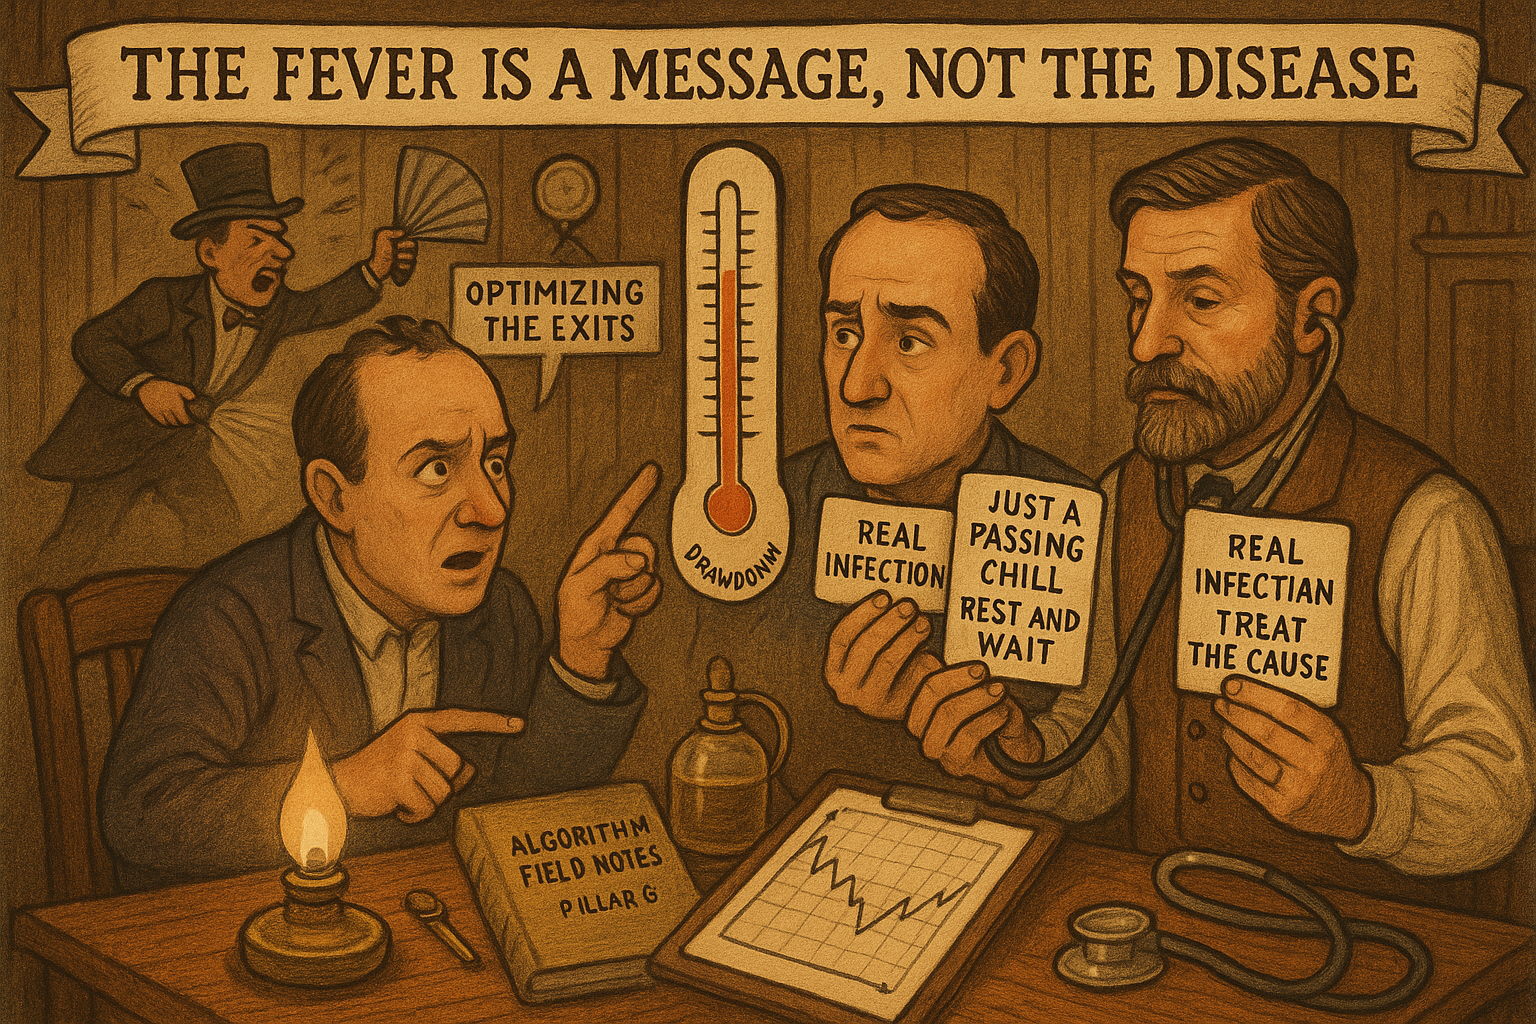
Most traders treat a drawdown as a wound to be bandaged. The equity curve dips, panic sets in, and the reflex is to tighten the stops, optimize the exits, add a filter, anything to stop the bleeding. That reflex treats the symptom and ignores the disease. A drawdown is the system telling you something about what it is doing and what the market is doing to it, and the useful response is to read the message, not to muffle it. Fighting a drawdown by tuning stops is like silencing a smoke alarm instead of looking for the fire.
This opens the run of articles on system death in this pillar, and it sits against "When a Drawdown Means the System Is Broken", which draws the line between a drawdown you sit through and one you act on.
A drawdown has a cause, and the cause is the information
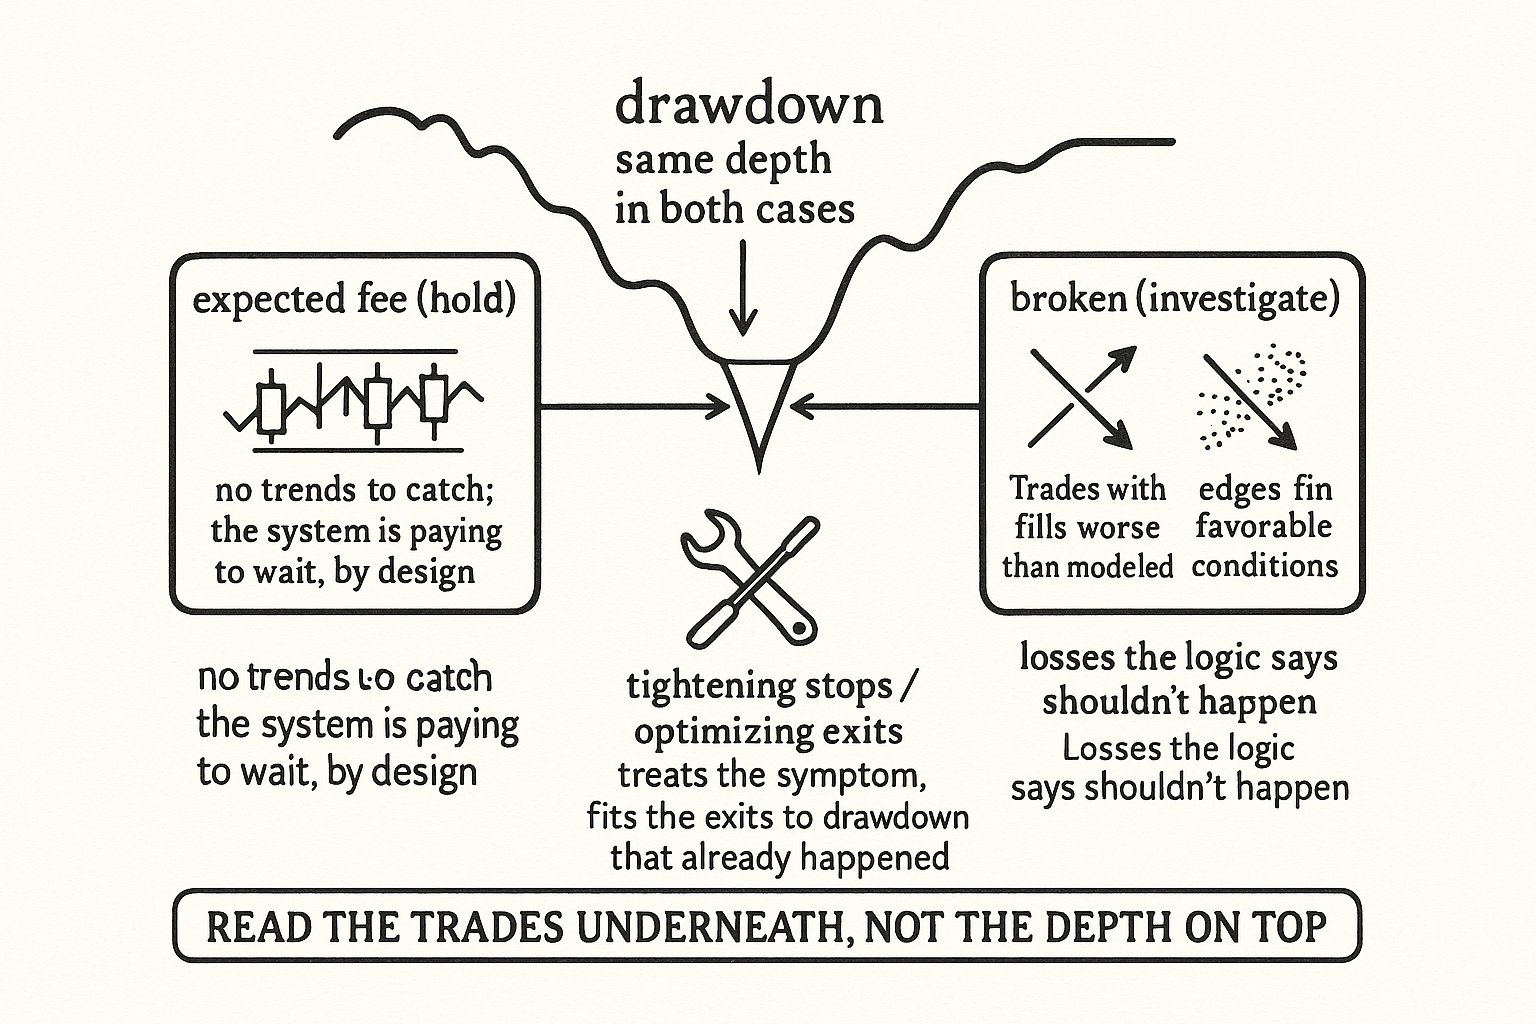
Define the thing first. A drawdown is the drop in equity from a peak to the lowest point before a new peak is made, measured as a depth and a duration. The depth and duration are the visible numbers, and they are the least interesting part. What matters is why the equity fell. A trend-following system in a long chop draws down because there are no trends to catch, and the losses are the strategy paying its membership fee while it waits, exactly the behavior you signed up for. A mean-reversion system drawing down in a strong trend is being run over by the thing it bets against, also expected. Those drawdowns are the system working as designed in a hostile regime, and tightening the stops would only make you pay the fee faster.
A different drawdown carries a different message. If the losses are coming from trades that should have worked under the system's own logic, fills far worse than modeled, the edge fading in conditions that historically favored it, the drawdown is reporting a problem with the strategy or its execution, not the market. Same depth on the equity curve, completely different diagnosis. You cannot tell which one you have by staring at the depth, because the number is identical in both cases. You have to look at the trades underneath it.
Optimizing the exits treats the symptom
The common error is to respond to any drawdown by reaching for the exit parameters, because exits feel like the lever closest to the loss. Tighten the stop, add a profit target, and the backtest drawdown shrinks. What you have done is fit the exits to the specific losing sequence you just lived through, which is curve-fitting dressed up as risk management. The next drawdown will arrive in a different shape, your tuned exits will not fit it, and you will have spent your robustness budget reducing the depth of a drawdown that already happened. The drawdown was a diagnosis; you treated it as a parameter to minimize, and minimized it on the one sample that no longer matters.
Read the drawdown instead. Pull the trades inside it and ask whether they are losses the system is supposed to take in this regime or losses it should have avoided. If they are the expected fee, you hold, because the cure is to wait for the regime the system was built for. If they are unexpected, the exits are the wrong place to look, and you investigate the edge and the execution. The diagnosis decides the treatment, and the depth of the drawdown tells you almost nothing about which treatment you need.
Visualizing the diagnosis
KEY POINTS
- A drawdown is the drop from an equity peak to the trough before the next peak, measured as a depth and duration. The depth is the least informative part; the cause is the information.
- The same drawdown depth can mean opposite things. A trend system drawing down in a chop is paying its expected fee while it waits; a system losing trades its own logic says should work is reporting a broken edge.
- You cannot diagnose a drawdown from its depth, because the number is identical whether the system is working as designed or failing. You have to read the trades inside it.
- Responding to any drawdown by tightening stops or optimizing exits treats the symptom. It curve-fits the exits to the specific losing sequence you just lived through.
- The next drawdown arrives in a different shape, so tuned exits will not fit it, and you have spent your robustness budget shrinking a drawdown that already happened.
- Diagnose first: are these losses the system is supposed to take in this regime, or losses it should have avoided? Expected fee means hold; unexpected means investigate the edge and execution, not the exits.
References
- Systematic Trading - Robert Carver (Amazon)
- Trading Systems - Urban Jaekle Emilio Tomasini (Amazon)
- Optimal Portfolio Strategy to Control Maximum Drawdown
- Trade Sizing Techniques for Drawdown and Tail Risk Control
- Measuring Strategy-Decay Risk: Minimum Regime Performance and Beyond
- Volatility spillover among the sectors of emerging and developed
- small-cap stock trading strategies for retail
- AlphaCrafter: A Full-Stack Multi-Agent Framework for Cross ... - arXiv
- Optimal Entry and Exit with Signature in Statistical Arbitrage - arXiv
- FACTOR INVESTING AND ASSET ALLOCATION