6.12 Average Drawdown vs Extreme Drawdown
Your backtest's max drawdown is one draw from a distribution you never measured. Reshuffle the trades thousands of times, read the extreme off a high percentile, and know it understates loss streaks.
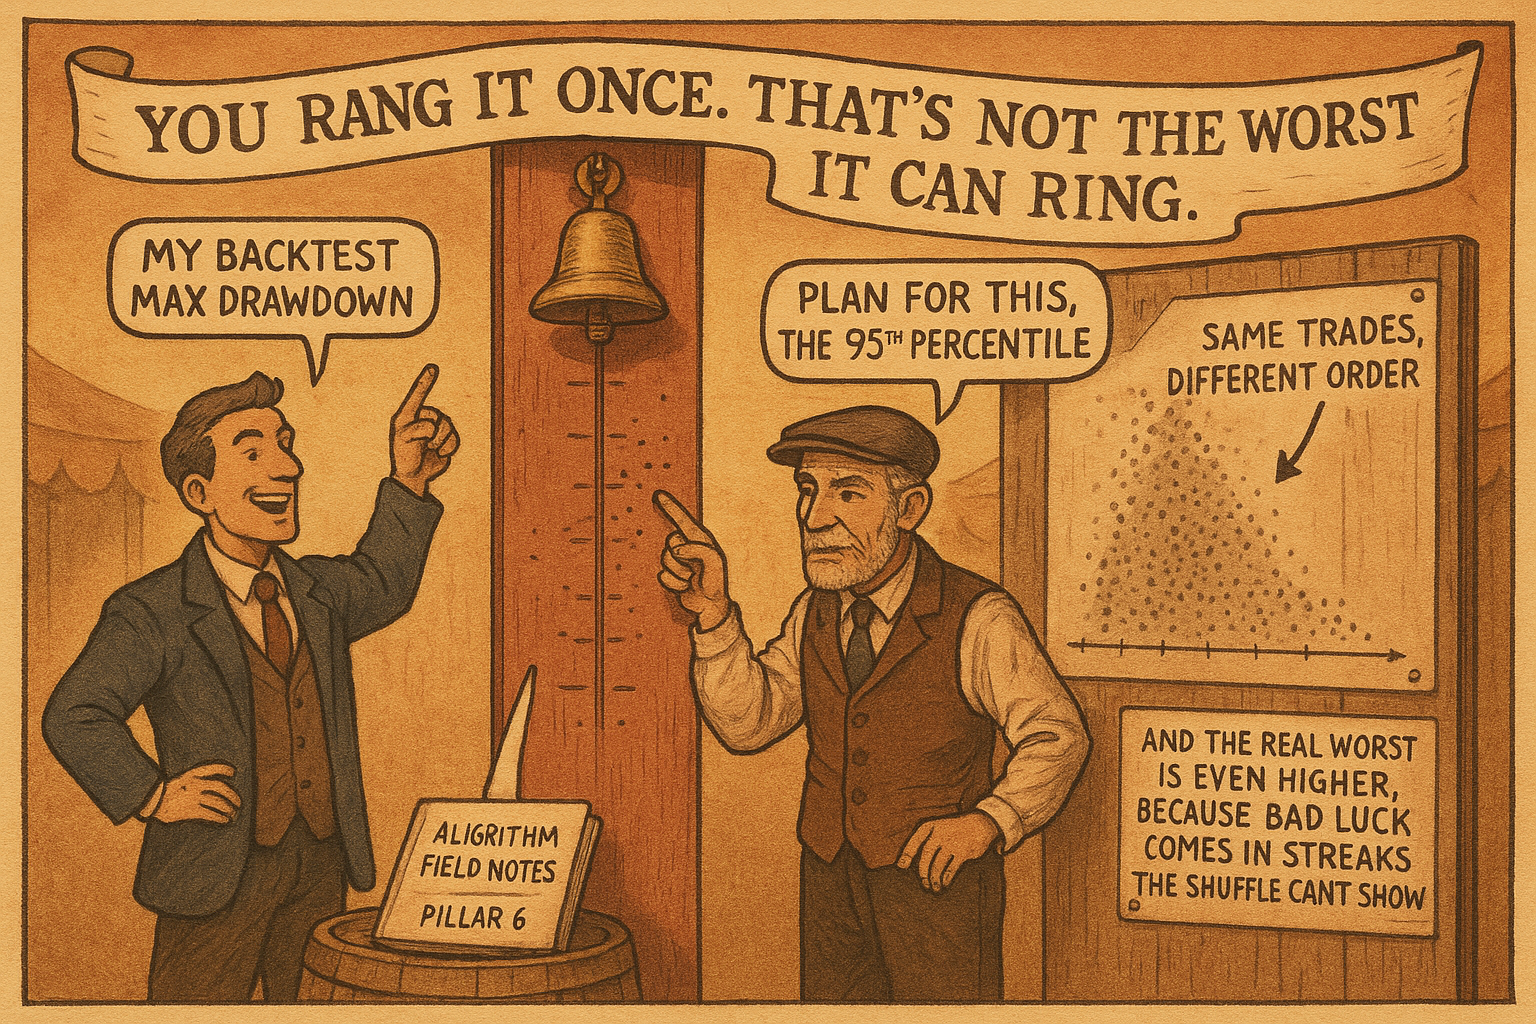
The max drawdown in your backtest is one number from one history, and traders treat it as the worst thing that can happen. It is not. It is the worst thing that did happen in a single sequence of trades that could have fallen in any order, and a different order would have produced a different max. Confusing the drawdown you will live with most of the time, the average drawdown, with the drawdown that defines your survival, the extreme, leads to two opposite mistakes: being spooked by routine dips and being blindsided by the tail you never simulated. "Drawdown Is Not Just a Number: It Is a Diagnosis" said to read the cause; this is about reading the distribution.
Two different questions about the same equity curve
The average drawdown answers a comfort question: how deep is the typical dip I have to stomach to run this system? It sets your emotional and operational baseline, the drawdowns you will see several times a year and must hold through without flinching. The extreme drawdown answers a survival question: how deep can the dip get before my capital, my risk limits, or my nerve gives out? These are different numbers serving different purposes, and a single backtest reports only one realized path through both.
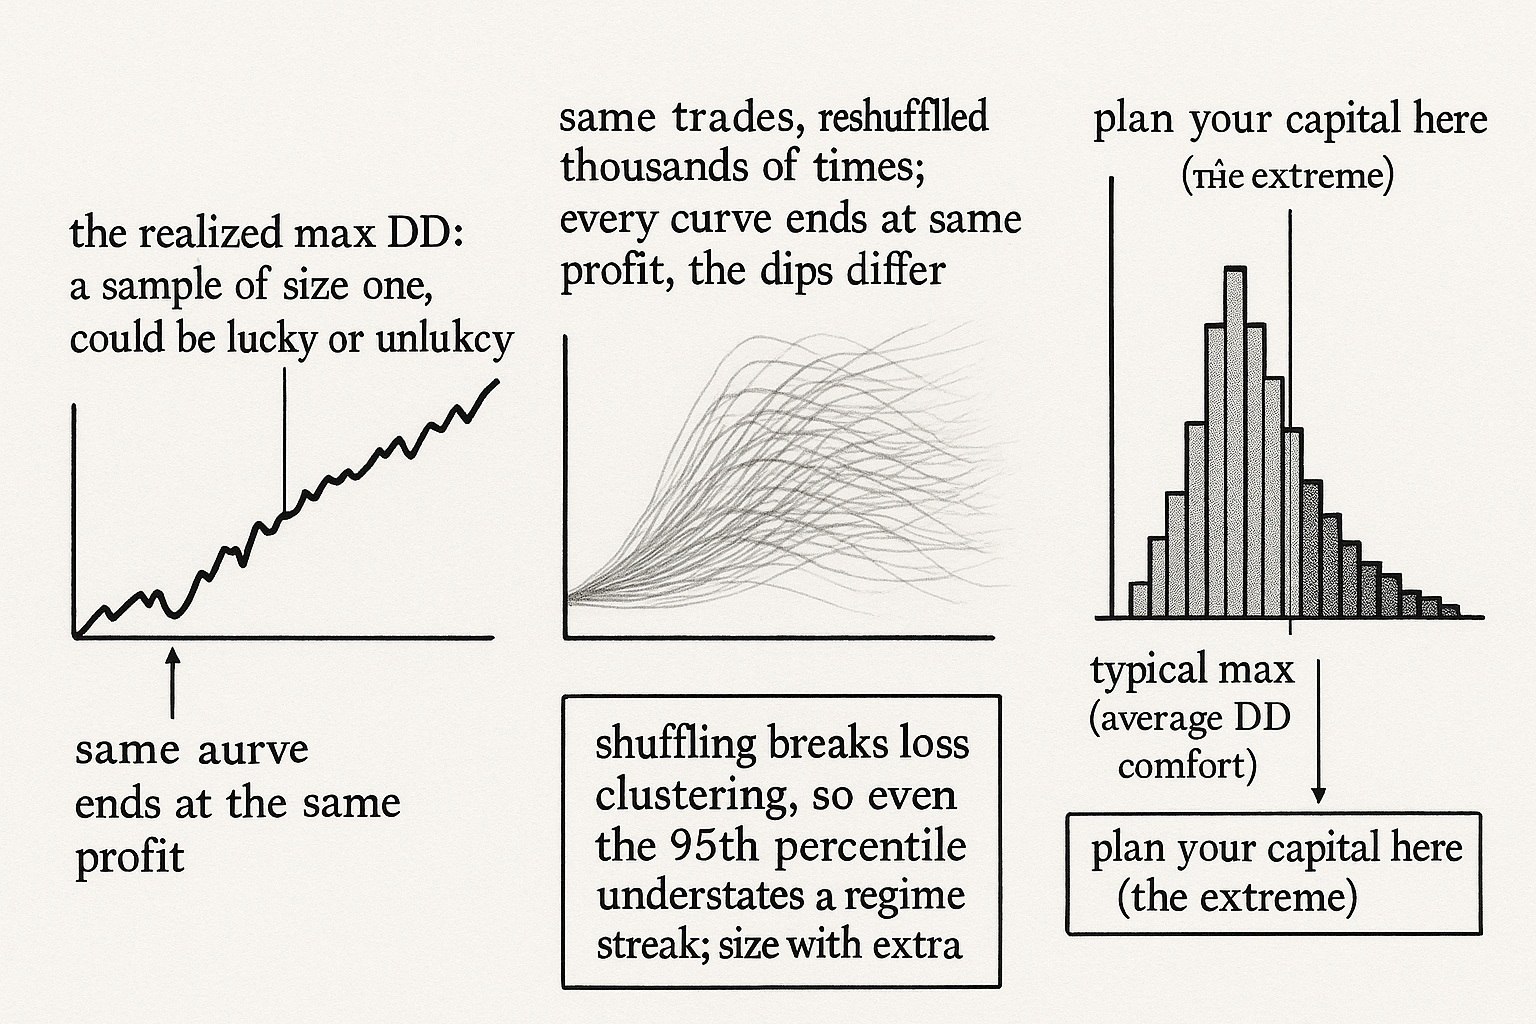
The depth-counting trap is to take the one max drawdown from the backtest and treat it as the extreme. That single number is a sample of size one from a distribution you have not measured. The trades happened to arrive in one particular order; the losers happened to cluster the way they did. Reshuffle the same trades and the max drawdown moves, sometimes a lot, because a drawdown is about the sequence, not just the trades. The realized max is neither the average you will usually feel nor the worst you should plan for. It is one draw.
Reshuffle the trades to see the distribution
The tool that turns one path into a distribution is the Monte Carlo permutation: keep your exact set of trades, shuffle their order thousands of times, and record the max drawdown of each shuffled equity curve. Because you are reordering the same trades without adding or removing any, every permuted curve ends at the identical final profit, but the drawdowns along the way differ, since the shape of the equity curve depends on the order the wins and losses arrive in. From the thousands of shuffles you get a full distribution of max drawdowns rather than a single observation.
$$ \text{DD}_{95} = \text{95th percentile of } \{\,\text{maxDD}(\pi) : \pi \in \text{permutations}\,\} $$
Read the planning number off the distribution, not off the backtest. The 95th-percentile max drawdown across the permutations, the depth that only 5% of reorderings exceed, is a far more honest figure for your extreme than the single realized max, which might sit anywhere in the distribution. The median of the distribution gives you a sense of the typical max; the high percentiles give you the tail you size your capital against. Plan your risk limits around the high percentile, not the backtest's lucky or unlucky single draw.
The honest caveat about the shuffle
The permutation assumes the trades are exchangeable, that reordering them is fair, and that assumption has a real hole. Shuffling destroys any serial dependence in the returns, so if your losses genuinely cluster, a bad regime producing a run of losers that the random shuffle breaks apart, the permutation understates the true extreme, because the real world serves the losers in clumps the shuffle never reproduces. The Monte Carlo also assumes the future trade distribution looks like the past one, which fails exactly when a regime shifts. So treat the permutation distribution as a better estimate of the extreme than the single max, and still not the true worst case, because the worst case lives in correlated streaks and regime breaks that no reshuffle of historical trades will show you. Size with margin beyond even the 95th percentile.
Visualizing the two drawdowns
KEY POINTS
- The backtest's max drawdown is one number from one history, a sample of size one. A different order of the same trades produces a different max, because a drawdown depends on the sequence, not just the trades.
- Average drawdown answers a comfort question (the typical dip you stomach several times a year); extreme drawdown answers a survival question (how deep before capital or nerve fails). They are different numbers for different purposes.
- The realized max is neither the average you usually feel nor the worst you should plan for. Treating it as the extreme is the depth-counting trap.
- Monte Carlo permutation turns one path into a distribution: keep the same trades, shuffle the order thousands of times, record each curve's max drawdown. Every permuted curve ends at the same profit, but the dips differ.
- Plan around a high percentile of the drawdown distribution, like the 95th, not the single realized max, which could sit anywhere in the distribution.
- The shuffle destroys loss clustering, so if losers genuinely arrive in streaks the permutation understates the true extreme. It also assumes the future looks like the past. Size with margin beyond the 95th percentile.
References
- Systematic Trading - Robert Carver (Amazon)
- Trading Systems - Urban Jaekle Emilio Tomasini (Amazon)
- Drawdowns: Measuring Historical Risk
- Drawdown: From Practice to Theory and Back Again
- A Review on Drawdown Risk Measures and Their Implications for Risk Management and Portfolio Construction
- Trade Sizing Techniques for Drawdown and Tail Risk Control
- Extreme Financial Risks and Maximum Drawdown
- Volatility-Managed Portfolios
- Volatility Scaling in Multi-Asset Portfolios
- Ups and (Draw)Downs by Tommaso Proietti :: SSRN