6.17 The Hidden Importance of Time in Market
Two systems with equal per-trade edge differ once you put them on a clock. Time in market sets return on capital, decides whether systems can offset each other, and charges hidden opportunity cost.
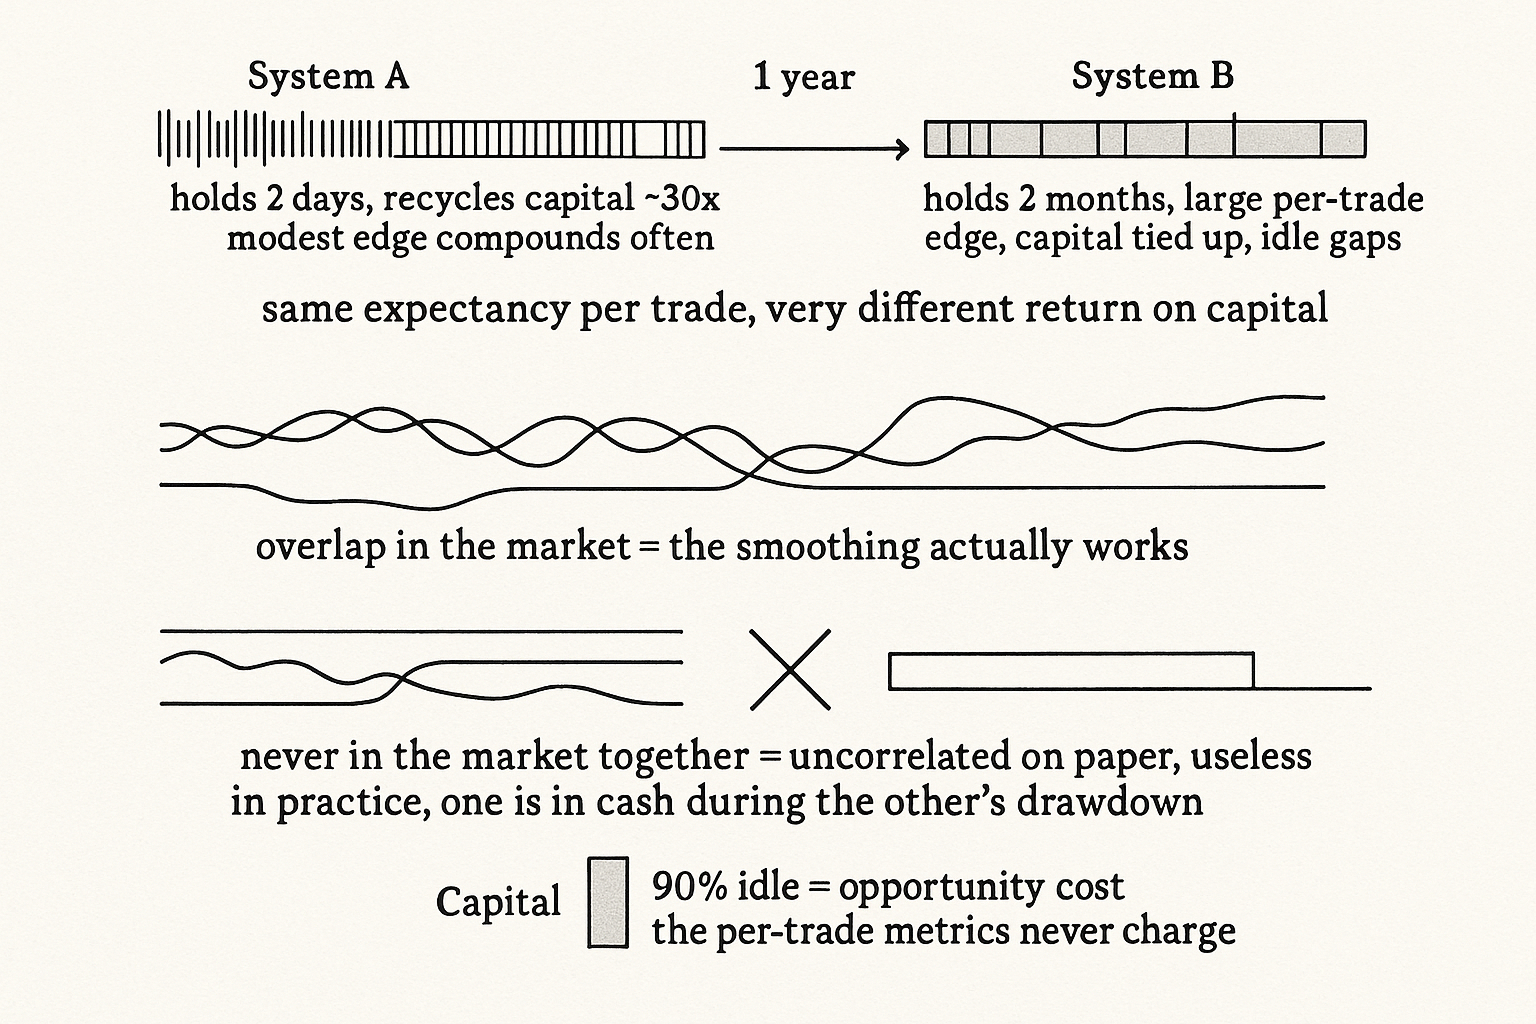
Two systems can earn the same profit per trade and have wildly different value, and the difference is time. One system holds each position for two days; the other holds for two months. The first recycles its capital thirty times while the second holds one bet, so even at equal per-trade expectancy the fast system can put its edge to work far more often, or tie up capital far less, than the slow one. Time in market is the dimension that profit factor, win rate, and expectancy all ignore, and it decides both how much you earn per unit of capital and whether two systems can be combined at all. The metrics in "Expectancy: The Most Important Formula in Trading" are all per-trade; this is what happens when you put them on a clock.
Per-trade is not per-year
Expectancy tells you what a trade is worth. It says nothing about how many trades you get or how long each one ties up your capital, and those determine your actual return on capital. A system with a modest per-trade expectancy that turns over weekly compounds that edge many times a year. A system with a large per-trade expectancy that holds for months collects the edge a few times a year and leaves the capital committed in between. Comparing the two on per-trade numbers is comparing a sprinter's stride length without asking how many strides they take, and the answer changes which system you would rather run.
Average time in trade is the bridge between the per-trade metrics and the per-year reality. Multiply expectancy by how many non-overlapping trades the holding period allows in a year and you get the annual edge from that capital, which is the number that actually matters for allocation. A short holding period is a multiplier on your edge, and it is also a cost multiplier, because faster turnover pays more spread, which is why the cost discipline from "Cost-Aware Ranking: The Missing Step in Cross-Sectional Strategies" bites hardest on the fastest systems.
Time decides whether systems combine
The deeper reason time matters shows up when you build a portfolio of systems. The whole value of running several systems together, covered in "Smooth Equity Curves Are Built, Not Found", is that their equity curves are uncorrelated, so one is winning while another draws down and the combined ride is smoother than any single one. That smoothing only works if the systems are actually in the market at overlapping times. Two beautifully uncorrelated systems that are never in a position simultaneously cannot offset each other, because when one is drawing down the other is flat, sitting in cash, doing nothing to cushion the dip.
So the average time in trade is not just an efficiency number, it is a compatibility number. To exploit the negative correlation between two systems' returns, they need enough simultaneous market exposure for one to be winning while the other loses. A system that is in the market 5% of the time contributes almost nothing to smoothing a portfolio of systems that are always on, no matter how attractive its standalone statistics, because it is in cash during the drawdowns it was supposed to offset. When you assemble systems, you check their time in market and their overlap, not just their standalone returns and correlations, because a correlation between two return streams that rarely coincide is a correlation you cannot actually harvest.
Time also sets your opportunity cost
The third edge of time is the capital you are not deploying. A system in the market 10% of the time leaves your capital idle 90% of the time, and idle capital earns nothing or earns the cash rate, which is an opportunity cost the per-trade metrics never charge you. A lower per-trade expectancy that keeps capital working can beat a higher one that leaves it parked, once you account for what the parked capital could have earned elsewhere. This is why time in market belongs on the report next to expectancy and profit factor, and why a system that looks excellent per trade can be a mediocre use of capital once you see how rarely it actually has a position on.
Visualizing time in market
KEY POINTS
- Time in market is the dimension expectancy, profit factor, and win rate all ignore. Two systems with equal per-trade edge differ in value because one recycles capital many times a year and the other holds one bet.
- Per-trade is not per-year. Annual edge is roughly expectancy times the number of non-overlapping trades the holding period allows, so a short holding period multiplies a modest edge and a long one collects a large edge rarely.
- A short holding period multiplies both the edge and the cost, since faster turnover pays more spread, so cost discipline bites hardest on the fastest systems.
- Time decides whether systems combine. The smoothing from uncorrelated systems only works when they are in the market at overlapping times; otherwise one sits in cash during the other's drawdown and cannot offset it.
- Average time in trade is a compatibility number, not just an efficiency one. Check time in market and overlap when assembling systems, because a correlation between rarely-coinciding streams cannot be harvested.
- Time sets opportunity cost. Idle capital earns nothing or the cash rate, so a lower per-trade expectancy that keeps capital working can beat a higher one that leaves it parked.
References
- Systematic Trading - Robert Carver (Amazon)
- Trading Systems - Urban Jaekle Emilio Tomasini (Amazon)
- The Impact of Volatility Targeting
- Volatility Scaling in Multi-Asset Portfolios
- Overconfident Investors, Predictable Returns, and Excessive Trading
- Noise Trader Risk in Financial Markets
- An Econometric Model of Serial Correlation and Illiquidity in Hedge Fund Returns
- Psychology-based Models of Asset Prices and Trading Volume
- Strategic Hedge Fund of Fund Portfolio Construction
- The Road Less Traveled: Strategy Distinctiveness and Hedge Fund Performance