6.18 Smooth Equity Curves Are Built, Not Found
The single perfect equity curve doesn't exist. Smoothness is assembled from several rougher, uncorrelated systems whose drawdowns fall at different times, and even that fails in a crisis.

Traders hunt for the one system with the clean, gently rising equity curve, the holy grail that never has an ugly drawdown. It does not exist, and the hunt is the wrong activity. Smooth equity curves are not discovered in a single strategy; they are assembled from several rougher ones whose drawdowns happen at different times. The smoothness is a property of the combination, not of any component, which means the work is in the portfolio, not in finding a perfect signal. "The Hidden Importance of Time in Market" set up why systems have to overlap to combine; this is what the combining buys you.
Every single system is lumpy
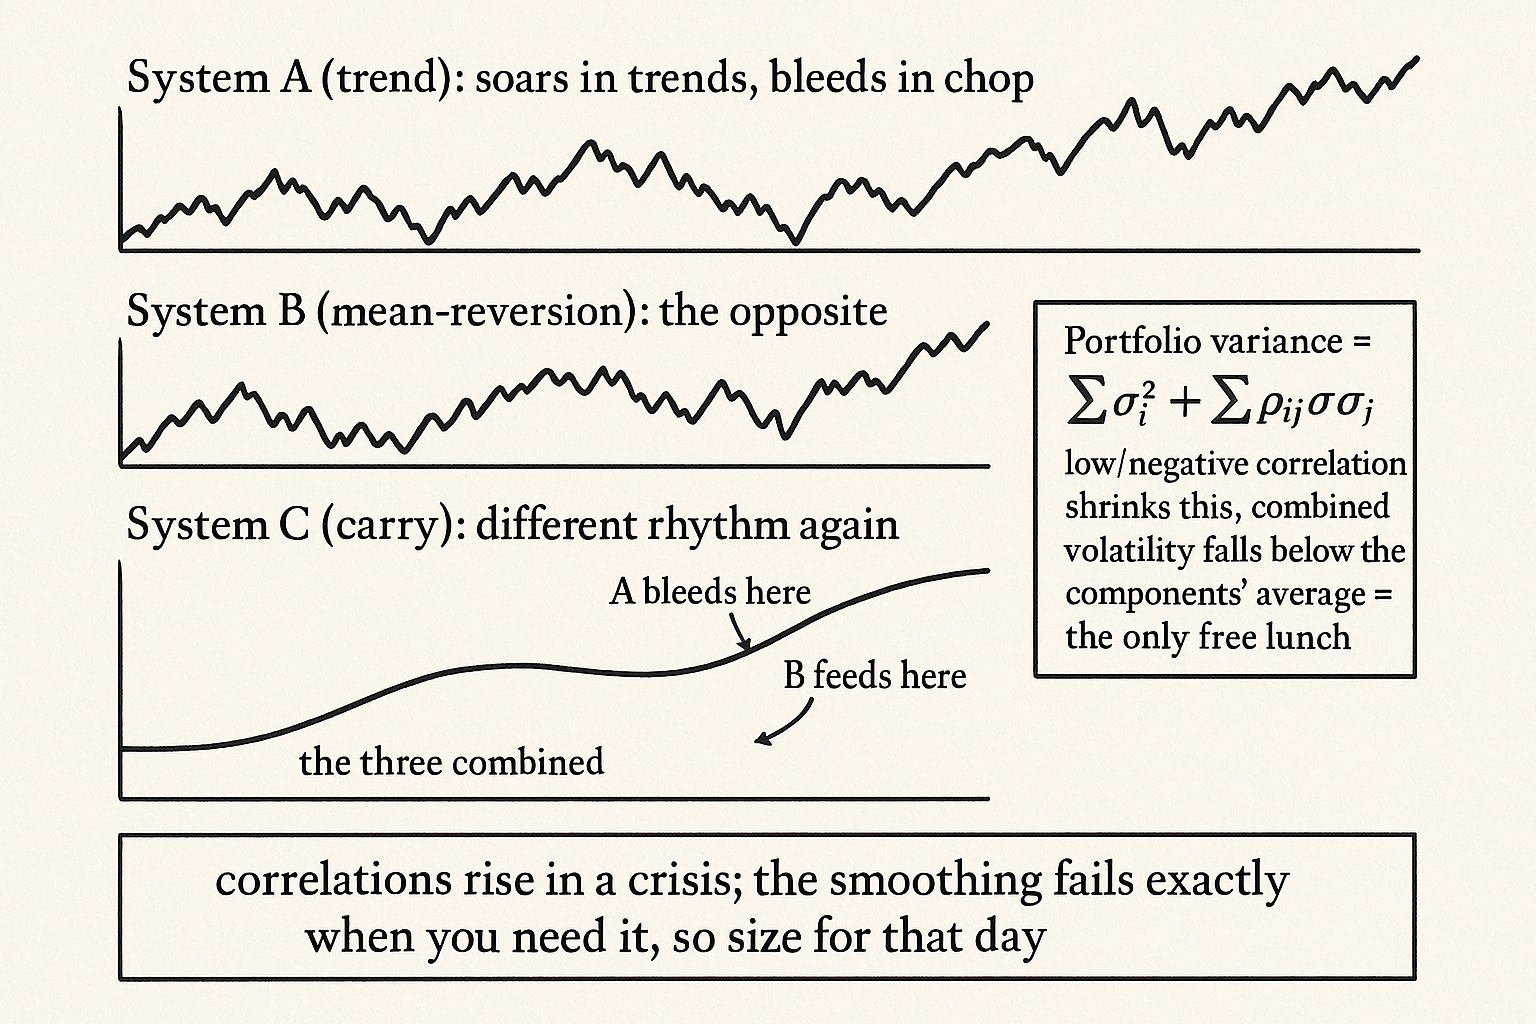
A standalone trading system has a jagged equity curve because its edge depends on a particular kind of market, and markets cycle through conditions that suit it and conditions that punish it. A trend follower soars in trending regimes and bleeds in chop. A mean-reverter does the reverse. Each one, run alone, delivers stretches of gains broken by drawdowns that can last quarters or years, and no amount of parameter tuning removes the drawdowns, because the drawdowns are the system being out of its favorable regime, not a flaw you can optimize away. Chasing a single smooth curve is chasing a system with no unfavorable regime, which is a system that does not exist.
The drawdowns of a single system are also the thing most likely to make you quit it, and quitting a good system in its drawdown is how traders convert a profitable strategy into a realized loss. The roughness is not just uncomfortable; it is the behavioral trap that "When to Switch Off a Trading System" warns about, because a long drawdown in a standalone system is indistinguishable, in the moment, from a dead one.
Smoothness comes from offsetting drawdowns
The fix is to run several systems whose drawdowns do not coincide. When the trend follower is bleeding in a chop, the mean-reverter is feeding, and the combined equity curve barely notices the chop because one system's loss is filled by the other's gain. Stack enough genuinely different systems, different strategies, different markets, different holding periods, and the combined curve smooths out, not because any component improved, but because their rough patches fall in different places and average away.
$$ \sigma_{\text{portfolio}}^2 = \sum_i w_i^2 \sigma_i^2 + \sum_{i \neq j} w_i w_j \, \rho_{ij}\, \sigma_i \sigma_j $$
The portfolio variance has two parts: the sum of each system's own variance and the cross terms that depend on the correlations between systems. The first part you cannot escape; the second is where the smoothing lives. When the correlations are low or negative, the cross terms add little or subtract, so the combined volatility falls well below the average of the individual volatilities. That gap, the combined volatility coming in under the components' average, is the entire benefit of diversification across systems, and it is the only free lunch in trading, available solely to the trader who builds the combination rather than hunting for a single perfect curve.
What it takes to build it
Building a smooth curve is harder than finding a good system, because you need several systems that are each independently worth running and genuinely uncorrelated with each other. Two trend followers on correlated markets are nearly the same system and smooth nothing; their drawdowns coincide and the cross terms stay high. You need real diversity of edge, a trend system and a mean-reversion system and a carry system, across diverse markets, with enough overlapping time in market from "The Hidden Importance of Time in Market" for the offsetting to actually occur. And you need the correlations to be low out of sample, not just in the backtest, which is the catch, because correlations between strategies rise exactly in crises, when several supposedly independent systems all draw down together as liquidity vanishes and everything correlates to one. The smooth curve you built in calm conditions can turn jagged in the one environment where you needed the smoothing most, so you build for diversification and still size for the day the diversification fails.
Visualizing the built curve
KEY POINTS
- The single smooth-equity-curve system does not exist. Smoothness is a property of a combination of rougher systems, so the work is in the portfolio, not in finding a perfect signal.
- Every standalone system is lumpy because its edge depends on a regime, and markets cycle through conditions that suit it and conditions that punish it. The drawdowns are the system being out of favor, not a flaw you can tune away.
- A single system's drawdowns are the behavioral trap that makes traders quit good strategies, because a long drawdown is indistinguishable in the moment from a dead edge.
- Smoothness comes from running systems whose drawdowns do not coincide. When the trend follower bleeds in a chop, the mean-reverter feeds, and the combined curve barely notices.
- Portfolio variance has a cross-term driven by the correlations between systems. Low or negative correlations shrink it, so combined volatility falls below the components' average. That gap is the only free lunch in trading.
- Building it needs several independently worthwhile, genuinely uncorrelated systems with overlapping time in market. Correlations rise in crises, so the smoothing fails when you need it most, and you still size for that day.
References
- Systematic Trading - Robert Carver (Amazon)
- Trading Systems - Urban Jaekle Emilio Tomasini (Amazon)
- Deviations from Mean-Variance Optimization: Behavioral Finance and Investor Performance
- Trading and Investment Strategies in Behavioral Finance
- Volatility spillover among the sectors of emerging and developed
- DRAWDOWN: FROM PRACTICE TO THEORY AND BACK AGAIN
- Trading and Investment Strategies in Behavioral Finance
- Advanced Portfolio Theory: Why Understanding The Math Matters
- A PRIMER FOR INVESTMENT PROFESSIONALS
- Trade Sizing Techniques for Drawdown and Tail Risk Control