6.16 Profit Factor, Expectancy, and the Shape of Returns
Profit factor and expectancy are both blind to the shape of returns. Two systems with the same numbers can be robust or rest entirely on two lucky winners. Read the distribution, not just the summary.
Profit factor and expectancy are the two headline numbers on every system report, and traders treat them as a verdict: high profit factor good, positive expectancy good, ship it. They are useful, and they are both blind to the same thing, which is the shape of the returns that produced them. Two systems with identical profit factor and identical expectancy can have completely different survival odds, because one earns its number from many balanced trades and the other from a handful of monster winners that may never repeat. "Expectancy: The Most Important Formula in Trading" gave you the average; this is about why the average hides the distribution that actually kills or saves you.
Profit factor, and how it relates to expectancy
$$ \text{PF} = \frac{\text{gross profit}}{\text{gross loss}} = \frac{P_{\text{win}} \times \text{avg win}}{P_{\text{loss}} \times \text{avg loss}} $$
Profit factor is the total money won divided by the total money lost, the sum of all winners over the absolute sum of all losers. A profit factor above 1 means you made more than you lost; below 1 means you bled. It is the same ingredients as expectancy, win rate and the payoff sizes, arranged as a ratio instead of a difference. Expectancy tells you the average dollars per trade; profit factor tells you how many dollars you earn per dollar you lose. A profit factor of 1.5 means every dollar of losses bought you a dollar fifty of gains, which is a workable but not generous edge; values comfortably above that are strong, and values clinging just above 1 are fragile, because a small deterioration tips them under water.
The two numbers are different views of one edge, and neither shows you the shape. Both collapse the entire return distribution into a single statistic, and a single statistic cannot distinguish a smooth stream of moderate results from a jagged one dominated by outliers.
Same numbers, different shape, different survival
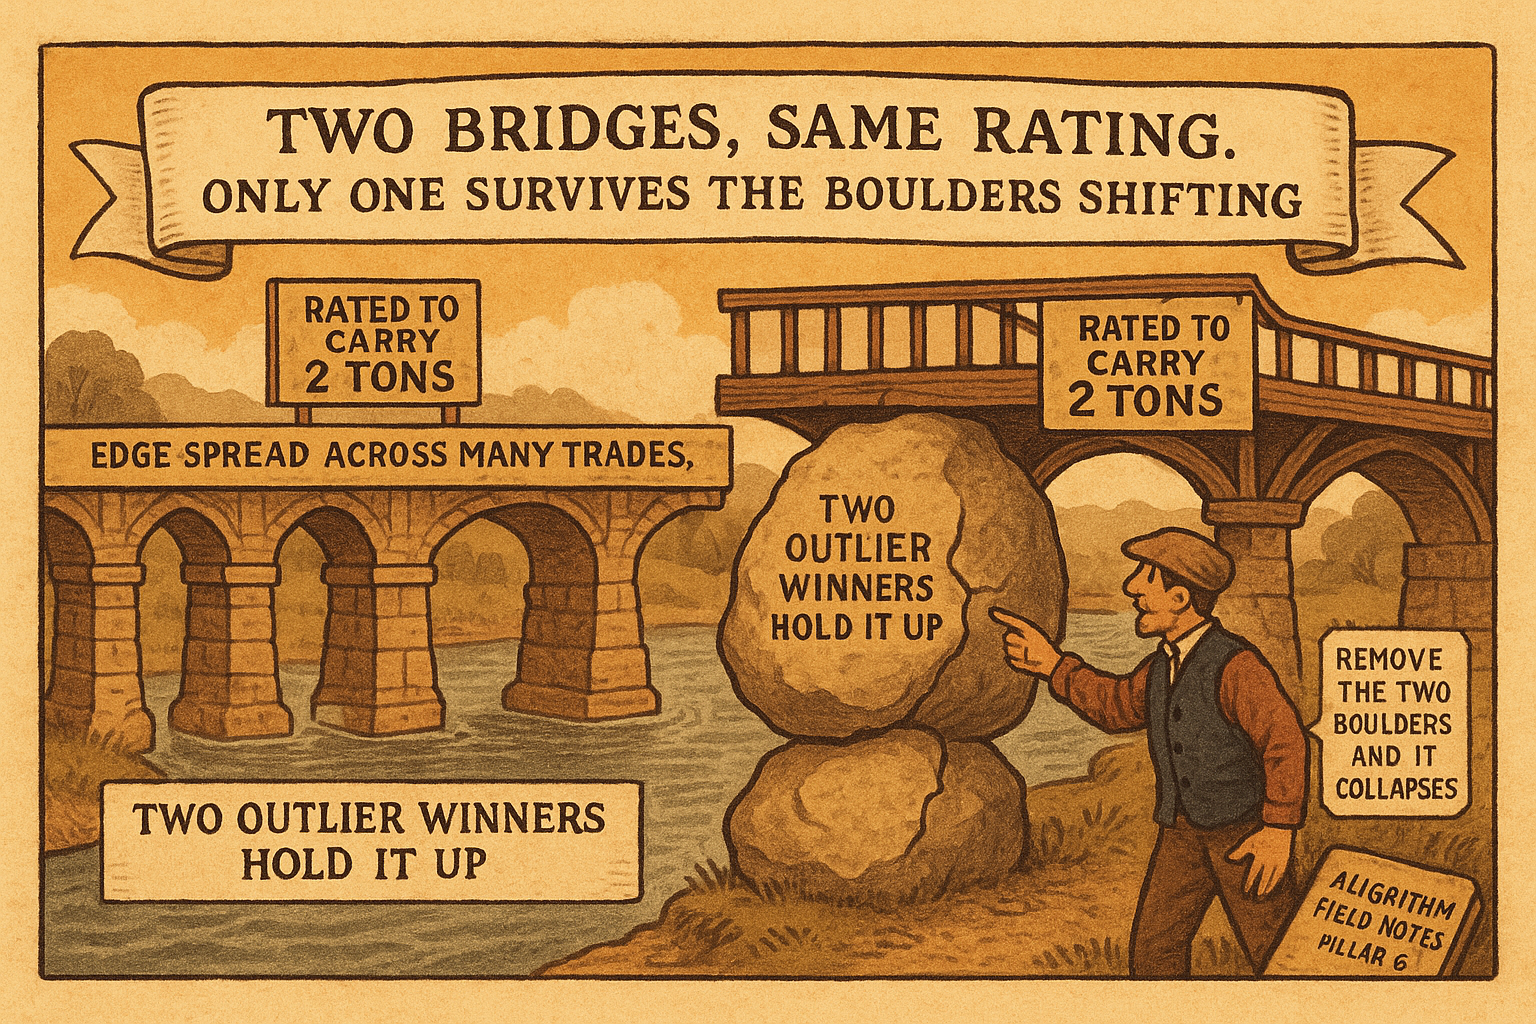
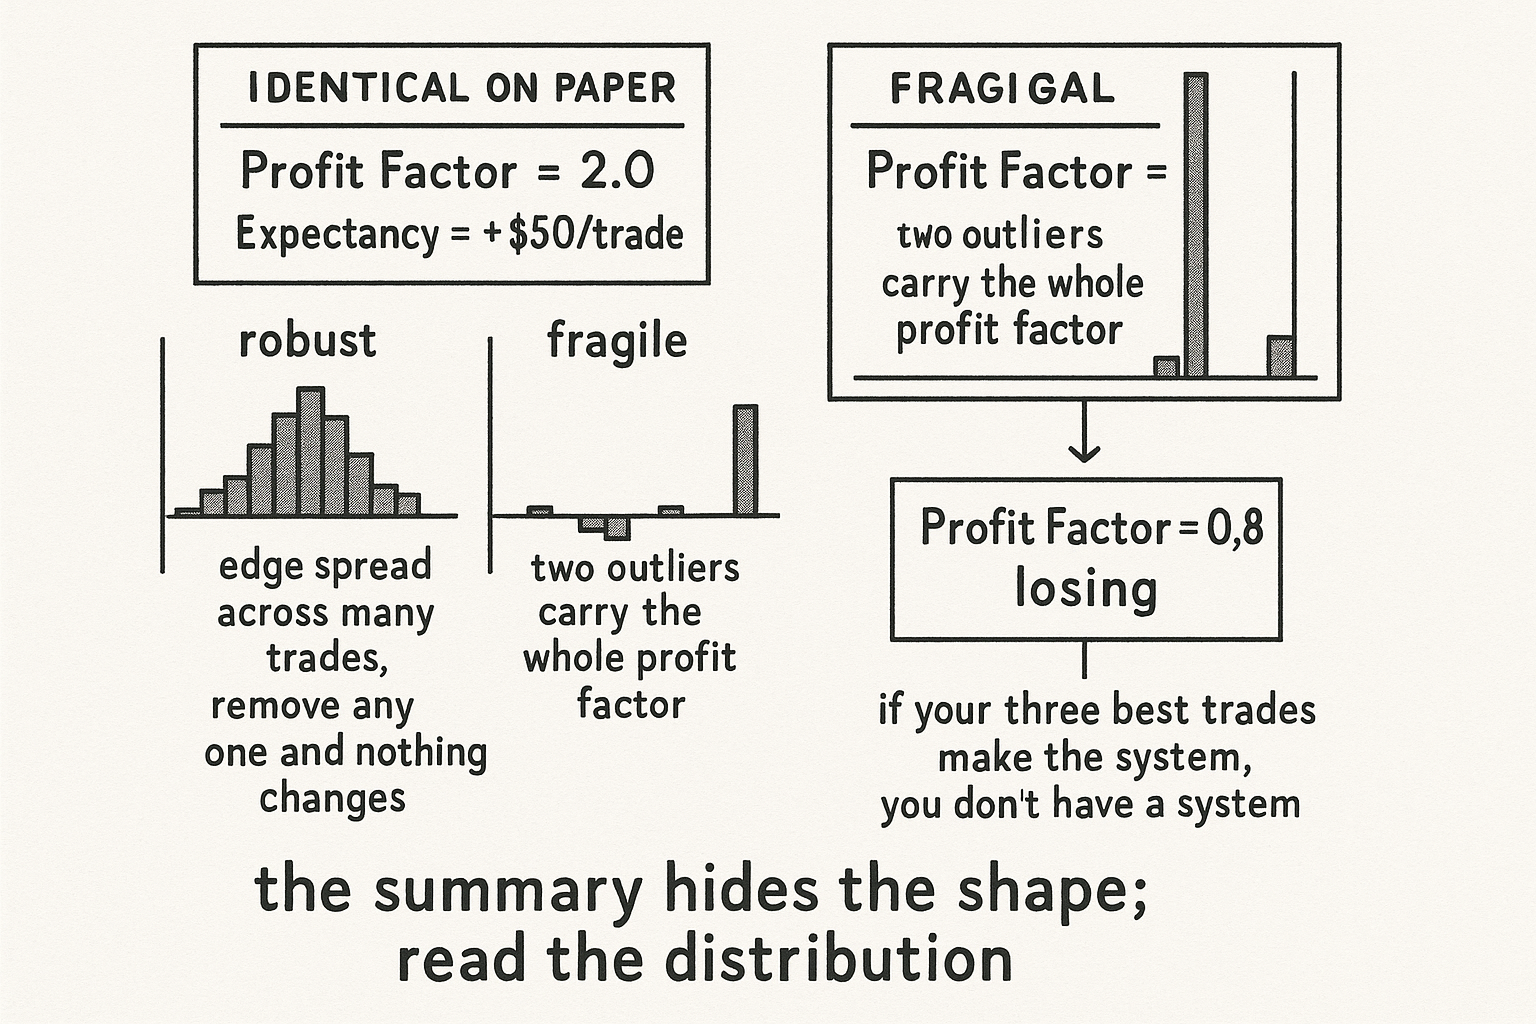
Picture two systems, both with a profit factor of 2 and the same expectancy. System A earns it from a steady distribution: most winners cluster around the average, most losers around the average, and no single trade dominates the total. System B earns the identical profit factor from a lumpy distribution: a long tail of small losses and two enormous winners that, between them, account for most of the gross profit. On the report they look the same. In reality they are not remotely the same bet.
System A is robust, because its edge is spread across many trades and the law of large numbers is working for you; remove any single trade and the numbers barely move. System B is fragile, because its entire edge rests on two outliers, and if those two trades were luck, a perfect entry that will not recur, a gap that happened to go your way, the real expectancy going forward is near zero or negative. The profit factor of 2 is real in the backtest and meaningless out of sample, because it was never an edge, it was two lottery tickets that hit. The shape is the difference between a system you can size with confidence and one that will betray you the moment the outliers stop arriving.
Read the distribution, not just the summary
The defense is to look past the two headline numbers at the distribution that made them. Plot the trade returns and check whether the profit is broad-based or concentrated. Compute how much of the gross profit comes from the top few trades; if removing your three best winners turns a great system into a losing one, you do not have a system, you have three winners and a lot of noise. Check the loss tail the same way, because a profit factor built on a quiet loss distribution that has never yet seen its worst day is overstating your edge until that day arrives. This connects to "Average Drawdown vs Extreme Drawdown": the shape of the trade distribution and the shape of the drawdown distribution are the same information, and both warn you when a summary statistic is resting on a tail you cannot count on. Use profit factor and expectancy to size up the edge, and use the shape to decide whether the edge is real enough to trust.
Visualizing the shape
KEY POINTS
- Profit factor is gross profit divided by gross loss, the dollars won per dollar lost. Above 1 you made money; around 1.5 is workable; comfortably higher is strong; just above 1 is fragile.
- Profit factor and expectancy use the same ingredients arranged differently, a ratio versus a difference. Both collapse the whole return distribution into one number and are blind to its shape.
- Two systems with identical profit factor and expectancy can have opposite survival odds. One earns its number from many balanced trades; the other from a few monster winners.
- The broad-based system is robust: remove any single trade and the numbers barely move. The outlier-driven system is fragile: its edge rests on a handful of trades that may have been luck.
- A profit factor built on two outliers is real in the backtest and meaningless out of sample. If removing your three best winners turns the system into a loser, you have three winners and noise, not a system.
- Read the distribution behind the summary. Check how much profit comes from the top few trades, inspect the loss tail, and remember the trade-shape and drawdown-shape are the same warning.
References
- Systematic Trading - Robert Carver (Amazon)
- Trading Systems - Urban Jaekle Emilio Tomasini (Amazon)
- FactorEngine: A Program-level Knowledge-Infused Factor Mining
- Signature Decomposition Method Applying to Pair Trading - arXiv
- Chapter 27: Trading and Investment Strategies in Behavioral Finance
- Unlocking Stock Market Success: Why You Should Embrace the Skew
- AlphaCrafter: A Full-Stack Multi-Agent Framework for Cross ... - arXiv
- A novel approach to trading strategy parameter optimization, using
- Trading and Investment Strategies in Behavioral Finance
- Underreaction to Bad News, Costly Arbitrage and Equity Returns