6.7 From Indicator Value to Expected Value
An indicator's scale knows nothing about money. Calibrate the reading to the risk-adjusted return that historically followed it, scale it to a common target, and size on that, not the raw output.
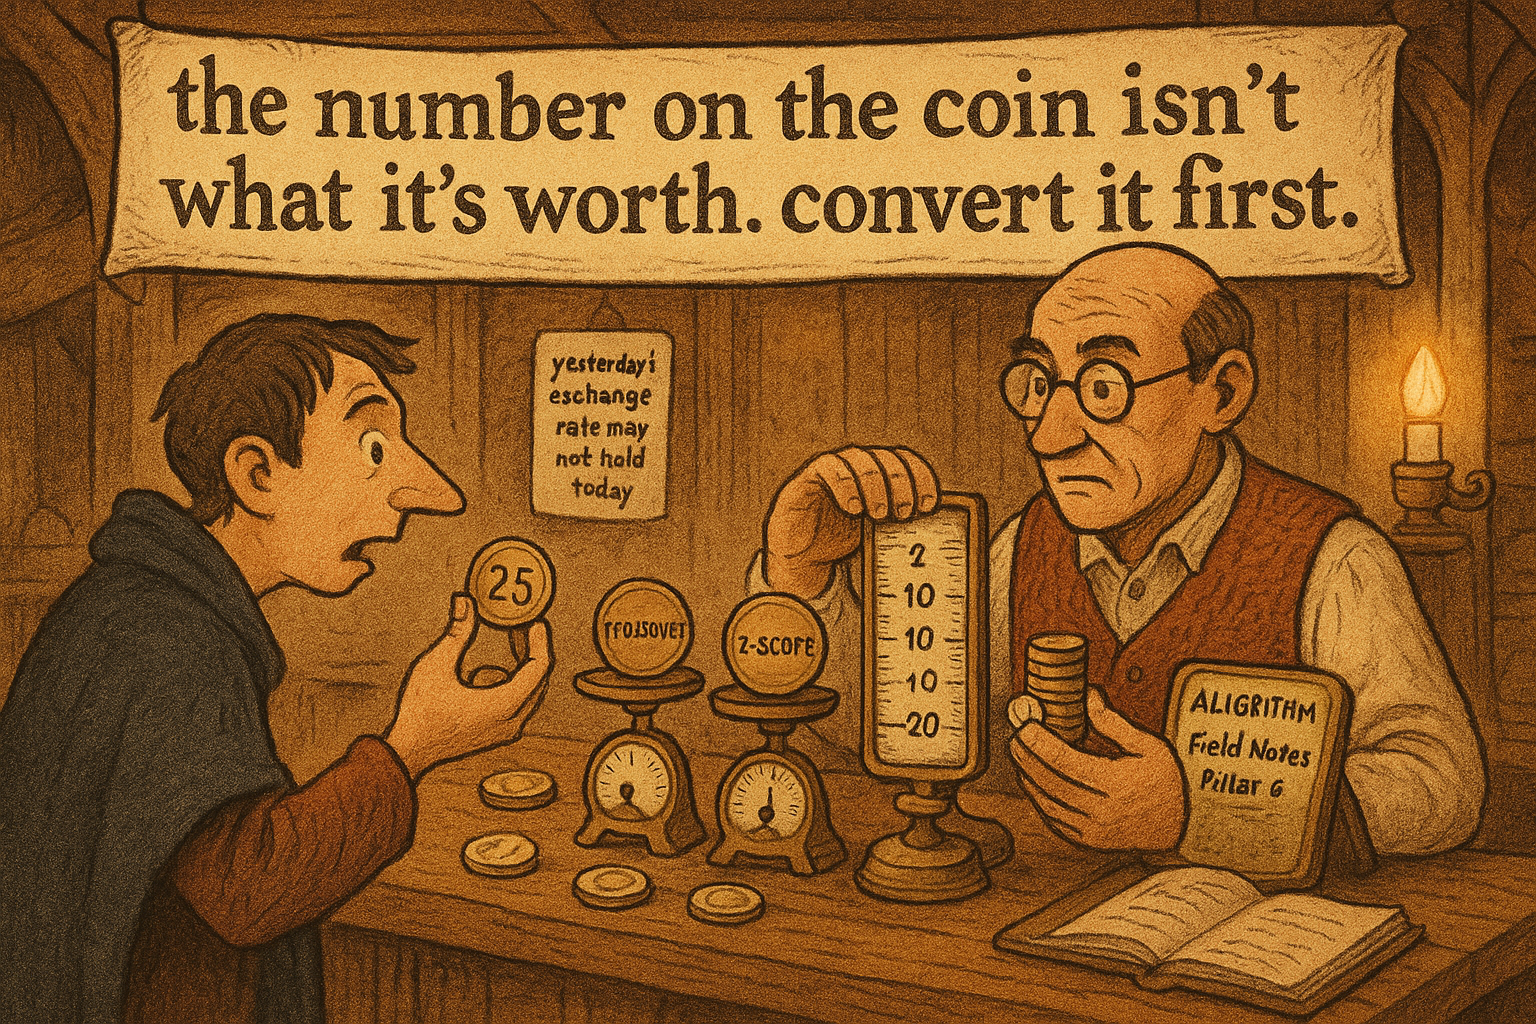
An indicator outputs a number. A position needs a different number. The gap between them is where most systems quietly break, because traders take the raw output of an RSI or a moving-average crossover and shove it straight into a position size, as if an RSI of 70 told them how much to bet. It does not. The indicator value is a reading on a scale nobody calibrated against money; the expected value is what that reading is worth in risk-adjusted return. Turning one into the other is a real step, and skipping it means your position sizes are an accident of whatever scale the indicator happened to use.
This is the translation layer underneath "Why Volatility-Adjusted Position Sizing Matters": before you size a forecast, you have to make the forecast mean something.
The indicator scale is arbitrary
Every indicator carries a scale that came from its construction, not from any relationship to returns. RSI lives between 0 and 100 because of how it normalizes gains against losses. A moving-average crossover outputs a price difference in whatever units the instrument trades. A z-score lives in standard deviations. None of these scales knows anything about how much money the signal predicts, so a "strong" reading on one indicator and a "strong" reading on another are strong in different, incomparable currencies. Feed the raw value into a position and you are letting the indicator's internal arithmetic decide your bet size, which is arbitrary.
Calibrate the reading against realized returns
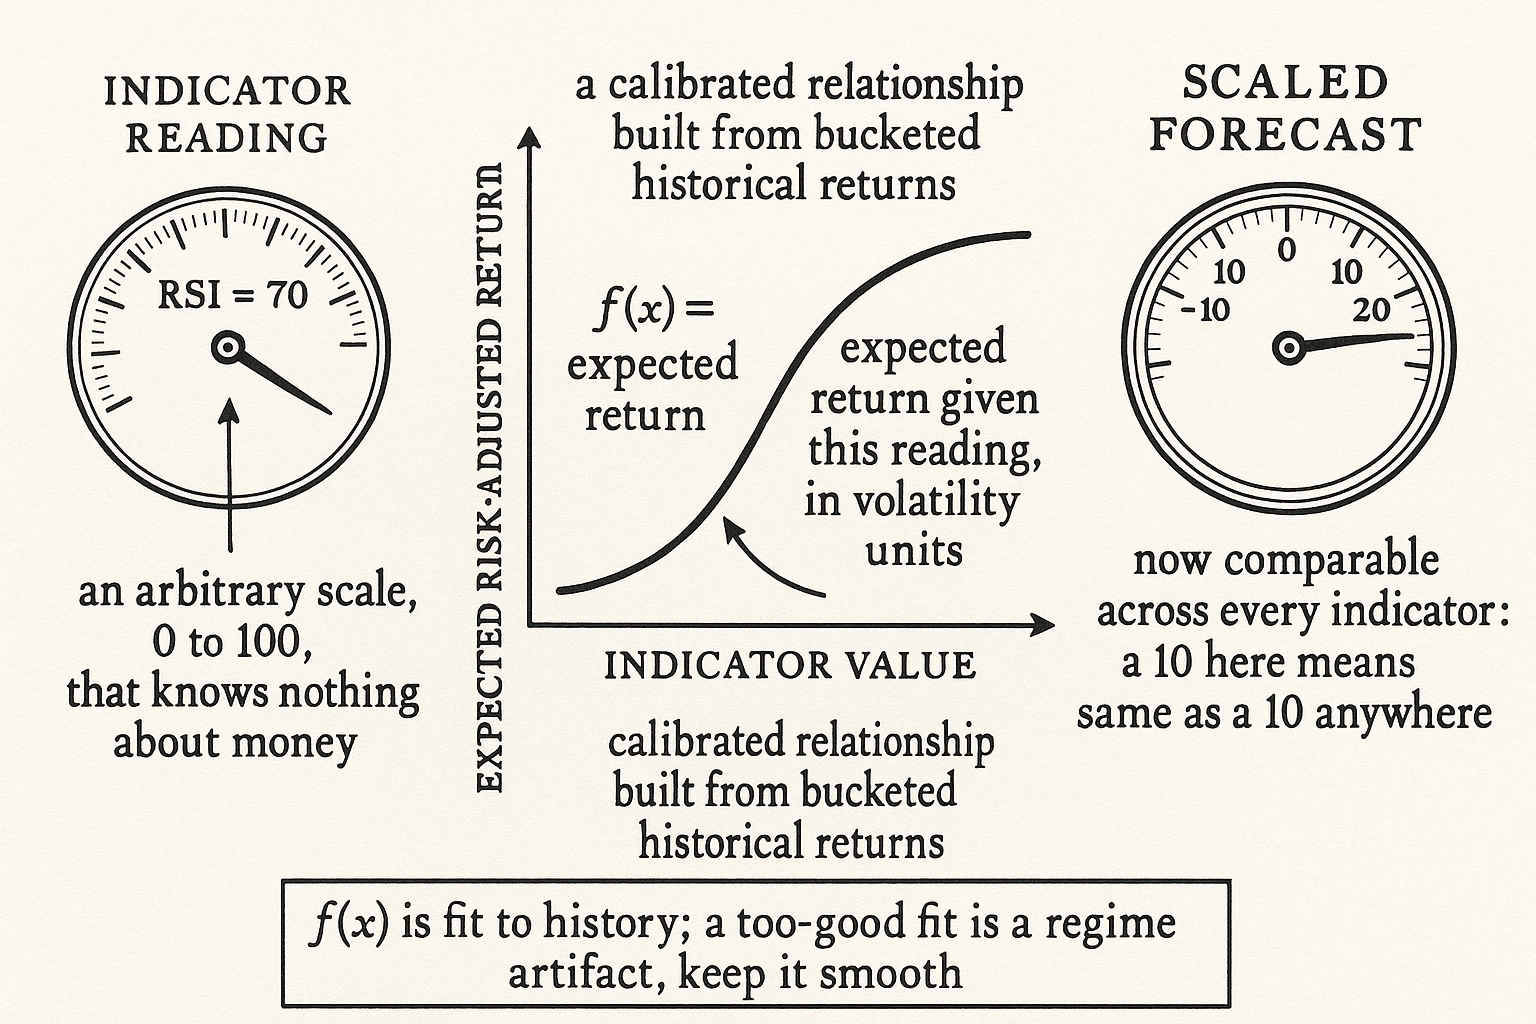
The fix is to map the indicator value to the expected risk-adjusted return that historically followed it. You bucket the indicator's range, measure the forward return in each bucket, express it in volatility units so it is comparable across instruments, and build the mapping from indicator reading to expected risk-adjusted return.
$$ f(x) = \frac{\mathbb{E}[\,\text{return} \mid \text{indicator} = x\,]}{\sigma} $$
The calibrated forecast is the expected return conditional on the indicator reading, divided by volatility to put it in risk-adjusted units. This is the number you size on, not the raw reading. It answers the question the indicator never did: given this reading, how much return per unit of risk do I actually expect? An RSI of 30 and an RSI of 70 might map to expected values of opposite sign and unequal magnitude, and the mapping, not the 30 and 70, is what drives the position.
Scale it to a common target
Once you have an expected value, normalize every signal to a common scale so different indicators can be combined and compared. A disciplined forecast framework standardizes each forecast to a target average absolute value, around 10 on a scale where 20 is a strong conviction, by scaling the calibrated forecast by whatever constant brings its long-run average magnitude to that target. After this step, a 10 from the RSI system and a 10 from the crossover system mean the same thing, an average-strength bet, and they can be averaged into a combined forecast with sensible weights. Without the common scale, combining indicators is adding apples to furlongs, and the loudest-scaled indicator silently dominates the blend.
The honest caveat: the mapping is fit to history, so it inherits every bias of the sample. If the relationship between the indicator and forward returns was a regime artifact, the calibration encodes the artifact and hands you a confident expected value that does not hold out of sample. Estimate the mapping on enough data, keep it smooth rather than letting it chase every bucket's noise, and treat a too-good calibration as a warning, not a prize.
Visualizing the translation
KEY POINTS
- An indicator outputs a number on an arbitrary scale; a position needs a number that means risk-adjusted return. Shoving raw indicator values into position sizes lets the indicator's internal arithmetic decide your bet size.
- Indicator scales come from construction, not from returns. RSI's 0-to-100, a crossover's price units, and a z-score's standard deviations are incomparable currencies, so "strong" on one is not "strong" on another.
- Calibrate by bucketing the indicator's range, measuring forward return in each bucket, and expressing it in volatility units. The mapping from reading to expected risk-adjusted return is what you size on, not the raw value.
- The calibrated forecast is the expected return conditional on the indicator reading, divided by volatility. An RSI of 30 and 70 can map to expected values of opposite sign and unequal magnitude.
- Normalize every calibrated forecast to a common target scale, around 10 average with 20 as strong conviction, so different indicators combine sensibly. Without it, the loudest-scaled indicator dominates the blend.
- The mapping is fit to history and inherits its biases. Use enough data, keep the mapping smooth instead of chasing bucket noise, and treat a too-good calibration as a warning of a regime artifact.
References
- Systematic Trading - Robert Carver (Amazon)
- Trading Systems - Urban Jaekle Emilio Tomasini (Amazon)
- Portfolio Structuring and the Value of Forecasting
- When Do Systematic Strategies Decay?
- FACTOR INVESTING AND ASSET ALLOCATION
- Investigating the profit performance of quantitative timing trading
- Alpha Decay and Institutional Trading
- FACTOR INVESTING AND ASSET ALLOCATION
- Sustainable Investing: Do ESG Risks Shift Market Dynamics?
- Machine Traders, Human Behavior, and Model (Mis)Specification