6.10 How to Build a Cost-Aware RSI Ranking System
RSI as a 70/30 trigger is noise. Z-score it cross-sectionally, check the shape, rank and risk-size the extremes, then buffer the turnover. The four-step pipeline works for any indicator.
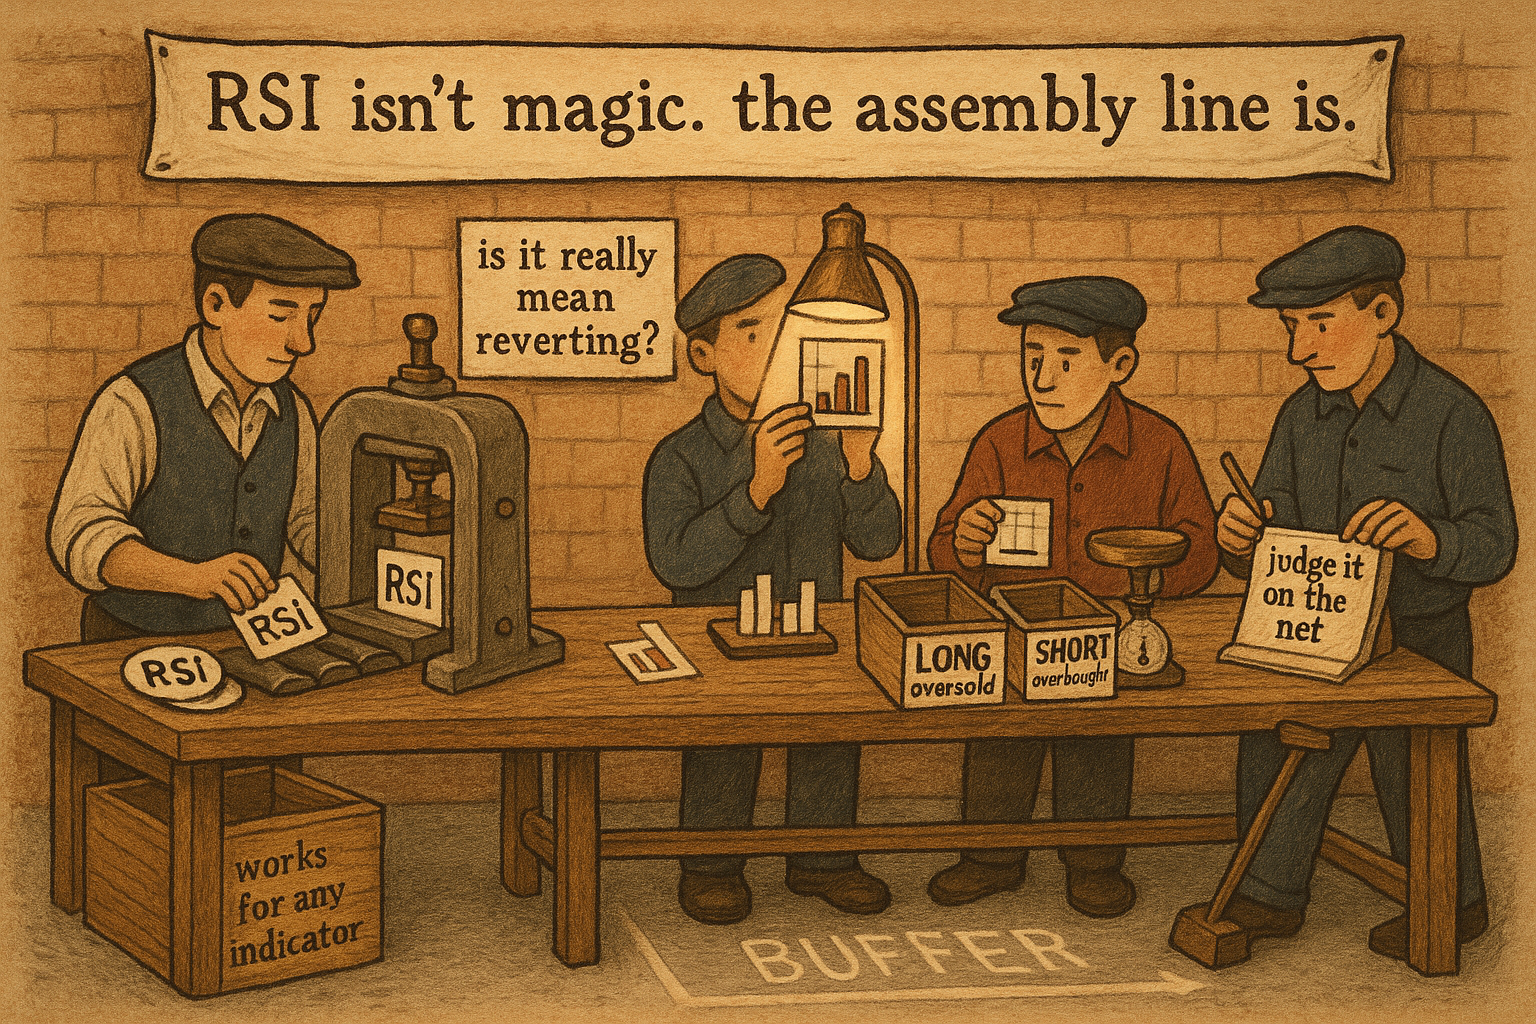
RSI is the most abused indicator in retail trading, drawn on charts with 70 and 30 lines and traded as a binary overbought/oversold trigger that costs people money. Used that way it is noise. Used as a cross-sectional ranking signal, with the cost discipline this pillar has been building, it becomes a workable mean-reversion system. This article assembles the whole pipeline from "Ranking Beats Forecasting for Many Trading Problems" through "The Difference Between Signal Quality and Portfolio Quality" into one concrete build, so the abstract pieces become a thing you could run.
Step one: turn RSI into a cross-sectional score
Compute RSI on every instrument in your universe over a chosen lookback. Do not trade the raw 0-to-100 value, and do not apply the 70/30 lines. Instead, z-score the RSI cross-sectionally each rebalance, as in "Why Z-Scoring Makes Ranking Cleaner", so each instrument's RSI is expressed in standard deviations relative to the universe that day. A name with an RSI far above the cross-sectional average scores high; a name far below scores low. The z-score makes a high-volatility instrument's RSI comparable to a calm one's, and the cross-sectional framing turns an absolute overbought/oversold reading into a relative one, which is the only version that ranks cleanly.
For a mean-reversion system you invert the score: high RSI (recently strong, overbought relative to peers) is the short candidate, low RSI (recently weak, oversold relative to peers) is the long candidate. You are betting the cross-sectional extremes snap back toward the middle.
Step two: check the shape before you trust the direction
Before assuming the relationship is monotone, do the bucket plot from "When an Alpha Metric Is U-Shaped". Slice the universe into deciles of the RSI z-score, measure the forward return in each decile, and look. Mean reversion predicts a downward slope, low RSI z-score leads to high forward return. If instead you see a valley or a hump, the naive long/short is mismapped and you fold the metric before ranking. Skipping this step is how people deploy a ranking system that is confidently long the wrong decile. The plot costs nothing and tells you whether the rest of the build is even pointed the right way.
Step three: rank, slice, and size by risk
Sort the universe by the inverted RSI z-score. Long the bottom slice (most oversold relative to peers), short the top slice (most overbought), with slice width chosen from the logic of the signal, narrow if only the extremes mean-revert, wider if the whole cross-section does. Then size each position by volatility, from "Why Volatility-Adjusted Position Sizing Matters", so the calm and wild names contribute equal risk and the book is genuinely neutral rather than dominated by the loudest instrument.
$$ w_i = \frac{-z_i}{\sum_j |z_j|} \times \frac{\tau}{\sigma_i} $$
The weight on each instrument combines the two ideas: the normalized negative z-score gives the cross-sectional direction and conviction (negative, because we fade the score), and the risk-target-over-volatility term scales by the risk target over the instrument's volatility so each position carries comparable risk. The most oversold, that is, most negative z-score, names get the largest long weights, the most overbought get the largest shorts, and a volatile name gets trimmed relative to a calm one with the same z-score.
Step four: make it cost-aware, then judge it on the net
A raw RSI ranking system rebalances constantly, because RSI is a fast, noisy indicator and the ranking churns every period. Without the cost discipline this whole thing is a turnover machine that pays the spread to chase a mean reversion smaller than the cost. Apply the no-trade buffer from "Cost-Aware Ranking: The Missing Step in Cross-Sectional Strategies" around the slice boundaries so the marginal names stop flickering in and out, and consider slowing the RSI lookback to cut the churn at the source. Then judge the result the way "The Difference Between Signal Quality and Portfolio Quality" demands: report the signal's rank correlation and breadth, and separately the portfolio's Sharpe, drawdown, and turnover after realistic costs. An RSI ranking system that looks great gross and dies net is the default outcome, not the exception, so the cost-adjusted number is the only one that decides whether you trade it.
A blunt caveat on expectations: cross-sectional RSI mean reversion is a real but thin edge, crowded and cost-sensitive, and the honest version of this build often clears costs by a modest margin or not at all depending on the universe. The value of the pipeline is not that RSI is special; it is that the same four steps, score, check the shape, rank and risk-size, control costs, apply to any indicator you want to turn into a cross-sectional system.
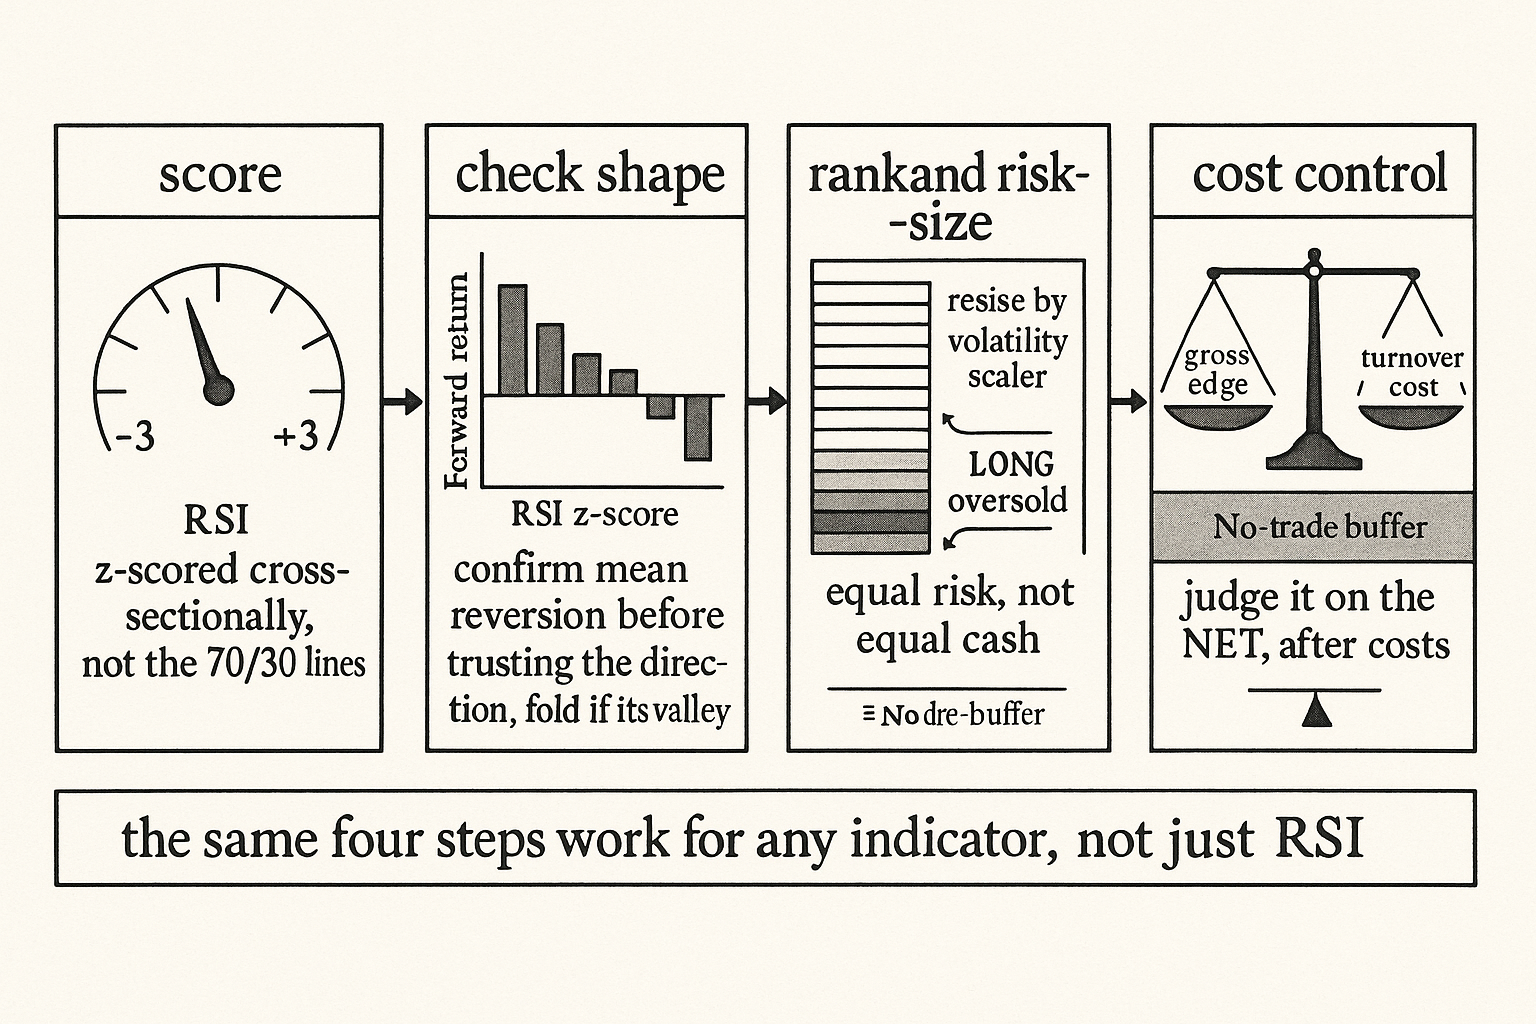
Visualizing the pipeline
KEY POINTS
- RSI as a 70/30 binary trigger is noise. As a cross-sectional ranking signal with cost discipline it becomes a workable mean-reversion system.
- Step one: compute RSI per instrument, then z-score it cross-sectionally each rebalance so readings are comparable across volatile and calm names. Invert it for mean reversion: low RSI is the long candidate, high RSI the short.
- Step two: bucket the universe into deciles of the RSI z-score and plot forward return per decile. Confirm the downward mean-reversion slope before trusting the direction, and fold the metric if you see a valley or hump.
- Step three: sort by the inverted score, long the oversold slice, short the overbought slice, and size every position by volatility so each contributes equal risk. The weight combines normalized negative z-score with a volatility scaler.
- Step four: apply a no-trade buffer around the slice boundaries and consider a slower RSI lookback, because raw RSI ranking churns and pays the spread to chase a tiny mean reversion.
- Judge the system on net performance after realistic costs, reporting signal rank correlation and breadth separately from portfolio Sharpe and turnover. Looking great gross and dying net is the default outcome. The four-step pipeline generalizes to any indicator.
References
- Systematic Trading - Robert Carver (Amazon)
- Trading Systems - Urban Jaekle Emilio Tomasini (Amazon)
- Optimal Portfolio Strategy to Control Maximum Drawdown
- Behavioral Finance: Theories and Evidence
- Spurious Predictability in Financial Machine Learning - arXiv
- Trade Sizing Techniques for Drawdown and Tail Risk Control
- What is Behavioral Finance? by Victor Ricciardi, Helen K. Simon
- Towards Multi-agent Financial System via Simulated Trading - arXiv
- FactorEngine: A Program-level Knowledge-Infused Factor Mining
- Trading and Investment Strategies in Behavioral Finance