6.36 Anomalous Diffusion in Financial Markets
If prices were random they'd diffuse like ink, spreading as the square root of time. Markets diffuse anomalously: faster trending, slower reverting. That exponent is the variance ratio in physics.
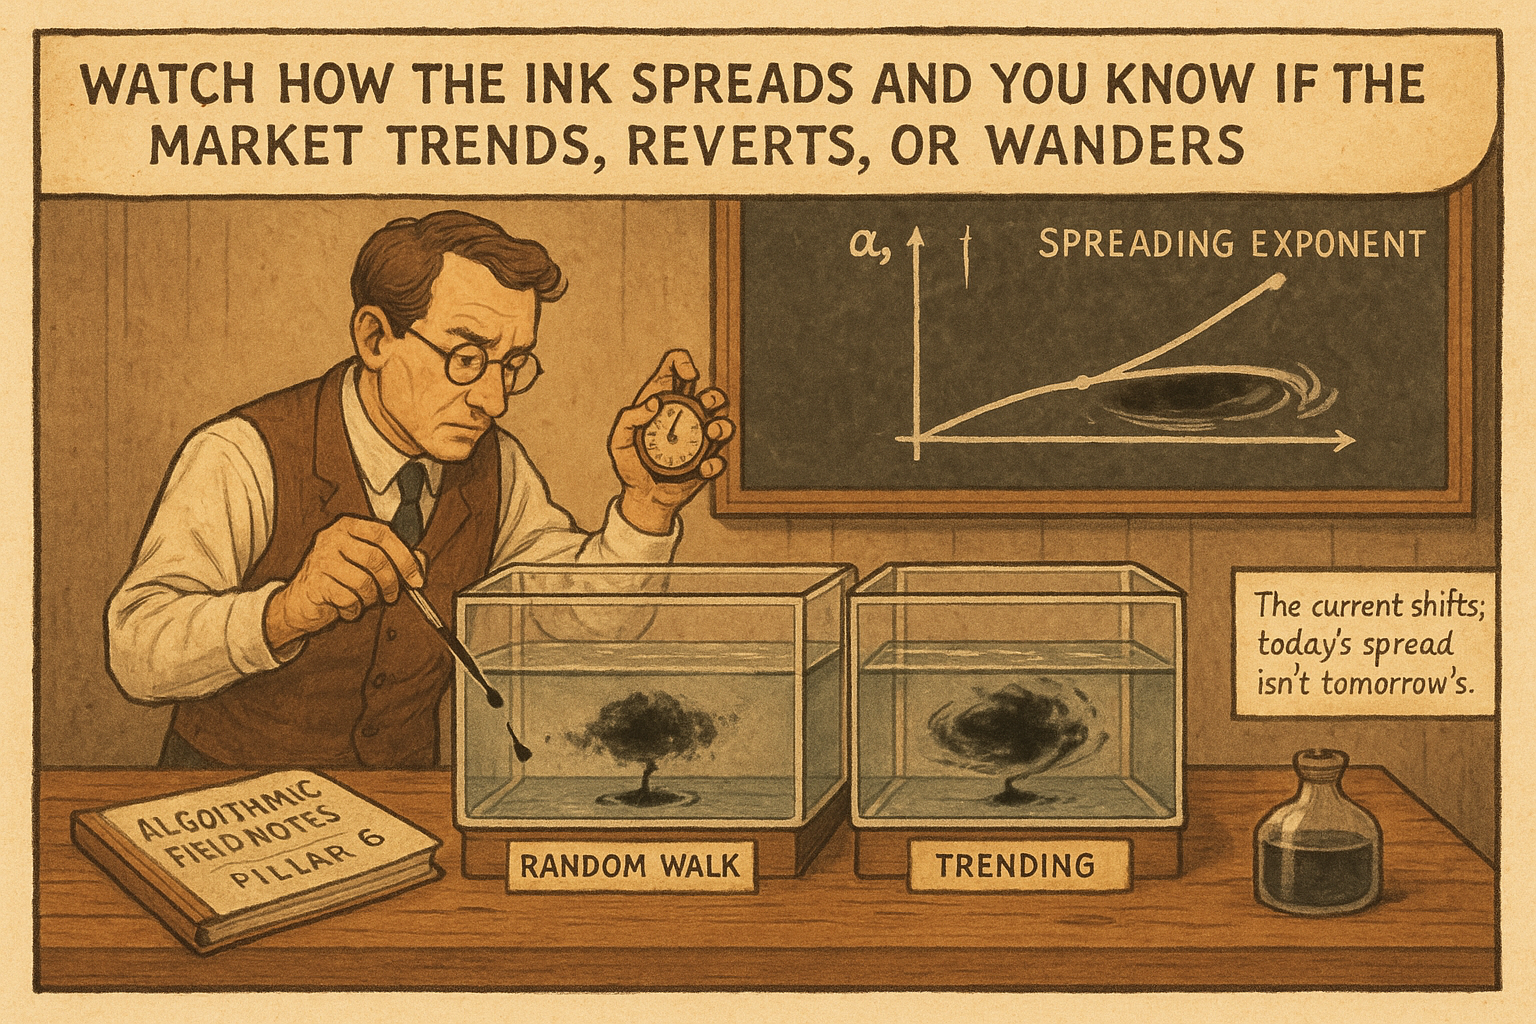
A drop of ink in still water spreads at a predictable rate, the cloud's width growing as the square root of time. That is normal diffusion, the physics of a random walk, and if prices were a true random walk they would diffuse the same way, with their spread growing as the square root of time and their variance growing linearly. They do not, quite. Markets exhibit anomalous diffusion, where the spread grows faster or slower than the square-root law, and that anomaly is the same trending-or-reverting structure the variance ratio measures, seen through the lens of physics. "Variance Ratio Tests for Traders" gave you the statistical version; this is the physical picture, which makes the structure intuitive and connects it to the fat tails and long-range correlations of the surrounding articles.
Normal diffusion and its signature
Watch any quantity driven by independent random kicks, a pollen grain in water, a drunkard's walk, a true random-walk price, and it spreads according to one law: the typical distance from the start grows as the square root of elapsed time. Double the time and the spread grows by the square root of two, not by two, because the random kicks partly cancel. This is the physical meaning of the random walk's linear variance growth, since variance is the square of the spread, and it is the benchmark against which markets are measured.
$$ \langle x^2(t) \rangle \sim t^{\alpha} $$
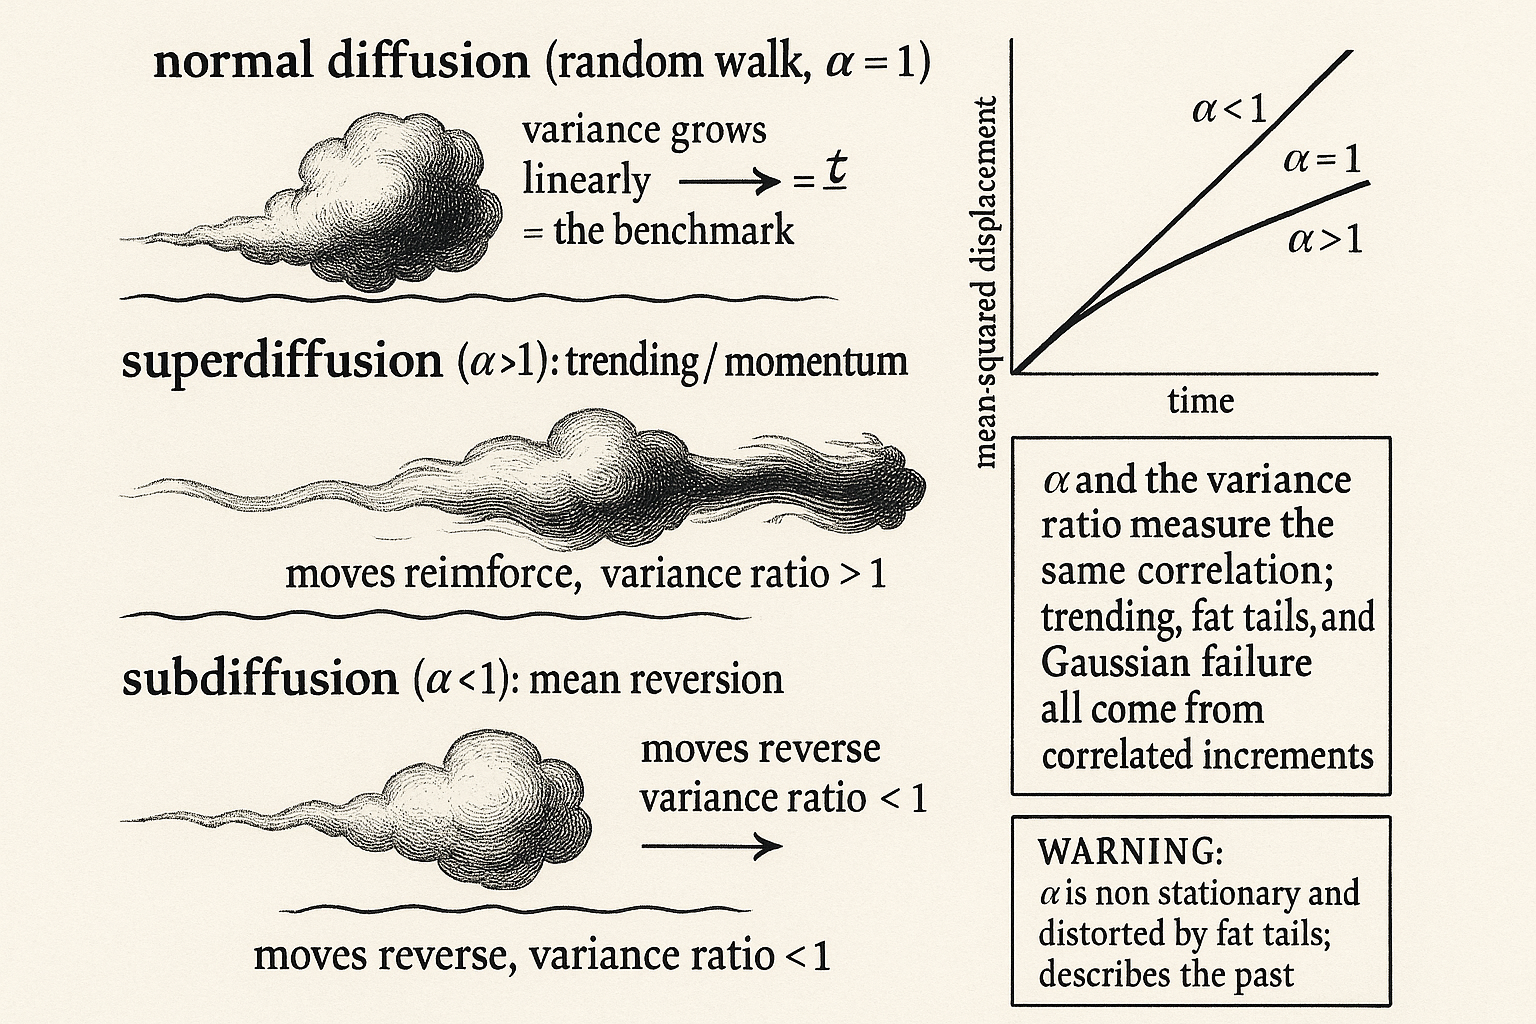
The general law for how a system spreads is that the mean-squared displacement grows as time raised to a power, call it alpha. Normal diffusion, the random walk, has alpha equal to 1: variance grows linearly with time. Anomalous diffusion is any alpha other than 1. When alpha is above 1 the system spreads faster than a random walk, called superdiffusion, and when alpha is below 1 it spreads slower, called subdiffusion. The single exponent alpha captures the entire departure from randomness, and measuring it on a price series tells you which regime the market is in.
Superdiffusion is trending, subdiffusion is reverting
The two anomalous regimes map directly onto the trading concepts from earlier in this pillar. Superdiffusion, spreading faster than the square-root law with alpha above 1, happens when successive price changes are positively correlated, when moves reinforce each other so the price travels farther than independent kicks would carry it. That is trending, the physical face of momentum, and it is the same thing the variance ratio reports as a value above 1. The ink, in this analogy, is being carried by a current, not just diffusing, so it spreads downstream faster than random mixing alone.
Subdiffusion, spreading slower than the square-root law with alpha below 1, happens when successive changes are negatively correlated, when moves partly reverse so the price stays closer to where it started than independent kicks would leave it. That is mean reversion, the physical face of the kind of signal the RSI ranking system harvests, and the variance ratio reports it as a value below 1. The ink is being pulled back toward its origin, held near the center by a restoring force, so it spreads less than random. The diffusion exponent and the variance ratio are two names for the same measurement, one from physics and one from statistics, and they agree because they describe the same underlying correlation in the increments.
Why the physical picture is worth having
The diffusion framing buys intuition and connection, not a separate strategy. Its value is that it places the trending-and-reverting structure inside a larger physics of markets that explains the other phenomena in this run. Anomalous diffusion arises from correlations in the price increments, and those same long-range correlations are the constraints that, through the maximum-entropy argument of "Entropy as a Market Concept", produce the fat tails of "Fat Tails: Why Gaussian Thinking Breaks Trading Systems". The trending, the fat tails, and the failure of the Gaussian are not separate facts; they are different consequences of the same thing, that price increments are correlated rather than independent, and the diffusion exponent is the cleanest single number that captures the departure from independence.
The caveats carry over unchanged. The diffusion exponent is estimated from a finite sample and is non-stationary, so a market that superdiffuses over one period can revert to normal or subdiffuse over the next, and an exponent measured in-sample is no promise about the future, the same fragility that undermines every signal in this pillar. The exponent is also distorted by the fat tails, because a few extreme moves dominate the mean-squared displacement and can swing the estimate, exactly as they distort the variance ratio. So use the diffusion picture to understand why markets trend and revert and why those facts connect to fat tails, measure the exponent across horizons with appropriate skepticism, and treat it as a description of where structure has lived, not a guarantee of where it will live. The physics makes the structure intuitive; it does not make it permanent.
Visualizing anomalous diffusion
KEY POINTS
- Normal diffusion, the physics of a random walk, spreads as the square root of time, so variance grows linearly. If prices were a true random walk they would diffuse this way.
- Markets show anomalous diffusion: mean-squared displacement grows as time to the power alpha. Normal diffusion is alpha equals 1, and any other value is anomalous.
- Superdiffusion (alpha above 1) spreads faster than random because moves reinforce. That is trending, the physical face of momentum, and the same thing the variance ratio reports above 1.
- Subdiffusion (alpha below 1) spreads slower because moves partly reverse. That is mean reversion, and the variance ratio reports it below 1. The diffusion exponent and the variance ratio are two names for the same measurement.
- The physical picture connects the phenomena: anomalous diffusion comes from correlated increments, and those same long-range correlations produce the fat tails through the maximum-entropy argument. Trending, fat tails, and Gaussian failure share one cause.
- The exponent is estimated from a finite, non-stationary sample and distorted by fat tails, so it describes where structure has lived, not where it will. The physics makes the structure intuitive, not permanent.
References
- Systematic Trading - Robert Carver (Amazon)
- Trading Systems - Urban Jaekle Emilio Tomasini (Amazon)
- The Impact of Volatility Targeting (Digest summary)
- Signature Decomposition Method Applying to Pair Trading - arXiv
- Understanding Behavioral Finance Through Biases and Traits of
- The Value–Momentum Correlation: An Investment Explanation
- The Impact of Volatility Targeting
- Trade Strategy and Execution | CFA Institute
- Journal of Behavioral Finance | Journal | Taylor & Francis Online
- Time-series Momentum Strategies across Equity and Commodity