4.12 Matching Strategy Families to Market Conditions
There is no best system, only systems matched to conditions. Two numbers decide: the efficiency ratio picks the family, volatility sets the size. Route to the right cell and gate as regimes drift.
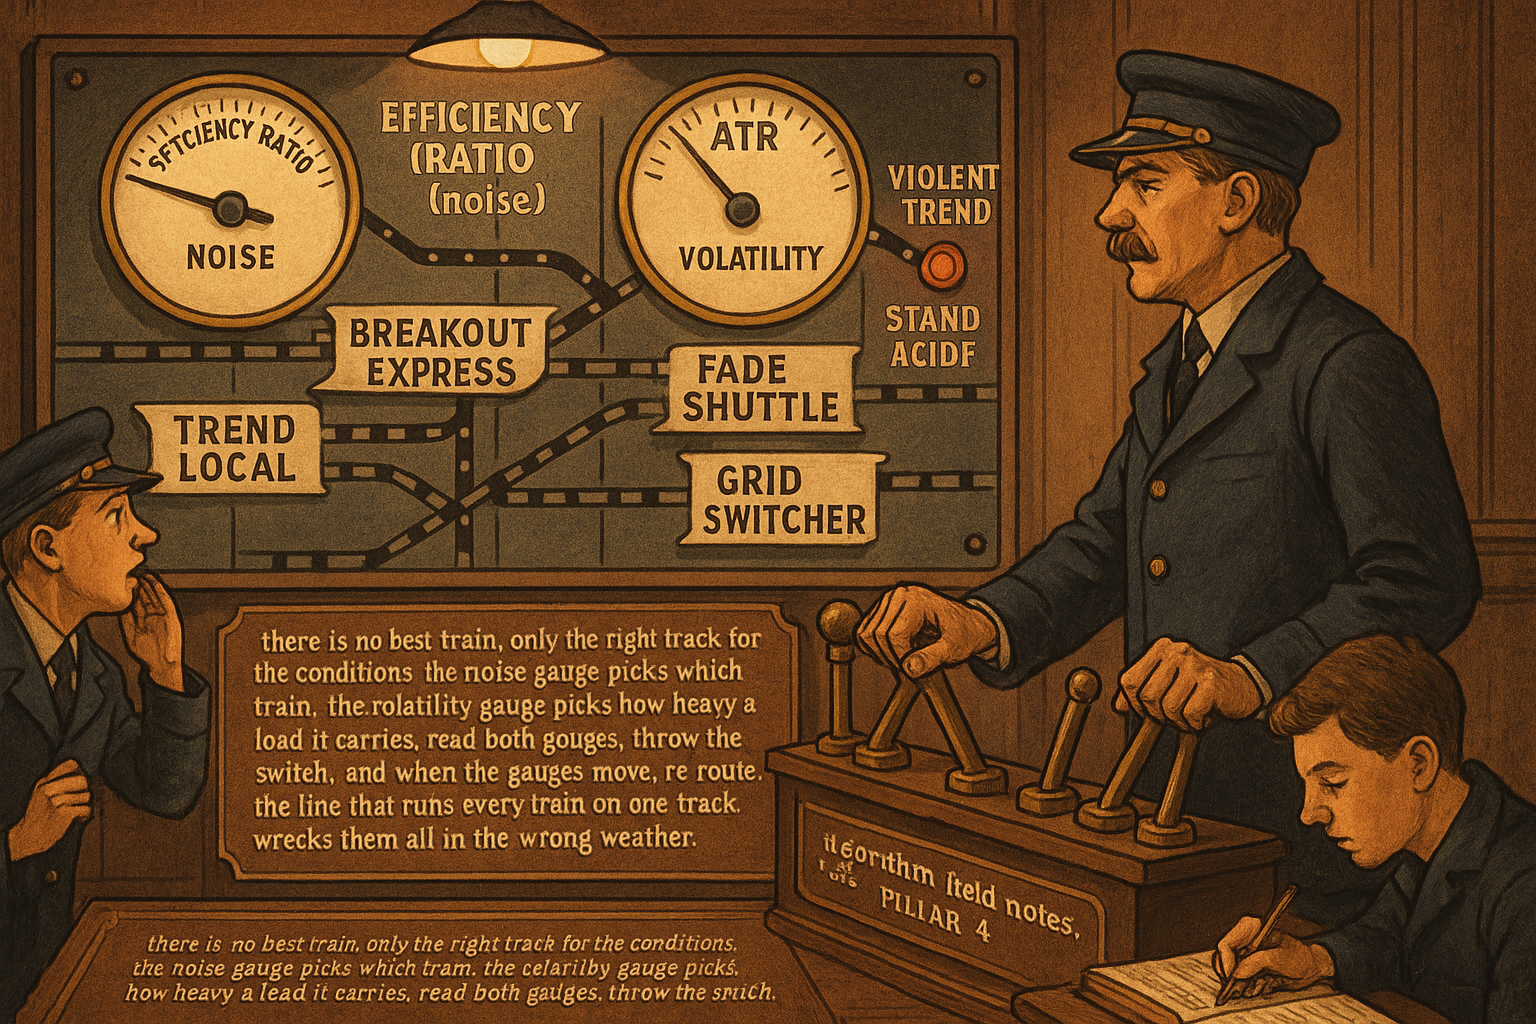
A trader has four working systems: a breakout, a moving-average trend follower, a mean-reversion fade, and a grid. The question is not which one is best. The question is which one to run on which instrument right now, and the answer is a lookup, not a debate. Measure the instrument's efficiency ratio and volatility at the trading horizon, read the regime off a two-axis map, and the map tells you which family belongs there. The breakout and the trend follower go on the low-noise instruments; the fade and the grid go on the high-noise ones; volatility sets the size, not the family. There is no universally best system, only systems matched to conditions, and the matching is mechanical once you measure the right two numbers.
This article assembles the whole Pillar 4 framework into one decision procedure. The preceding articles built the pieces: noise versus volatility, the efficiency ratio, trend-quality ranking, the trend-reversion split, the indicator-portability problem, timeframe selection, price density, the volatility-direction distinction, and the breakout and grid design cases. This article is the map they were all building toward, the operational complement to the article "Market Personality: Why Gold, FX, Crypto, and Equities Need Different Systems" from Pillar 3. Where the personality article matched frameworks to market families by structural character, this one matches them to measured conditions that change over time, so the allocation updates as the market moves.
The two axes that determine the family
Every strategy family has two environmental requirements, and exactly two numbers measure them. The first is noise, measured by the efficiency ratio at the trading horizon, which decides the family. The second is volatility, measured by average true range or its normalized form, which decides the size. The articles in this pillar drove toward this separation: the article "Noise Is Not Volatility" established the two axes are independent, and "The Difference Between Volatility Expansion and Directional Opportunity" showed why conditioning on only one mis-sizes or mis-selects.
Noise selects the family because it determines whether motion continues or reverses, and continuation versus reversal is the fundamental divide between strategy families. Low noise (high efficiency ratio) means continuation, which the trend family (breakout, moving average, momentum) monetizes. High noise (low efficiency ratio) means reversal, which the reversion family (fade, grid, mean-reversion band) monetizes. This is the trend-reversion split from "Low Noise Markets Are Trend-Following Markets" and "High Noise Markets Are Mean-Reversion Markets", and it is the first and largest decision.
Volatility sets the size because it determines how far price moves per unit time, which determines how much capital a fixed risk budget supports. Higher volatility means smaller position for the same risk, the volatility-targeting logic. Volatility does not select the family; a low-noise market is a trend market whether its volatility is high (size down) or low (size up), and a high-noise market is a reversion market at any volatility. Confusing the two axes is the error that runs grids into trends (sizing to volatility, blind to noise) and the error that abandons breakouts in chop (blaming volatility for a noise problem).
The master map
Cross the two axes and place every family in its cell. This is the two-by-two from "Noise Is Not Volatility" populated with the design conclusions from the whole pillar.
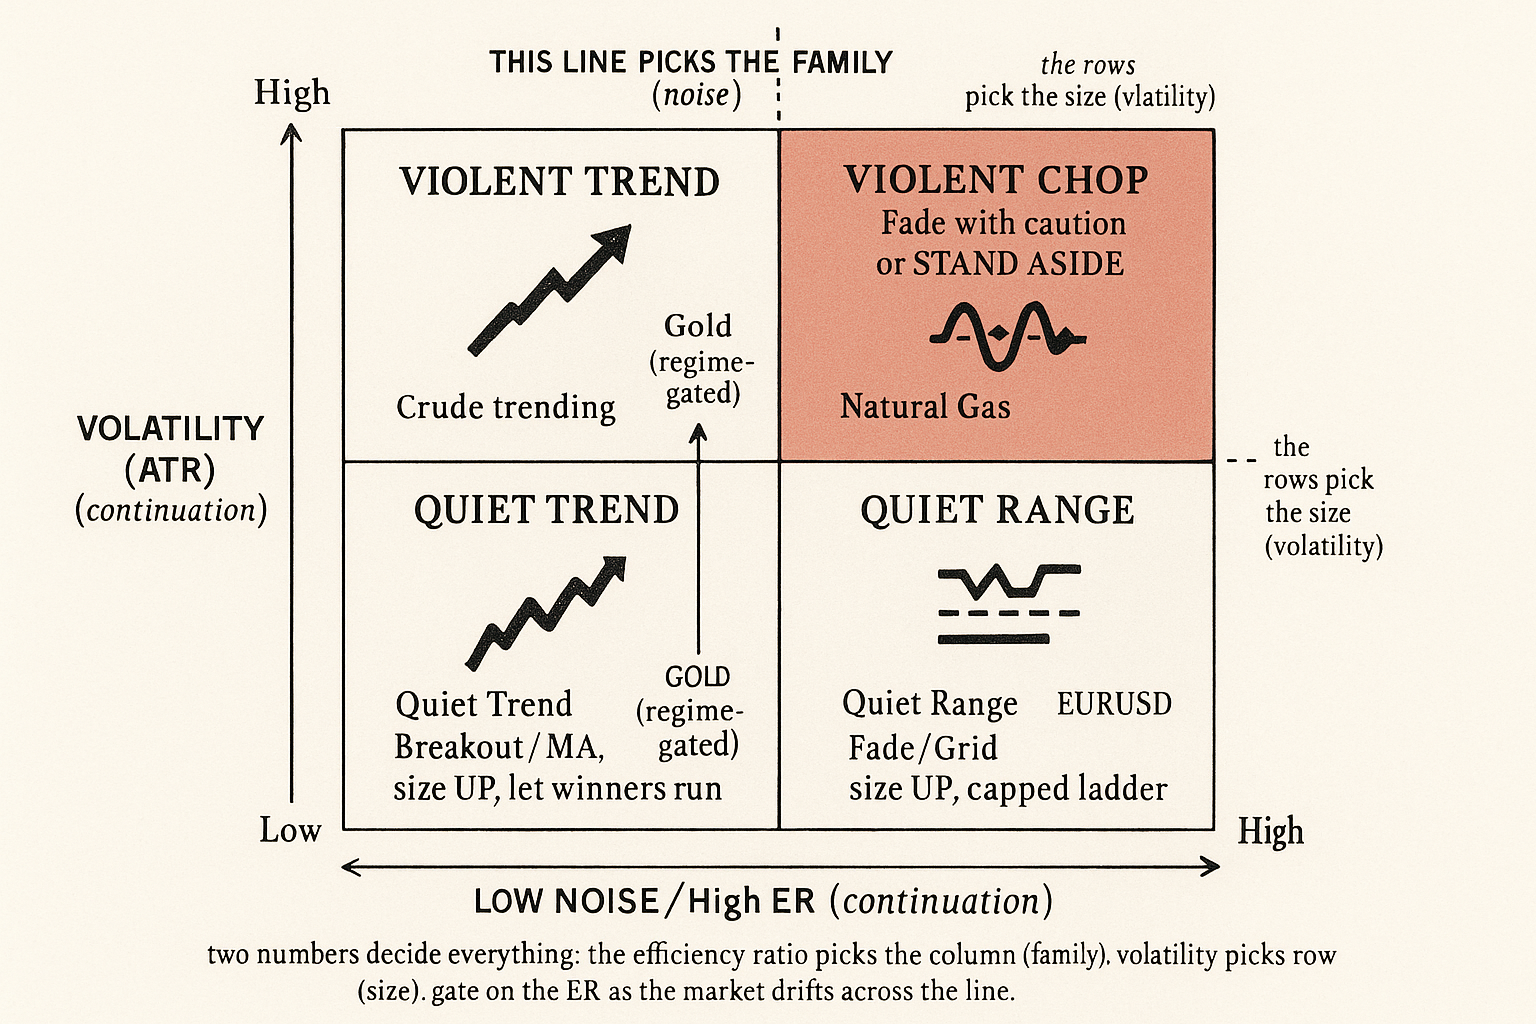
| Low noise (ER high, continuation) | High noise (ER low, reversal) | |
|---|---|---|
| Low volatility | Quiet trend: breakout/MA, size up, let winners run | Quiet range: fade/grid, size up, tight rungs |
| High volatility | Violent trend: breakout/MA, size down, wide MAE stops | Violent chop: fade with caution or stand aside, wide stops |
The columns are the strategy decision, the rows are the size decision. Three of the four cells are clean. The quiet-trend cell is the breakout's best environment from "Why Breakout Systems Need Low Noise Environments". The quiet-range cell is the grid's paradise from "Why Grid Systems Need Noise, Not Just Volatility". The violent-trend cell is the trend follower's high-conviction environment with reduced size. The fourth cell, violent chop, is the most dangerous and the one where the honest answer is often "stand aside", because high volatility with high noise is maximum motion with no directional opportunity, the trap the volatility-direction article isolated. The map's most valuable cell is the one that tells you not to trade.
The procedure, end to end
Six steps, in order, each drawing on a specific article in the pillar.
Step 1: pick the timeframe. From "How to Choose the Right Timeframe for a Strategy", choose the timeframe where the noise constraint, cost constraint, and sample constraint are jointly satisfied for your strategy. The timeframe is upstream of everything because noise is a function of timeframe.
Step 2: measure noise. Compute the efficiency ratio at the chosen horizon, cross-checked with price density from "Price Density: A Visual Way to Measure Market Choppiness". Their agreement confirms the regime; their divergence flags a one-event move or a turbulent trend.
Step 3: measure volatility. Compute the average true range or its normalized form at the same horizon. This sets size, not family.
Step 4: select the family from the column. Low noise, deploy the trend family; high noise, deploy the reversion family; mixed, gate or stand aside. This is the largest decision and it precedes any parameter tuning, the sequencing the article "Optimization Comes After Testing, Not Before" insisted on.
Step 5: size from the row. Scale the position inversely to volatility for risk, then tilt by the efficiency ratio for opportunity (more conviction the further from the mixed band), the two-axis sizing from the volatility-direction article.
Step 6: gate dynamically. Recompute the efficiency ratio on a rolling basis and switch or disable the family when the regime drifts across the column boundary, the defensive gate that appears in every design article in this pillar. The market changes column over time, and the allocation has to follow.
$$ \text{Family} = f(\text{ER}_t), \qquad \text{Size} = \frac{\text{risk budget}}{\text{ATR}_t} \times g(\text{ER}_t) $$
The family is a function of the efficiency ratio alone (the column), while the size is the risk budget divided by volatility (the row) times an opportunity tilt that also depends on the efficiency ratio. Two numbers, the efficiency ratio and the average true range, drive both decisions. Everything else in the pillar is about measuring these two correctly and protecting against their drift.
Why a portfolio of opposite families beats one system
The map also explains why running multiple families is not indecision but diversification of a specific, valuable kind. The trend family and the reversion family are hostile to opposite regimes: trend dies in chop, reversion dies in trend. A portfolio that runs both, each gated to its own regime and each on the instruments that suit it, has two halves that lose in different conditions, which is the only diversification that survives a correlated sell-off, the article "Market Personality" point about matching frameworks to conditions extended to a within-book hedge. When the trend half is bleeding through a choppy patch, the reversion half is in its element, and vice versa.
The condition for this to work is that the gating is honest. A trend system that keeps trading in chop and a grid that keeps trading in a trend are not diversified; they are two ways of losing in the same regime, because both have leaked outside their cell. The diversification is real only if each family is actually confined to its column by the efficiency-ratio gate. The article "Why Systems Work Until They Don't" framed the acceptance that every system has a hostile regime; the multi-family book's value is that the families' hostile regimes do not overlap, so the book as a whole has no single regime that kills all of it, provided each piece stays in its lane.
What the map does not do
Honesty about the framework's limits. The map tells you which family fits the current measured regime; it does not predict regime changes. A market in the low-noise column can cross into the high-noise column next week, and the efficiency-ratio gate reacts after the crossing begins, not before, so there is always a transition cost as the gate catches up to the regime shift. This is the inductive limit from "Induction in Trading: Why Past Patterns Are Always Uncertain": the recent efficiency ratio is the best available estimate of the current regime and a poor predictor of the next one. The map reduces the cost of being in the wrong family; it does not eliminate the lag at regime boundaries.
The map also does not manufacture edge where none exists. Matching the right family to the right regime is necessary, not sufficient: a correctly-matched breakout in a low-noise market still has to clear costs, still has the low win rate, still needs enough trades to be reliable. The map solves the selection problem, which is the largest and most-ignored one, and leaves the executions, costs, and sample-size problems that the rest of the publication addressed. A perfectly matched family on an instrument where costs exceed the edge still loses, the point the article "Why Transaction Costs Should Be Added Before You Fall in Love" made and the trend-quality ranking encoded in its cost-reach term.
Decision summary
| Measured condition | Family | Size | Note |
|---|---|---|---|
| ER high, vol low | Breakout / MA trend | Larger | Quiet trend, let winners run |
| ER high, vol high | Breakout / MA trend | Smaller | Violent trend, wide MAE stops |
| ER low, vol low | Fade / grid | Larger | Quiet range, capped ladder |
| ER low, vol high | Fade with caution / stand aside | Smaller | Violent chop, the dangerous cell |
| ER mixed (0.20-0.30) | Gate or stand aside | Minimal | Highest overfit risk |
Two numbers select everything: the efficiency ratio picks the family, volatility sets the size. Measure them at the right timeframe, gate on the efficiency ratio as the regime drifts, run opposite families on the instruments that suit them, and accept that the map reduces but does not remove the cost of regime change.
Visualizing the master map
KEY POINTS
- There is no universally best system, only systems matched to conditions. The matching is mechanical: measure two numbers at the trading horizon and read the family off a two-axis map.
- Two axes determine everything. Noise (the efficiency ratio) selects the family because it decides continuation versus reversal. Volatility (average true range) sets the size because it decides how much capital a fixed risk budget supports. The axes are independent.
- The master map: low noise is the trend family (breakout, moving average, momentum); high noise is the reversion family (fade, grid). Low volatility sizes up; high volatility sizes down. The family is the column decision, the size is the row decision.
- Three of the four cells are clean (quiet trend, violent trend, quiet range). The fourth, violent chop (high volatility with high noise), is the most dangerous, and the honest answer is often to stand aside. The map's most valuable cell tells you not to trade.
- The end-to-end procedure: pick the timeframe (jointly satisfy noise, cost, sample), measure noise (efficiency ratio cross-checked with price density), measure volatility, select the family from the column, size from the row with an opportunity tilt, and gate dynamically as the regime drifts.
- The family is a function of the efficiency ratio alone; the size is the risk budget divided by volatility times an efficiency-ratio opportunity tilt. Two measured numbers drive both decisions.
- Running opposite families is diversification of the only kind that survives a correlated move: trend and reversion are hostile to opposite regimes, so a book that gates each to its column has no single regime that kills all of it, provided each piece stays in its lane.
- The map's limits: it does not predict regime changes (the gate reacts after the crossing, with a transition cost), and it does not manufacture edge where costs exceed it. It solves the selection problem, the largest and most-ignored one, and leaves the cost, execution, and sample-size problems to the rest of the framework.
- This article closes the Pillar 4 noise-and-conditions arc. Combined with the per-market personality view, the operational rule is complete: measure the efficiency ratio and volatility at the right timeframe, deploy the family the column demands, size from the row, and gate as the market moves.
References
- Trading Systems and Methods - Perry Kaufman (Amazon)
- Cybernetic Trading Strategies - Murray Ruggiero (Amazon)
- The Art of Currency Trading - Brent Donnelly (Amazon)
- Noise Trading and Exchange Rate Regimes
- The Microstructure of Foreign Exchange Markets
- Trends and Reversion in Financial Markets on Time Scales from Intraday to Monthly
- Mean Reversion Based on Autocorrelation
- Mean Reversion Trading Strategies and the Black Swan Events
- Lead-Lag Relationships in Market Microstructure
- Efficacy of a Mean Reversion Trading Strategy Using True Strength
- THE IMPACT OF FX CENTRAL BANK INTERVENTION IN A NOISE
- Measuring the Noise in Stock Prices
- Liquidity and Market Efficiency: A Large Sample Study
- Liquidity and Market Efficiency
- Noise Trading and Stock Market Volatility
- Volatility, Information and Noise Trading
- Volatility, Sentiment, and Noise Traders
- Market Regime Detection via Realized Covariances
- Non-Parametric Online Market Regime Detection and Forecasting
A note on AI. The ideas, research, analysis, and conclusions in this article are my own. I use AI tools to help with editing and wordsmithing, because English is not my first language, and I am not shy about that. AI-generated ideas and AI-assisted writing are not the same thing: the first is empty slop from a generic prompt, the second is a tool for communicating years of real research more clearly. Judge the work by its substance, not by whether software helped polish the prose.