4.11 Why Grid Systems Need Noise, Not Just Volatility
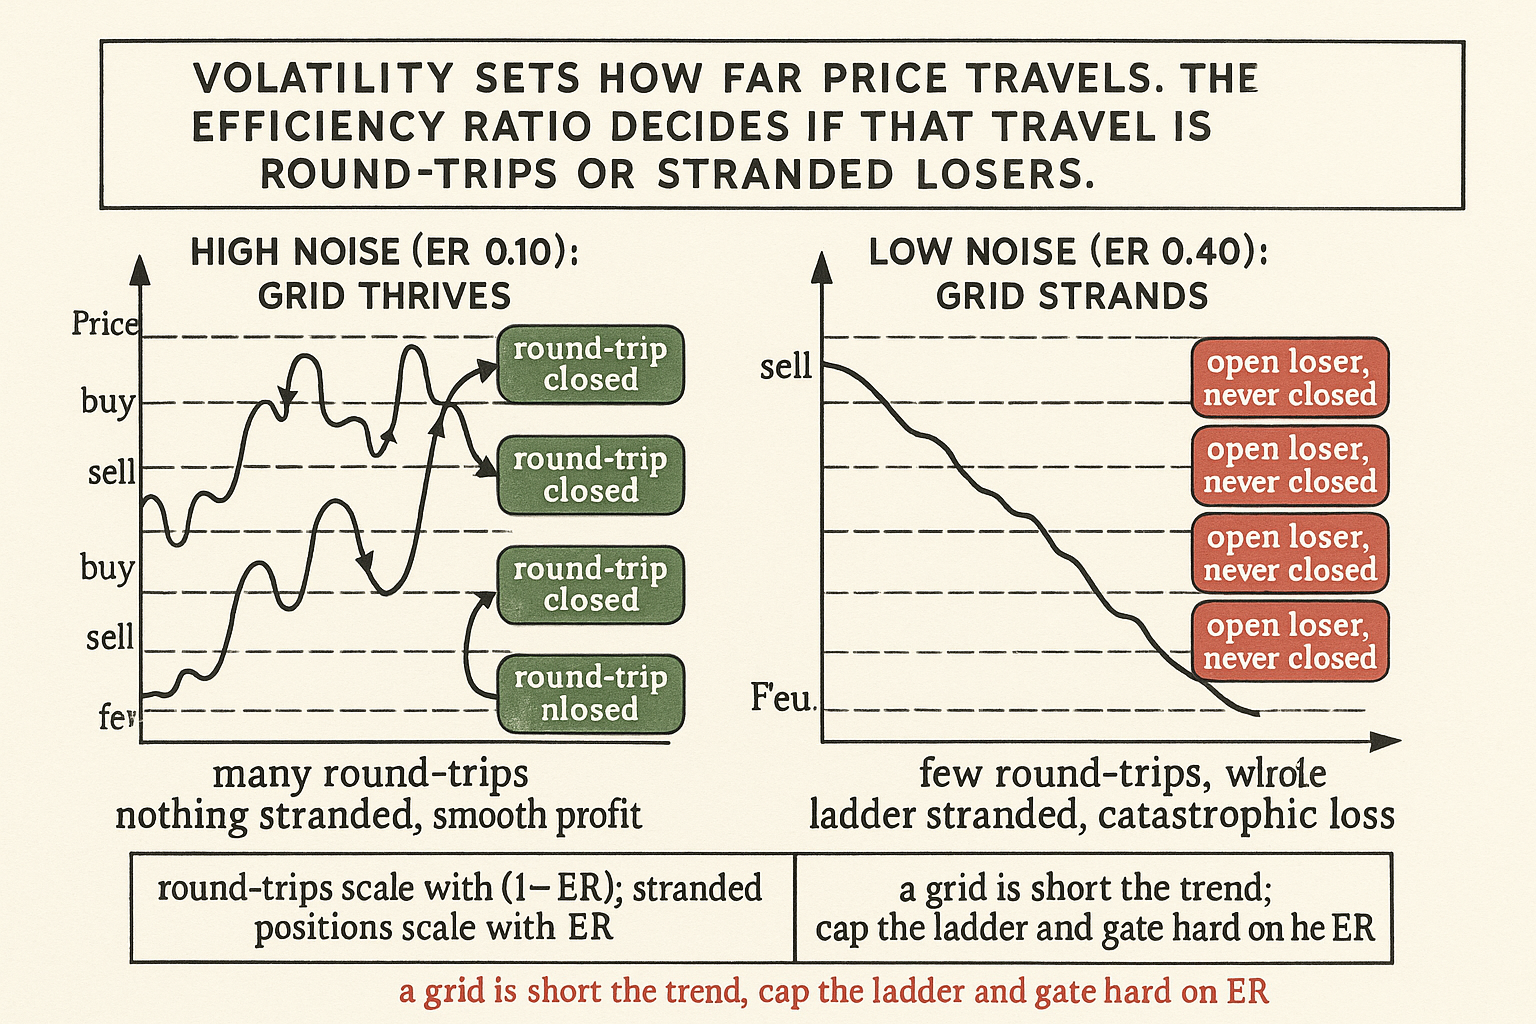
Grid traders watch volatility and blow up anyway. A grid needs noise, not range: volatility sets how far price travels, the efficiency ratio decides if it's round-trips or stranded losers.
A grid system places a ladder of buy orders below the current price and sell orders above it, harvesting a small profit each time price oscillates across a rung. Traders who run grids obsess over volatility, because more volatility means price travels farther and crosses more rungs, which feels like more profit. That instinct is half right and half fatal. A grid does need movement to cross rungs, but movement alone is not the requirement. The requirement is oscillation that comes back. A high-volatility market that travels far in one direction crosses every rung once and then strands the entire ladder of losing positions on the wrong side, never to be closed. The grid did not need volatility. It needed noise, and the two are not the same.
This article is the grid-design consequence of the noise-versus-volatility distinction, the mirror of the previous article's breakout case. "Why Breakout Systems Need Low Noise Environments" showed the trend family needs low noise; the grid is the purest case of a family that needs high noise, and it is dangerous precisely because volatility, the thing grid traders watch, looks like the requirement while actually being a trap when it comes without noise. The article "Noise Is Not Volatility" drew the distinction; the grid is where confusing the two empties an account.
A grid is a bet that price will come back across each rung
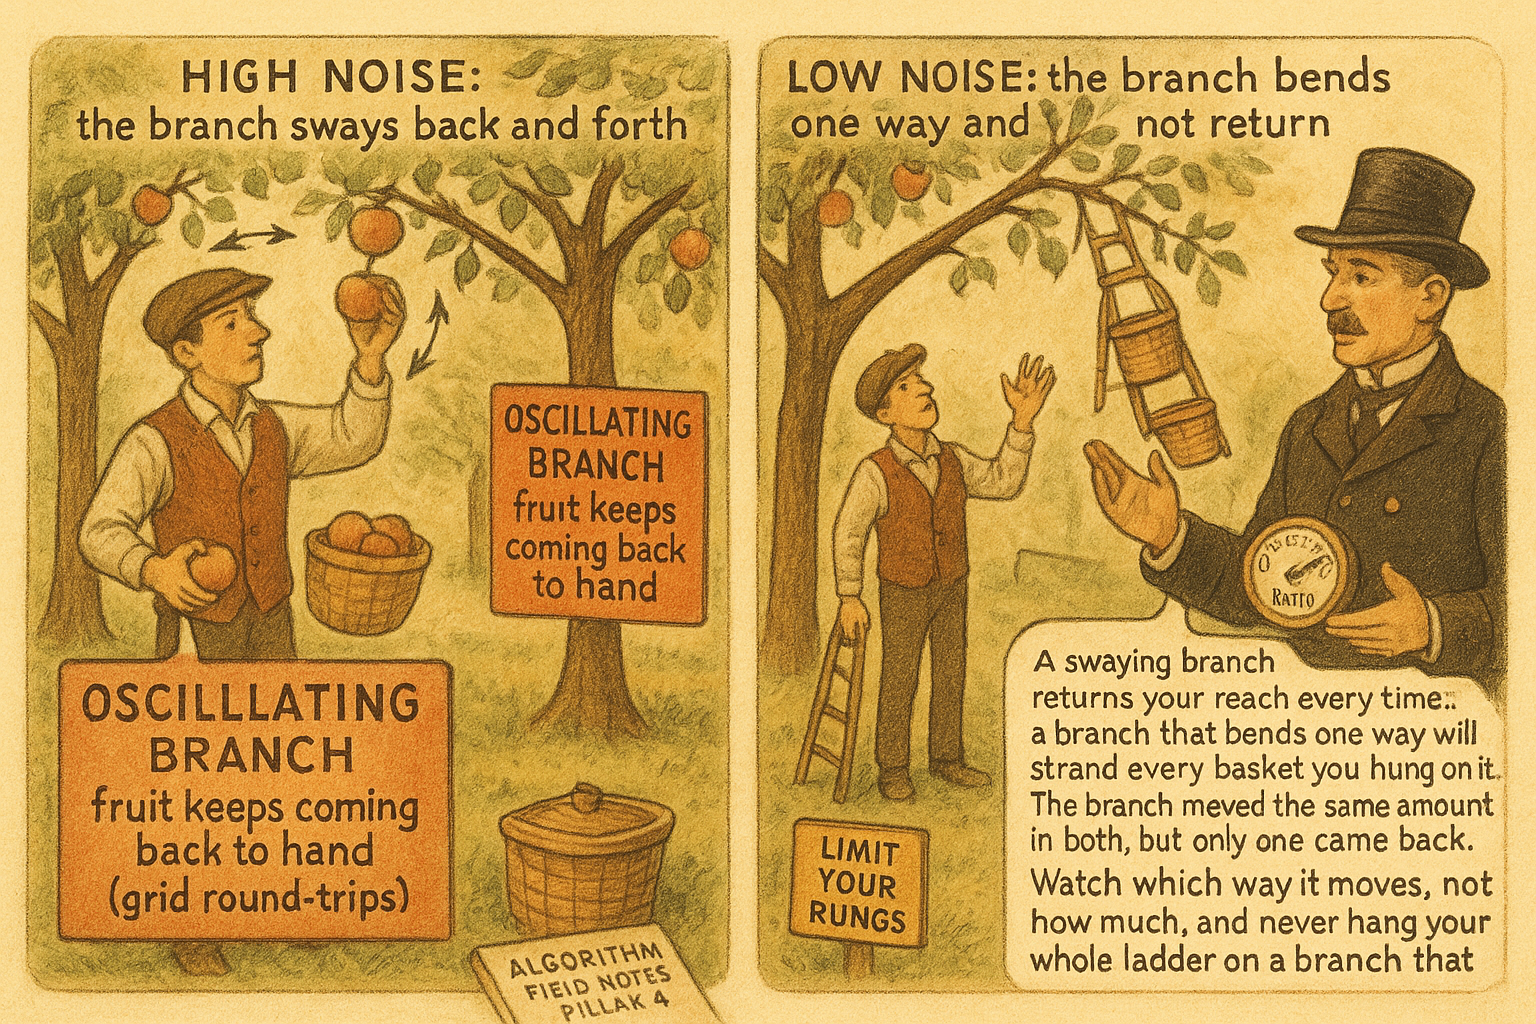
The grid's profit mechanism is round-trips. Price falls to a buy rung, you buy; price rises back across that rung, you sell for a small gain; repeat. Each completed round-trip is a small profit, and a grid in a oscillating market completes many of them. The entire premise is that price crosses each rung in both directions, down to trigger the buy and back up to close it. That two-way crossing is the definition of high noise: motion that cancels out, returning to where it was. The article "High Noise Markets Are Mean-Reversion Markets" established that fade systems harvest cancellation; a grid is a mechanized fade system, a ladder of small reversion bets, and it harvests the same noise.
Volatility helps only to the extent it produces two-way crossings. Volatility that produces one-way travel is the grid's ruin. When price trends through the grid without returning, every buy rung below a falling price fills and never closes (the price keeps falling, the positions keep losing), or every sell rung above a rising price fills and never closes. The grid accumulates a stack of open losers in the trend direction while booking nothing, the exact opposite of its intended behavior. This is why a grid's risk is not measured by volatility but by the probability of a sustained one-way move, which is low noise, the grid's lethal environment.
The math: round-trips need return, not range
Quantify why volatility without noise is worthless to a grid. Suppose a grid with rungs spaced d apart over a window where price covers total path length S. The number of rung crossings is roughly the path length divided by the rung spacing, and each crossing is half a round-trip. But a crossing only becomes a profit if it is matched by a return crossing, and the fraction of crossings that get matched is governed by how much the motion cancels, the noise level.
$$ \text{Round-trips} \approx \frac{1}{2}\left(\frac{S}{d}\right)\cdot(1 - \text{ER}), \qquad \text{Stranded positions} \approx \frac{|P_{\text{end}} - P_{\text{start}}|}{d} = \frac{S \cdot \text{ER}}{d} $$
The number of completed round-trips scales with the total path S over the rung spacing d, multiplied by one minus the efficiency ratio: the more the motion cancels (low efficiency ratio, high noise), the more crossings get matched into round-trips. The number of stranded, unclosed positions scales with the net displacement, which is the path times the efficiency ratio: the more the motion accumulates in one direction (high efficiency ratio, low noise), the more positions get left open on the wrong side. The two terms split the path between profit and danger by the efficiency ratio. At efficiency ratio near 0 (pure noise), almost all crossings become round-trips and almost nothing is stranded: the grid's paradise. At efficiency ratio near 1 (pure trend), almost nothing round-trips and the displacement strands the whole ladder: the grid's grave. Volatility sets S, the total path, but the efficiency ratio decides how S is divided between the round-trip term and the stranded term, and only the round-trip term is profit.
This is the precise sense in which a grid needs noise, not just volatility. Two markets with identical volatility (identical S) deliver opposite grid outcomes depending on their efficiency ratio. The grid trader who sizes the grid to volatility and ignores the efficiency ratio is sizing to S while blind to the split, and the split is the whole game.
The hidden short-volatility-of-trend exposure
A grid has the risk profile the article "Why Profit Factor Can Lie" warned about, in its most extreme form: a high win rate (almost every round-trip closes for a small gain) hiding a catastrophic left tail (the one-way move that strands the ladder and runs). The grid's equity curve looks immaculate in a ranging market, a steady climb of small wins, right up until a trend arrives and the stranded positions produce a loss larger than all the accumulated round-trips combined. This is the classic grid blow-up, and it is structural: the grid is implicitly short the trend, and a trend is its short-volatility-style tail event.
Most grid blow-ups are misattributed to "too much volatility". The volatility was not the problem; a high-volatility ranging market is a grid's best environment. The problem was the efficiency ratio rising, the market converting its volatility from two-way oscillation into one-way displacement. The article "Volatility Expansion vs Directional Opportunity" separated these exactly: the grid survives a volatility expansion that stays noisy and dies on a volatility expansion that becomes directional. A grid trader watching only volatility cannot see the difference coming; a grid trader watching the efficiency ratio can.
Designing a grid that respects noise
If the grid needs high noise, the design follows from measuring and protecting against the efficiency ratio, not the volatility. Three rules, mirroring the breakout's three.
Rule 1: select instruments by inverse trend quality. The grid belongs on the bottom of the trend-quality ranking from "How to Rank Markets by Trend Quality", the high-noise, low-efficiency-ratio instruments (G10 FX, range-bound commodities) where two-way crossings dominate. Running a grid on a top-ranked trending instrument is a design error that the smooth early equity curve will hide until the trend arrives.
Rule 2: gate on the rolling efficiency ratio, and gate hard. The grid's gate is more important than the breakout's because the grid's failure is catastrophic rather than gradual. When the rolling efficiency ratio at the grid's horizon rises toward trend territory, stop adding rungs in the trend direction and begin closing stranded positions, accepting the small loss to avoid the large one. The article "When a Stop Loss Improves Risk but Destroys Edge" noted that stops trade edge for risk control; for a grid the stop (a hard exit when the efficiency ratio signals a regime change) is non-negotiable, because the ungated grid's tail is unbounded.
Rule 3: cap the ladder and never average into a trend indefinitely. A grid that keeps adding rungs as price runs away is a martingale, and a martingale meets a trend and dies. Cap the total number of rungs and the total exposure so that even a full one-way run through the entire grid is a survivable loss, not an account-ending one. The cap is the difference between a grid that has a bad month and a grid that has a last month.
The asymmetry with breakouts
The grid and the breakout are exact mirror images, and seeing the symmetry clarifies both. The breakout needs low noise and dies in high noise; the grid needs high noise and dies in low noise. The breakout has many small losers and rare large winners; the grid has many small winners and rare large losers. The breakout's equity curve is lumpy and looks bad in chop; the grid's equity curve is smooth and looks great in chop right until it does not. The breakout's danger is visible (a string of losses you feel); the grid's danger is hidden (a tail you do not feel until it arrives). The article "Why Profit Factor Can Lie" applies to both but in opposite directions, and a trader who runs both families on the right instruments has a portfolio whose two halves are hostile to opposite regimes, which is the diversification the next article, "Matching Strategy Families to Market Conditions", builds on.
The grid is the more dangerous of the two for a retail trader precisely because its failure is hidden. A breakout that whipsaws tells you immediately it is in the wrong regime; you feel the losses and stop. A grid in a slowly trending market keeps booking small wins while the stranded losers quietly grow, so the feedback that you are in the wrong regime is delayed until the loss is already large. The efficiency-ratio gate exists to provide the feedback the equity curve withholds.
Decision summary
| Efficiency ratio at grid horizon | Two-way crossing fraction | Action |
|---|---|---|
| Below 0.15 | High (most crossings round-trip) | Grid's ideal environment, run with capped ladder |
| 0.15 to 0.25 | Moderate | Grid with tighter rung cap, watch the gate |
| Above 0.30 | Low (displacement strands the ladder) | Close the grid; a trend will strand it |
A grid needs noise, not volatility. Volatility sets how far price travels; the efficiency ratio decides whether that travel is round-trips (profit) or displacement (stranded losers). Select high-noise instruments, gate hard on the efficiency ratio, and cap the ladder so the inevitable trend is survivable.
Visualizing the grid's true requirement
KEY POINTS
- A grid harvests round-trips: price crosses a rung down to trigger a buy and back up to close it for a small gain. The premise is two-way crossing, which is the definition of high noise (motion that comes back).
- Volatility helps only when it produces two-way crossings. Volatility that produces one-way travel is the grid's ruin: rungs fill and never close, accumulating a stack of stranded losers in the trend direction.
- The math splits the path by the efficiency ratio: completed round-trips scale with one minus the efficiency ratio (the cancellation), and stranded positions scale with the efficiency ratio (the displacement). Volatility sets the total path; the efficiency ratio decides how it splits, and only the round-trip part is profit.
- Two markets with identical volatility deliver opposite grid outcomes depending on their efficiency ratio. Sizing a grid to volatility while blind to the efficiency ratio is sizing to the path while ignoring the split that is the whole game.
- A grid has a high win rate hiding a catastrophic left tail. The smooth equity curve of small wins persists until a trend strands the ladder and produces a loss larger than all accumulated round-trips. The grid is implicitly short the trend.
- Most grid blow-ups are misattributed to "too much volatility". A high-volatility ranging market is a grid's best environment; the killer is the efficiency ratio rising, converting oscillation into displacement.
- Three design rules: select high-noise (bottom-of-trend-quality) instruments, gate hard on the rolling efficiency ratio and close stranded positions when it rises, and cap the ladder so a full one-way run is survivable rather than account-ending. Never run an uncapped grid that averages into a trend (a martingale).
- The grid is the exact mirror of the breakout and the more dangerous for retail because its failure is hidden: a whipsawing breakout signals the wrong regime immediately, while a grid books small wins as the stranded losers quietly grow. The efficiency-ratio gate supplies the feedback the equity curve withholds.
- The next article, "Matching Strategy Families to Market Conditions", assembles the whole Pillar 4 framework: a map from measured market conditions to the strategy family that fits, with trend and grid as the two poles.
References
- Trading Systems and Methods - Perry Kaufman (Amazon)
- Cybernetic Trading Strategies - Murray Ruggiero (Amazon)
- The Art of Currency Trading - Brent Donnelly (Amazon)
- Dynamic Grid Trading Strategy: From Zero Expectation to Market Outperformance
- Newly Developed Flexible Grid Trading Model Combined ANN and Simplified Swarm Optimization
- The Price Dynamics of Common Trading Strategies
- Herding, Trend Chasing and Market Volatility
- High-Frequency Trading, Asset Pricing, and Market Microstructure
- Price Expectations for Financial Markets: Randomness and Signal in Price Dynamics
- Lead-Lag Relationships in Market Microstructure⋆
- Trade in Minutes! Rationality-Driven Agentic System for Quantitative
- Do Finer Pricing Grids Reduce Market Volatility? Evidence from a Tick Size Reform in an Emerging Market
- Market Microstructure Noise and Price Discovery
- High Frequency Traders and the Price Process
- Testing for Market Microstructure Effects in Intraday Volatility
- The Economic Consequences of Noise Traders
- Noise Trader Risk in Financial Markets
- Trends and Reversion in Financial Markets on Time Scales from Minutes to Decades
- An ADX-Conditioned VWAP Strategy in FX Markets
A note on AI. The ideas, research, analysis, and conclusions in this article are my own. I use AI tools to help with editing and wordsmithing, because English is not my first language, and I am not shy about that. AI-generated ideas and AI-assisted writing are not the same thing: the first is empty slop from a generic prompt, the second is a tool for communicating years of real research more clearly. Judge the work by its substance, not by whether software helped polish the prose.