3.27 When a Stop Loss Improves Risk but Destroys Edge
A stop loss truncates losses (lowers drawdown) and cuts winners that briefly moved against entry (lowers expectancy). Mean reversion: second effect dominates. Trend following: first does. Test it.
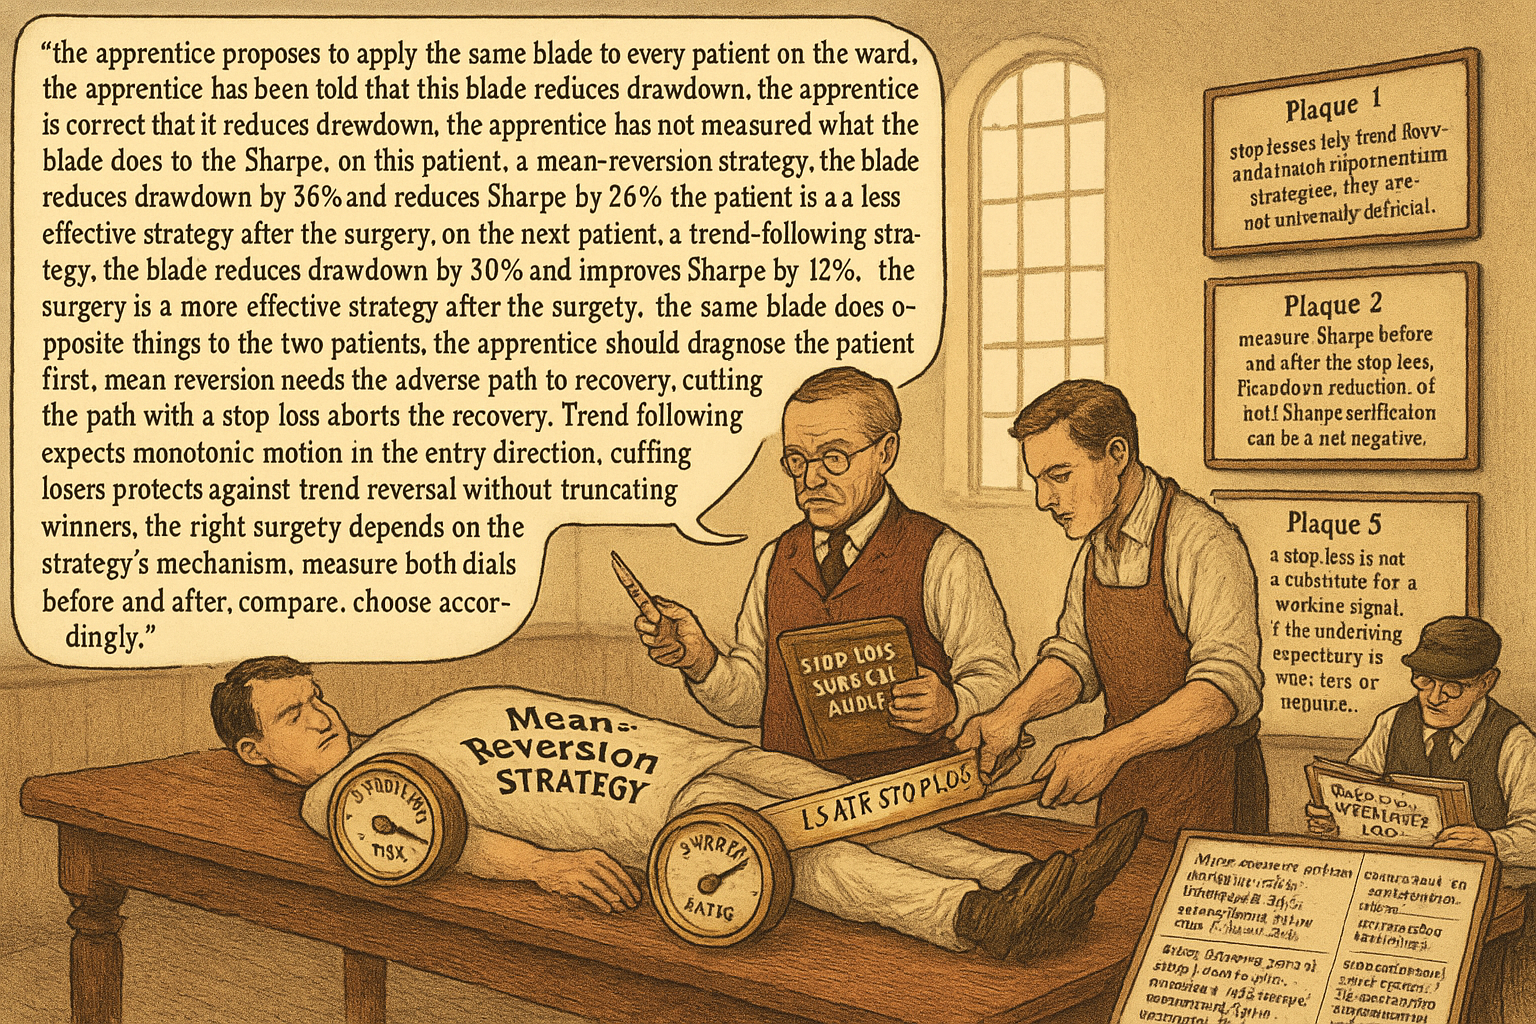
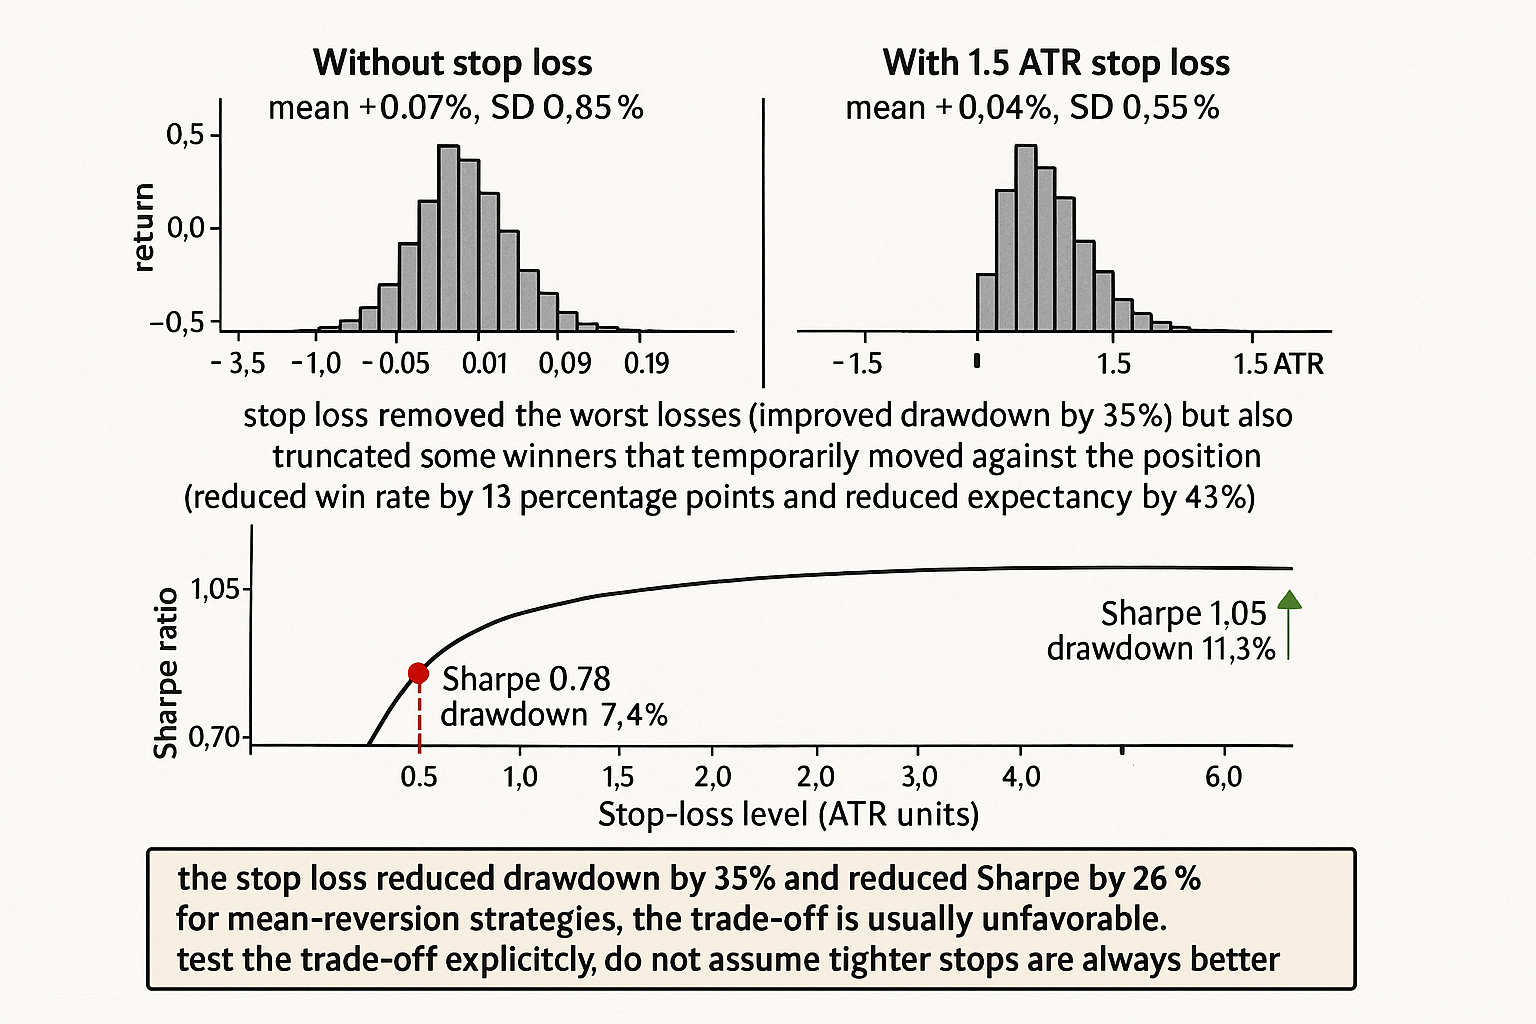
A mean-reversion strategy on E-mini SPX trades 240 times per year with average winning trade +0.42% and average losing trade -0.55%. The win rate is 64%. The expectancy per trade is approximately +0.07%. The annualized Sharpe before transaction costs is 1.05. The maximum drawdown over the backtest is 11.3%. The team adds a stop loss at 1.5x the average true range from entry, hoping to reduce drawdown. The new statistics: 240 trades per year, average winning trade +0.40% (slightly lower because some winners are stopped out before reaching their natural exit), average losing trade -0.32% (much lower because losses are capped), win rate 51% (lower because many winners that would have recovered are now stopped out as losses). The expectancy per trade is approximately +0.04%. The annualized Sharpe is 0.78. The maximum drawdown is 7.4%.
The team has reduced the maximum drawdown from 11.3% to 7.4%, a 35% improvement. The team has also reduced the Sharpe from 1.05 to 0.78, a 26% reduction in risk-adjusted return. The team's risk committee approves the change because "drawdown is more visible to the allocator than Sharpe". The strategy is deployed with the stop loss. Three years later, the team's compounded return is approximately 8% lower than it would have been without the stop loss.
The pattern is structural to mean-reversion strategies and many other trade-frequent strategies. A stop loss caps the worst outcomes, which lowers the variance and lowers the maximum drawdown. The same stop loss also cuts off winning trades that temporarily moved against the position before recovering, which lowers the win rate and lowers the expectancy. For most mean-reversion strategies the second effect is larger than the first because mean reversion explicitly relies on adverse moves preceding favorable moves. The article "Why Volatility Is More Non-Stationary Than Trend" framed the volatility-clustering structure that makes mean reversion work; the same structure makes stop losses costly. This article gives the operational framework for when a stop loss helps and when it destroys the edge it is supposed to protect.
The mechanics of a stop loss
Two effects on the trade distribution.
Effect 1: truncation of the loss tail. Losses larger than the stop level are converted to losses at the stop level. The mean of the loss distribution is shifted up (less negative); the variance is reduced; the kurtosis is reduced. The drawdown distribution is shifted up (less severe). The risk side of the strategy is unambiguously improved.
Effect 2: truncation of the winning trades that temporarily moved against the position. A trade that drops to -1.5 ATR before reversing to +0.4 ATR (a typical mean-reversion winner) is converted from a +0.4 ATR profit into a -1.5 ATR loss. The mean of the win distribution is shifted down. The win rate is reduced. The expectancy is reduced.
The trade-off. The first effect helps risk-adjusted metrics. The second effect hurts them. For different strategy types, the balance is different.
Strategy types and stop-loss responsiveness
Five strategy categories with different responses to stop losses.
Category 1: mean reversion. Mean reversion explicitly relies on adverse-then-favorable price paths. A stop loss truncates the path before the favorable phase. Mean reversion is the strategy class most damaged by stop losses. Tight stops (e.g., 1 ATR) typically drop the edge to zero. Wider stops (e.g., 3-4 ATR) preserve most of the edge but provide little risk reduction. The right stop loss for mean reversion is often "no stop, only a position-cap-and-time-stop combination".
Category 2: trend following. Trend following is more compatible with stop losses because the strategy's expected path is monotonic in the entry direction. A trade that moves more than 2 ATR against the position has a higher loss probability than at entry (the trend has not materialized or has reversed). A stop loss at 2-3 ATR removes losers without truncating many winners. Trend following typically benefits from a stop loss in the form of an ATR-based stop or a trailing stop.
Category 3: breakout strategies. Breakouts can be either trend-followers (the breakout continues) or fade-followers (the breakout fails). For breakout-as-trend, the stop-loss response is similar to trend following. For breakout-as-fade, the stop-loss response is similar to mean reversion. The strategy specification determines which response applies.
Category 4: factor strategies (cross-sectional). Cross-sectional factor strategies (long top decile, short bottom decile, periodic rebalance) typically do not benefit from per-position stop losses because the strategy's risk profile is determined by the diversification across positions, not the per-position trajectory. A stop loss that exits one position before rebalance creates unnecessary sequencing dependence.
Category 5: option strategies. Option strategies have nonlinear payoffs. A stop loss based on underlying price often interacts unexpectedly with option Greeks. Stop losses for option strategies should be based on option-position P&L, not underlying price.
Cases where a stop loss earns its keep
Three operational reasons.
Reason 1: catastrophic-event protection. Some trades can lose multiples of their average loss in catastrophic-event scenarios (a single overnight gap, a regime break). A stop loss at 4-6 ATR provides protection against the very worst outcomes without truncating typical losers. The article "Monte Carlo for Trading Systems" framed the bootstrap-based estimate of the worst-case-loss distribution; a stop loss at the bootstrap 99th percentile of typical losses provides protection without much effect on typical performance.
Reason 2: position-cap simulation. A stop loss can be used as a "position cap with a different mechanism": instead of capping the maximum dollar exposure to a single position, cap the maximum dollar loss. The two are equivalent in many cases, and the stop-loss form is more visible to the trader and the risk committee.
Reason 3: hard-coded liquidation discipline. For human traders prone to "average down" or "let it run" emotional decisions, a hard stop loss enforces discipline. For systematic strategies the stop loss is a redundant hard-coded version of the strategy's exit rule, which is a different role from a discretionary stop.
For systematic strategies on the mean-reversion or factor families, none of the three reasons typically applies, and the stop loss is most likely an unproductive constraint.
Quantifying the trade-off
The question to ask. For a given stop-loss level S (in ATR units), what is the change in expectancy and what is the change in standard deviation per trade?
The math. Let the per-trade return distribution without stops have mean mu and standard deviation sigma. The stop loss at S truncates the distribution at -S sigma (if S is in standard-deviation units). The new mean and standard deviation depend on the shape of the distribution.
For a normal distribution, the truncation moves the mean up by an amount that depends on the quantile and the tail-mass. For a fat-tailed distribution typical of trading P&L, the move is larger. The Sharpe change depends on the relative magnitudes of the mean shift (positive) and the implicit reduction from cutting winners that would have recovered (negative).
$$ \text{Sharpe}(S) = \frac{\mathbb{E}[r \mid r \geq -S \sigma]}{\sqrt{\text{Var}[r \mid r \geq -S \sigma]}} \cdot \sqrt{T} $$
For mean-reversion strategies, the per-trade conditional distribution given r >= -S sigma typically has lower mean and lower variance than the unconditional, with the mean reduction larger than the variance reduction. The Sharpe drops. For trend-following strategies, the conditional has higher mean and lower variance. The Sharpe rises.
The discipline. Compute Sharpe(S) for a range of S values (e.g., S = 1, 2, 3, 4, 5, infinity) on the actual strategy's trade distribution. Plot. Choose S that maximizes Sharpe (with the structural-prior caveat that very tight stops are usually wrong even if the IS Sharpe says otherwise). For most mean-reversion strategies the maximum is at S = infinity (no stop) or at S = 4+ ATR (very wide stop). For trend-following the maximum is typically at S = 2-3 ATR.
Anti-patterns
Five mistakes specific to stop-loss design.
Anti-pattern 1: setting the stop loss based on personal pain tolerance, not on the trade distribution. A 1% stop loss on a strategy whose typical adverse excursion is 1.5% truncates most trades into losses. The stop loss should be sized to the strategy's natural distribution, not to the trader's emotional comfort.
Anti-pattern 2: claiming the stop loss "improves risk" without measuring the Sharpe change. Drawdown reduction is one risk metric; Sharpe is another; expectancy is a third. A change that improves drawdown but reduces expectancy by more than the drawdown improvement is a net negative.
Anti-pattern 3: applying a uniform stop-loss policy across strategy families. Mean reversion and trend following have opposite stop-loss responsiveness. A "all strategies must have a 2-ATR stop" policy is wrong for at least one of the families.
Anti-pattern 4: optimizing the stop-loss level on the IS data without robustness checks. The IS-optimal stop loss is often at the boundary of the search range (e.g., the loosest tested) or at a sharp peak. Apply the parameter-stability discipline from "Parameter Stability Beats Best Parameter" to the stop-loss parameter.
Anti-pattern 5: using a stop loss to "rescue" a losing strategy. If a strategy has near-zero or negative expectancy, adding a stop loss does not create edge. The stop loss truncates the losing distribution but does not produce winners. The right response to a losing strategy is to fix the underlying signal, not to add risk-management constraints around it.
Decision matrix
| Strategy family | Stop-loss responsiveness | Recommended stop |
|---|---|---|
| Mean reversion (intraday or short-horizon) | Edge-destroying | None or very wide (4-6 ATR) |
| Mean reversion (medium-horizon) | Edge-eroding | Wide (3-4 ATR) only for catastrophic protection |
| Trend following | Edge-preserving and risk-improving | 2-3 ATR or trailing stop |
| Breakout (as trend) | Like trend | 2-3 ATR |
| Breakout (as fade) | Like mean reversion | None or very wide |
| Cross-sectional factor | Mostly irrelevant | Position cap by exposure, not stop loss |
| Option strategies | Nonlinear, requires option-P&L stop | Stop on option-position P&L, not underlying |
| Strategy with no demonstrated edge | Stop loss does not help | Fix the signal, not the stop |
The matrix maps strategy family to stop-loss recommendation. The pattern: stop losses are not universally beneficial. They help trend-followers and similar momentum strategies; they hurt mean reversion and many factor strategies.
Visualizing the trade-off
KEY POINTS
- A stop loss has two effects on a strategy's trade distribution: it truncates the loss tail (improves drawdown, lowers variance) and it converts some winners that temporarily moved against the position into losses (lowers expectancy, lowers win rate). The net effect on Sharpe depends on which effect dominates.
- For mean-reversion strategies, the second effect is typically larger than the first because mean reversion relies on adverse-then-favorable price paths. A tight stop (1-1.5 ATR) often destroys the edge; a wide stop (4+ ATR) preserves the edge but provides little risk reduction.
- For trend-following strategies, the first effect typically dominates because trades that move 2 ATR or more against the position are unlikely to recover. A stop at 2-3 ATR or a trailing stop typically improves both Sharpe and drawdown.
- Five strategy categories with different responses: mean reversion (edge-destroying), trend following (edge-preserving and risk-improving), breakout-as-trend (like trend), breakout-as-fade (like mean reversion), cross-sectional factor (mostly irrelevant; use position cap instead).
- Three legitimate uses of a stop loss: catastrophic-event protection (S = 4-6 ATR, only the worst outcomes are truncated), position-cap simulation (limit dollar loss, equivalent to capping exposure), hard-coded liquidation discipline for human traders.
- The Sharpe change from a stop loss should be computed on the actual strategy's trade distribution, not assumed. Plot Sharpe vs stop-loss level S; choose the S that maximizes Sharpe with structural-prior caveats. Most mean-reversion strategies maximize at S = infinity or S = 4+ ATR.
- Anti-pattern: setting the stop loss based on personal pain tolerance, not on the trade distribution. The stop loss should be sized to the strategy's natural distribution.
- Anti-pattern: claiming the stop loss "improves risk" without measuring the Sharpe change. Drawdown reduction without Sharpe verification can be a net negative.
- Anti-pattern: applying a uniform stop-loss policy across strategy families. Mean reversion and trend following have opposite responsiveness.
- Anti-pattern: optimizing the stop-loss level on IS without robustness checks. Apply parameter-stability discipline.
- Anti-pattern: using a stop loss to "rescue" a losing strategy. If the underlying expectancy is near-zero or negative, the stop loss does not create edge.
- The risk-management trade-off is concrete and measurable. The team that approved the stop loss in the opening example reduced drawdown by 35% but reduced compounded return by approximately 8% over three years; the trade-off was unfavorable for that strategy.
- The current article gives the stop-loss-specific framework. The next article in the publication ("MAE/MFE Analysis: Seeing What Net Profit Hides") covers the diagnostic technique for understanding which trades the stop loss would help or hurt before applying it.
References
- Testing and Tuning Market Trading Systems - Timothy Masters (Amazon)
- Data Mining Algorithms in C++ - Timothy Masters (Amazon)
- Evaluating Trading Strategies
- Futuretesting Quantitative Strategies
- Online Quantitative Trading Strategies - NYU Stern
- Risk-Aware Reinforcement Learning Reward for Financial Trading
- [1609.00869] Determining Optimal Stop-Loss Thresholds via
- Agentic Trading: When LLM Agents Meet Financial Markets - arXiv
- Performance and Risk of an AI-Driven Trading Framework - arXiv
- Spurious Predictability in Financial Machine Learning - arXiv
- When Do Stop-Loss Rules Stop Losses?
- On the Effectiveness of Stop-Loss Rules: An Analytical Framework
- A Closed-Form Solution for Optimal Mean-Reverting Trading Strategies
- Efficiency Loss and Constraints on Portfolio Holdings
- Bayes is All You Need: Better Estimates of True Sharpe Ratios
- Limitations of Quantitative Claims About Trading Strategy Evaluation
- An Explainable Walk-Forward and Bootstrap Backtesting Framework for SPY Equity Strategy Development
- Experimental Evaluation of an Algorithmic Trading Strategy Against Random Entry Using Monte Carlo Simulation
A note on AI. The ideas, research, analysis, and conclusions in this article are my own. I use AI tools to help with editing and wordsmithing, because English is not my first language, and I am not shy about that. AI-generated ideas and AI-assisted writing are not the same thing: the first is empty slop from a generic prompt, the second is a tool for communicating years of real research more clearly. Judge the work by its substance, not by whether software helped polish the prose.