4.13 Intermarket Analysis for System Traders
Markets are wired together by inflation, rates, and capital flows. Intermarket analysis turns a second market into a filter on the one you trade, through four repeatable rule templates.
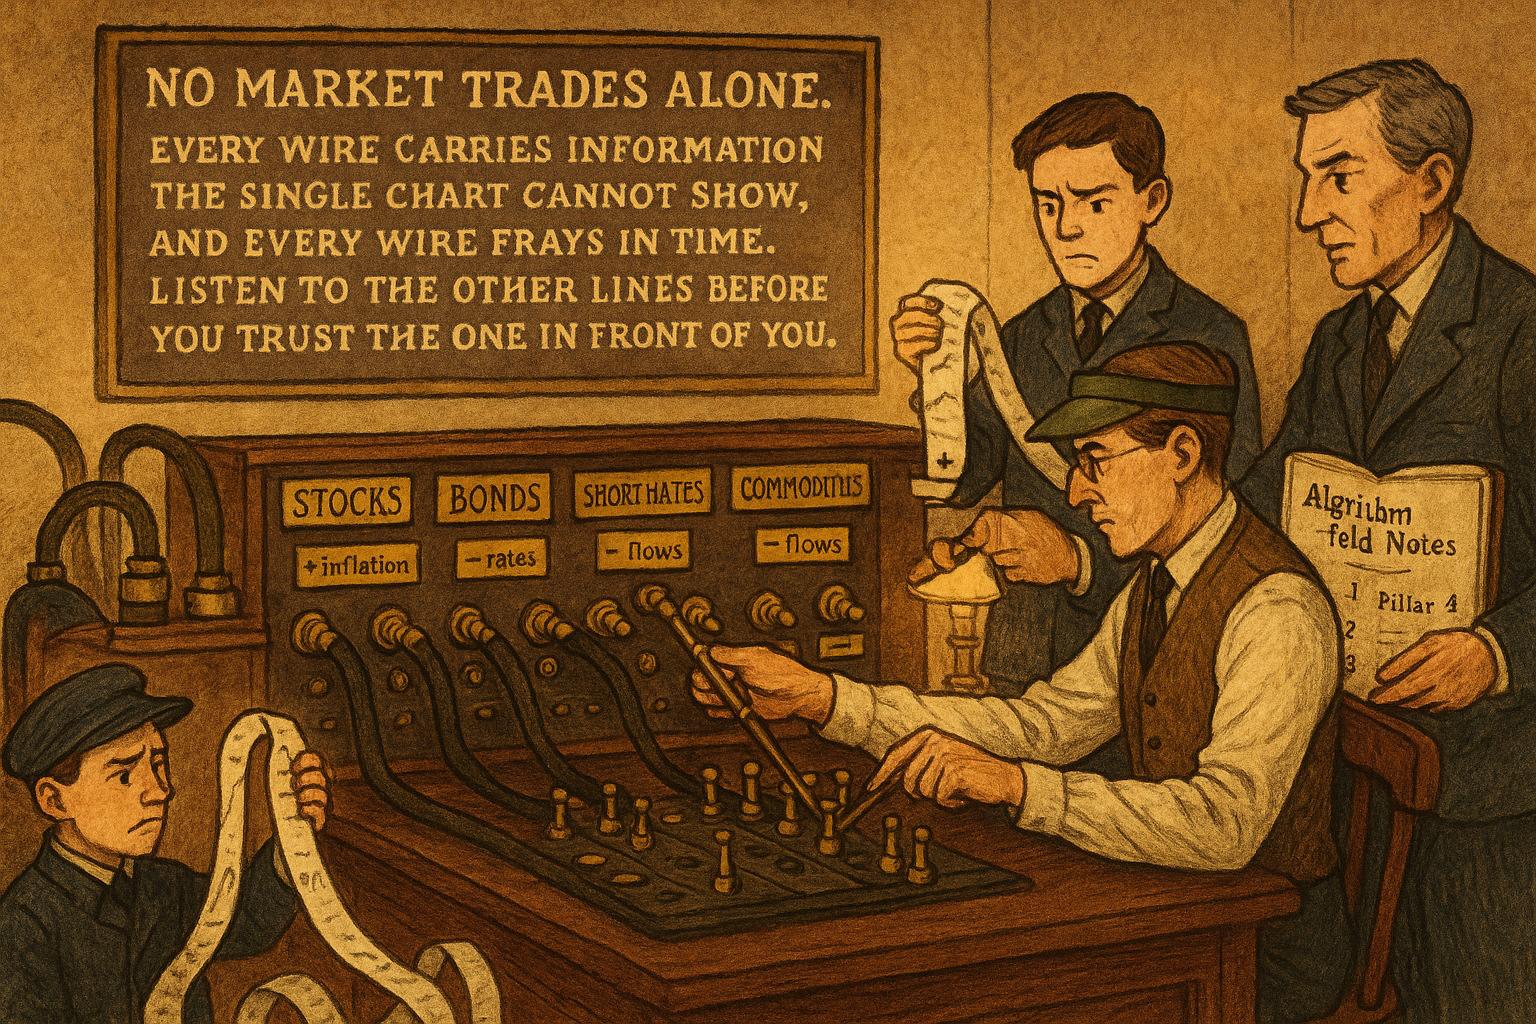
Take a trader watching only the S&P 500 chart. Price is grinding higher, the moving averages are stacked bullish, the trend looks clean. Now hand that same trader a second screen showing T-bond futures rolling over hard, and a third showing the dollar firming while gold sags. The single chart says "long, stay long." The three charts together say "the move you are riding is fighting its own macro plumbing, and the bond market usually wins that argument." Intermarket analysis is the study of how markets move against each other, and for a system trader it is a way to generate signals from data that never appears on the chart you are trading.
The core claim is narrow and testable. Markets do not float independently. Bonds, stocks, currencies, and commodities are wired together by inflation, interest rates, and capital flows, and those wires create lead-lag and correlation structure you can measure and rule-ify. The retail version of this idea is a wall of squiggly lines and a guru pointing at "confluence." The systematic version is a filter: a second market gates the signals of the first, and you measure whether the gate improves the distribution of forward returns. Same data, completely different discipline.
This article sets up the intermarket arc of Pillar 4. The articles that follow drill into specific pairs (bonds filtering equities, gold against the dollar, copper as an activity proxy, crude against FX), and later ones push the idea toward network momentum and currency-strength decomposition. This one defines the object, lays out the relationship web, and converts the web into the four rule templates every later article instantiates.
What "interrelated" actually means
Two markets are intermarket-related when the state of one shifts the forward-return distribution of the other. That is the operational definition, and it has nothing to do with whether the relationship "makes sense." A relationship earns its place by changing a distribution, not by sounding plausible on a macro podcast.
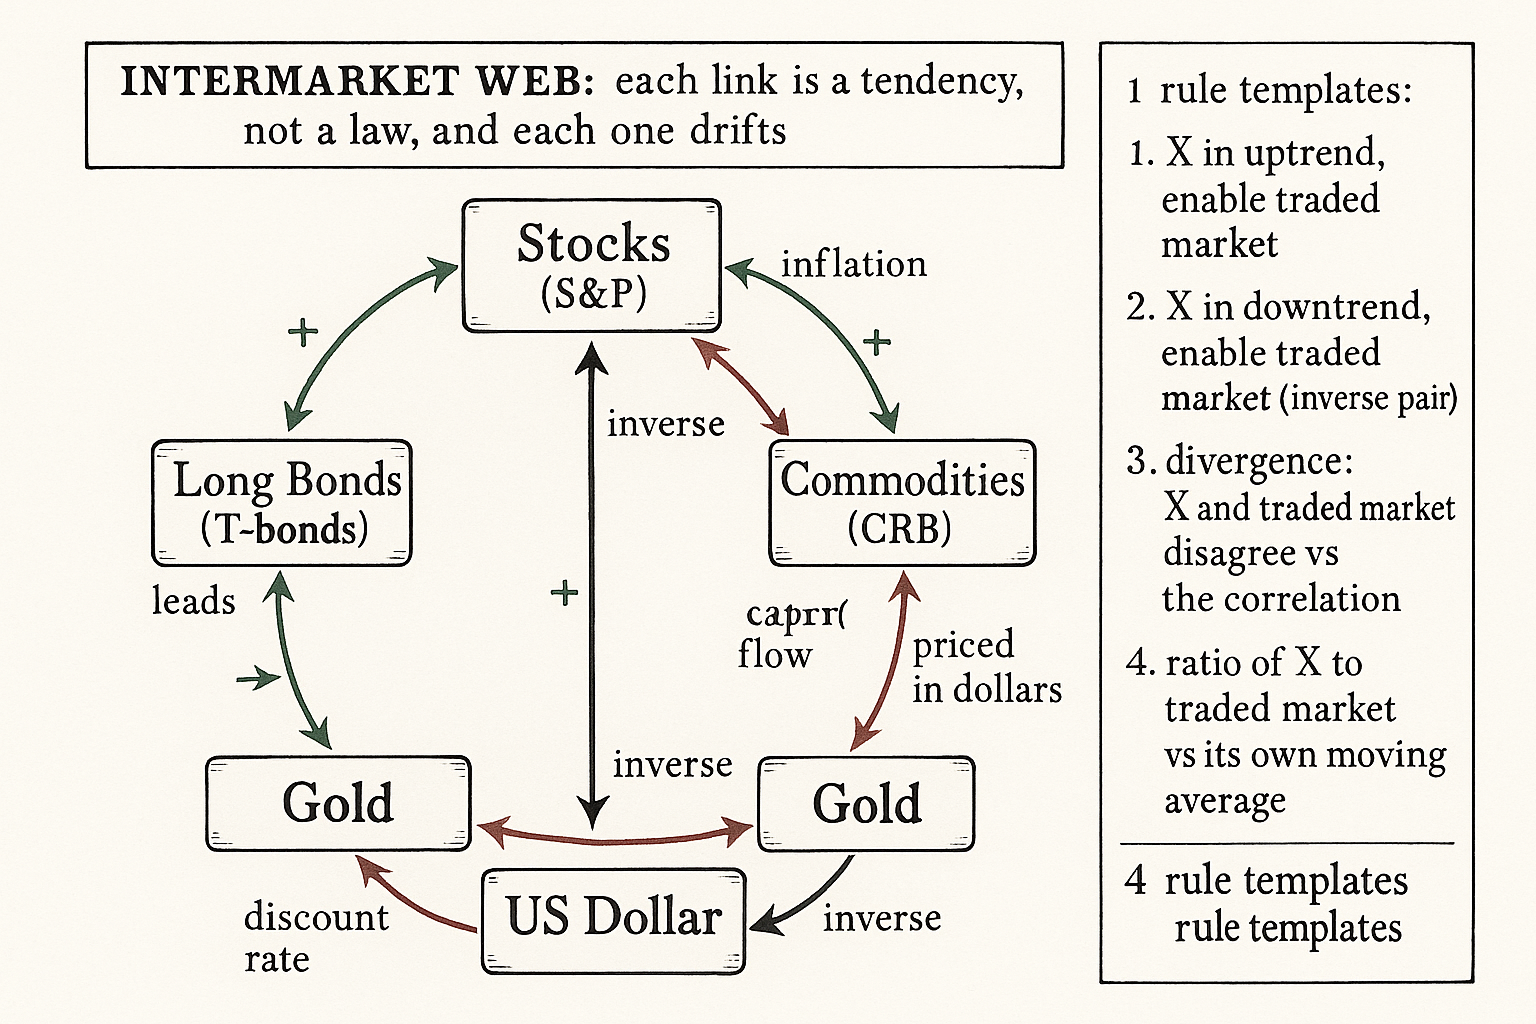
The classic web, measured over decades of daily and weekly data, looks like this. Stocks and long bonds move together over the medium term, because both are discounted by the same long rate. Bonds run inverse to inflation, because inflation erodes a fixed coupon. Commodities run inverse to bonds, because rising commodity prices feed inflation a few months later. Gold runs inverse to interest-rate markets, because gold pays no coupon and suffers when real yields rise. The dollar runs inverse to gold and to the broad commodity basket, because commodities are priced in dollars. Foreign currencies run with bonds, because falling US rates make dollar assets less attractive and push capital abroad.
None of these is a law. Each is a tendency that holds across long samples, weakens in some regimes, and inverts in others. The point of treating them systematically is exactly that you stop trusting the story and start measuring the current strength of each link, the same way the article "Slow Wandering: The Most Dangerous Type of Market Change" treated every structural relationship as something that drifts.
The four rule templates
Every intermarket system in this pillar is one of four shapes. Write them once, reuse them everywhere.
Template 1, directional state of the external market. The external market X is in an uptrend (price above its moving average), so take or allow signals in the traded market. Example: trade the S&P long only when T-bonds are above their 50-day average. The external market acts as an on/off switch.
Template 2, inverse directional state. X is in a downtrend, so take signals in the traded market. Example: trade gold long only when the dollar index is below its average. This is template 1 with the sign flipped for a negatively correlated pair.
Template 3, divergence between X and the traded market. X moves one way while the traded market moves the way the correlation says it should not. Example: bonds rising while stocks fall, when the two normally move together, flags a dislocation that often resolves in the direction of the leading market. The article "Intermarket Divergence as a Trading Filter" develops this template in full.
Template 4, the ratio. Build the ratio of two markets and trade its position relative to its own moving average. Example: the T-bond / S&P ratio above its average favors bonds over stocks. The ratio collapses two price series into one signal series, and the article "Using Ratios as Trading Signals" handles its mechanics and traps.
$$ \text{Signal}_{\text{traded}} = \begin{cases} \text{enabled} & \text{if } X_t > \text{MA}_n(X) \quad \text{(template 1, positive link)}\\[4pt] \text{enabled} & \text{if } X_t < \text{MA}_n(X) \quad \text{(template 2, inverse link)} \end{cases} $$
The external market X gates the traded market by sitting above or below its own moving average of length n. For a positively correlated pair you enable when X is in an uptrend; for a negatively correlated pair you enable when X is in a downtrend. Templates 3 and 4 replace the simple threshold with a divergence test or a ratio, but the skeleton is identical: a second market decides whether the first market's signals are live.
Why a system trader bothers
Three reasons, each measurable, each tied to money.
The external market carries information the price chart does not. A breakout on the S&P chart is a function of S&P prices alone. Whether bonds are confirming or fighting that breakout is information from outside the chart, and adding it can split the breakout's outcomes into a cleaner set (bonds confirming) and a dirtier set (bonds fighting). The article "Why Cross-Asset Signals Beat Isolated Chart Reading" works this split with numbers.
The external market often leads. Eurodollars and short-rate markets tend to turn before the S&P at major inflection points; utility stocks have historically turned before both bonds and the broad market at major tops. A leading series is a forward-looking filter, which is rare and valuable, and the article "Lead-Lag Relationships in Global Markets" treats lead-lag as its own measurement problem rather than an article of faith.
The external market gives you diversification of signal source. A book built only on price-derived signals (moving averages, breakouts, oscillators) has one failure mode: it dies when price stops trending. A book that also conditions on cross-asset state has signals that fire for structurally different reasons, which is the only diversification that survives a regime where pure price systems all break at once.
The traps that kill naive intermarket systems
The honest part. Intermarket analysis is a data-mining minefield, and most published intermarket systems are overfit.
The correlation is non-stationary. Stock-bond correlation has been strongly positive in some decades and outright negative in others (the "risk-on/risk-off" regime flipped the sign for years). A system that hard-codes "bonds up is good for stocks" will pay for the years the sign inverts. You either re-estimate the link on a rolling window or you accept that the system has a regime where it is structurally wrong.
The search space is enormous. With dozens of candidate external markets, two directions, and a range of moving-average lengths, you can manufacture a beautiful intermarket filter from pure noise. This is the data-snooping problem the article "Why Works on All Markets Is Usually a Red Flag" warned about, multiplied by the number of external markets you let yourself test. The defense is to restrict the candidate set to economically motivated links before you touch the data, and to count every market you tried against your degrees of freedom.
The relationships lag in the wrong places. A few of the most-cited intermarket leads (the Dow 20 Bond Index as a bond-timing tool, for one) decayed badly once their composition or the market structure around them changed. A lead-lag relationship is itself a system, and like every system it gets switched off at some point, the acceptance the article "Why Systems Work Until They Don't" built into the framework.
Visualizing the intermarket web
KEY POINTS
- Intermarket analysis studies how markets move against each other. Two markets are related when the state of one shifts the forward-return distribution of the other, whether or not the story sounds plausible.
- The classic web: stocks and long bonds move together; bonds run inverse to inflation and commodities; gold runs inverse to rate markets; the dollar runs inverse to gold and commodities; foreign currencies run with bonds. Each link is a tendency that drifts, not a law.
- For a system trader the payoff is signal from outside the traded chart. A second market gates the first, and you measure whether the gate cleans up the forward-return distribution.
- Four rule templates cover almost everything: external market in an uptrend enables the traded market; external market in a downtrend enables it (inverse pair); divergence between the two against the expected correlation; and the ratio of two markets versus its own moving average.
- The three reasons to bother: the external market carries off-chart information, it often leads the traded market, and it diversifies the signal source so the book does not have a single price-driven failure mode.
- The traps: the correlations are non-stationary and the sign can invert for years; the candidate set of external markets makes data-snooping easy; and individual lead-lag relationships decay when market structure changes.
- The defense is to restrict the candidate links to economically motivated ones before touching the data, re-estimate the relationship on a rolling window, and count every market tested against the degrees of freedom.
- The rest of the intermarket arc instantiates the four templates on specific pairs: bonds filtering equities, gold against the dollar and rates, copper and crude as activity and inflation proxies, ratios, and divergence.
References
- Trading Systems and Methods - Perry Kaufman (Amazon)
- Cybernetic Trading Strategies - Murray Ruggiero (Amazon)
- The Art of Currency Trading - Brent Donnelly (Amazon)
- Trading with Intermarket Analysis: A Visual Approach to Beating the Financial Markets Using Exchange-Traded Funds
- Trading with Intermarket Analysis (Chapter 1: The Study of Relationships)
- Intermarket Analysis (Handbook of Trading)
- Lead–Lag Relationships in Market Microstructure
- Market Macrostructure: Institutions and Asset Prices
- Foreign Exchange Market Structure, Players and Evolution
- The Retail Spot Foreign Exchange Market Structure and Participants
- The anatomy of the global FX market through the lens of the 2013 Triennial Survey
- Dissecting the cycles: An intermarket investigation and its implications for portfolio management
- Ripples through markets: Inter-market impacts generated by large trades
- Dependence structure and extreme comovements in international equity and bond markets
- Intermarket Analysis: Profiting from Global Market Relationships
- Trading with Intermarket Analysis: A Visual Approach to Beating the Financial Markets Using Exchange-Traded Funds
- Commonality in liquidity
- Multiscale dynamic linkages of China’s financial markets under market stress: Evidence from stock, commodity, and bond markets
- Interconnectedness in the global financial market - ScienceDirect.com
A note on AI. The ideas, research, analysis, and conclusions in this article are my own. I use AI tools to help with editing and wordsmithing, because English is not my first language, and I am not shy about that. AI-generated ideas and AI-assisted writing are not the same thing: the first is empty slop from a generic prompt, the second is a tool for communicating years of real research more clearly. Judge the work by its substance, not by whether software helped polish the prose.