4.23 Lead-Lag Relationships in Global Markets
A leading market forecasts the one that follows, the rarest intermarket edge and the most fragile. Measure it with lagged cross-correlation, demand an economic reason, and expect it to decay.
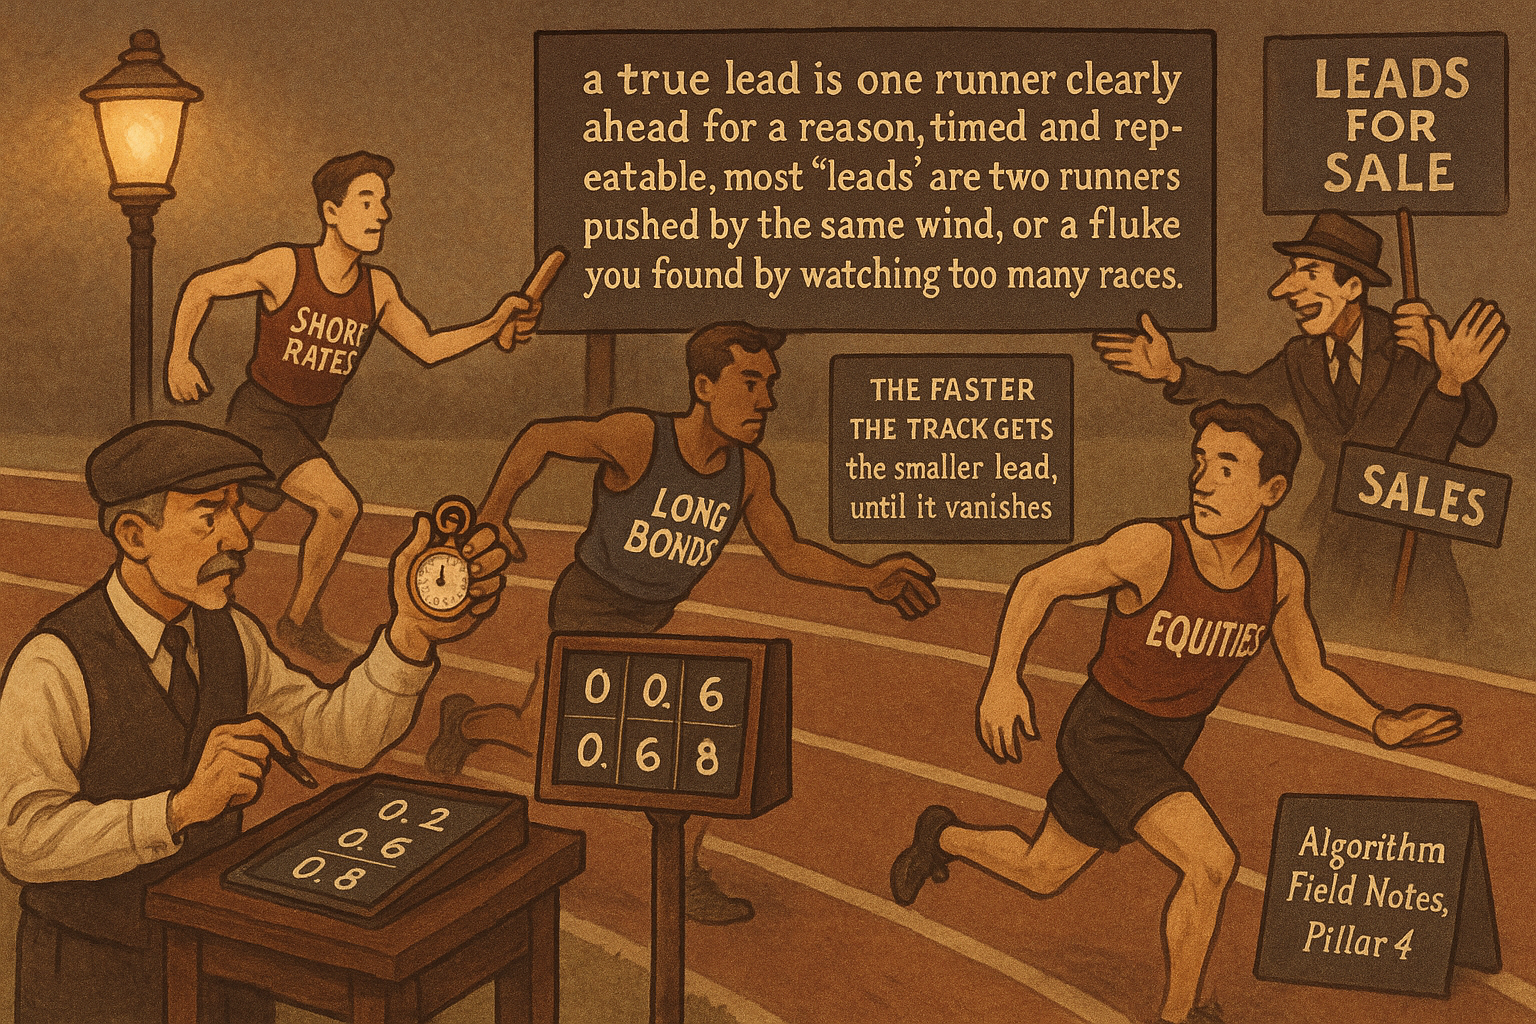
Short-term interest-rate markets turn before the long bond at major inflection points, and the long bond turns before the broad equity market. Gold-miner stocks turn before gold. Oil-producer stocks turn with or slightly ahead of crude. Each of these is a lead-lag relationship: one market moves first and a related market follows, with a measurable delay. A leading market is the rarest and most valuable thing in intermarket analysis, because it is a forward-looking signal, a read on where the lagging market is headed before the lagging market shows it.
The catch is that lead-lag is the most fragile relationship in the web. A correlation can be stable for decades; a lead can decay in a year, reverse without warning, or turn out to be an artifact of two markets sharing a slow common driver. The seductive part (knowing the future of one market by watching another) is exactly the part most likely to be a backtest illusion. This article treats lead-lag as a measurement problem with a high false-positive rate, not as a list of leads to trust.
It follows directly from "Cross-Asset Confirmation for Trend Systems", which left open the question of which market should confirm and when, and it feeds "From Intermarket Analysis to Network Momentum", where the lead-lag structure becomes a learned graph rather than a hand-picked pair.
Measuring a lead
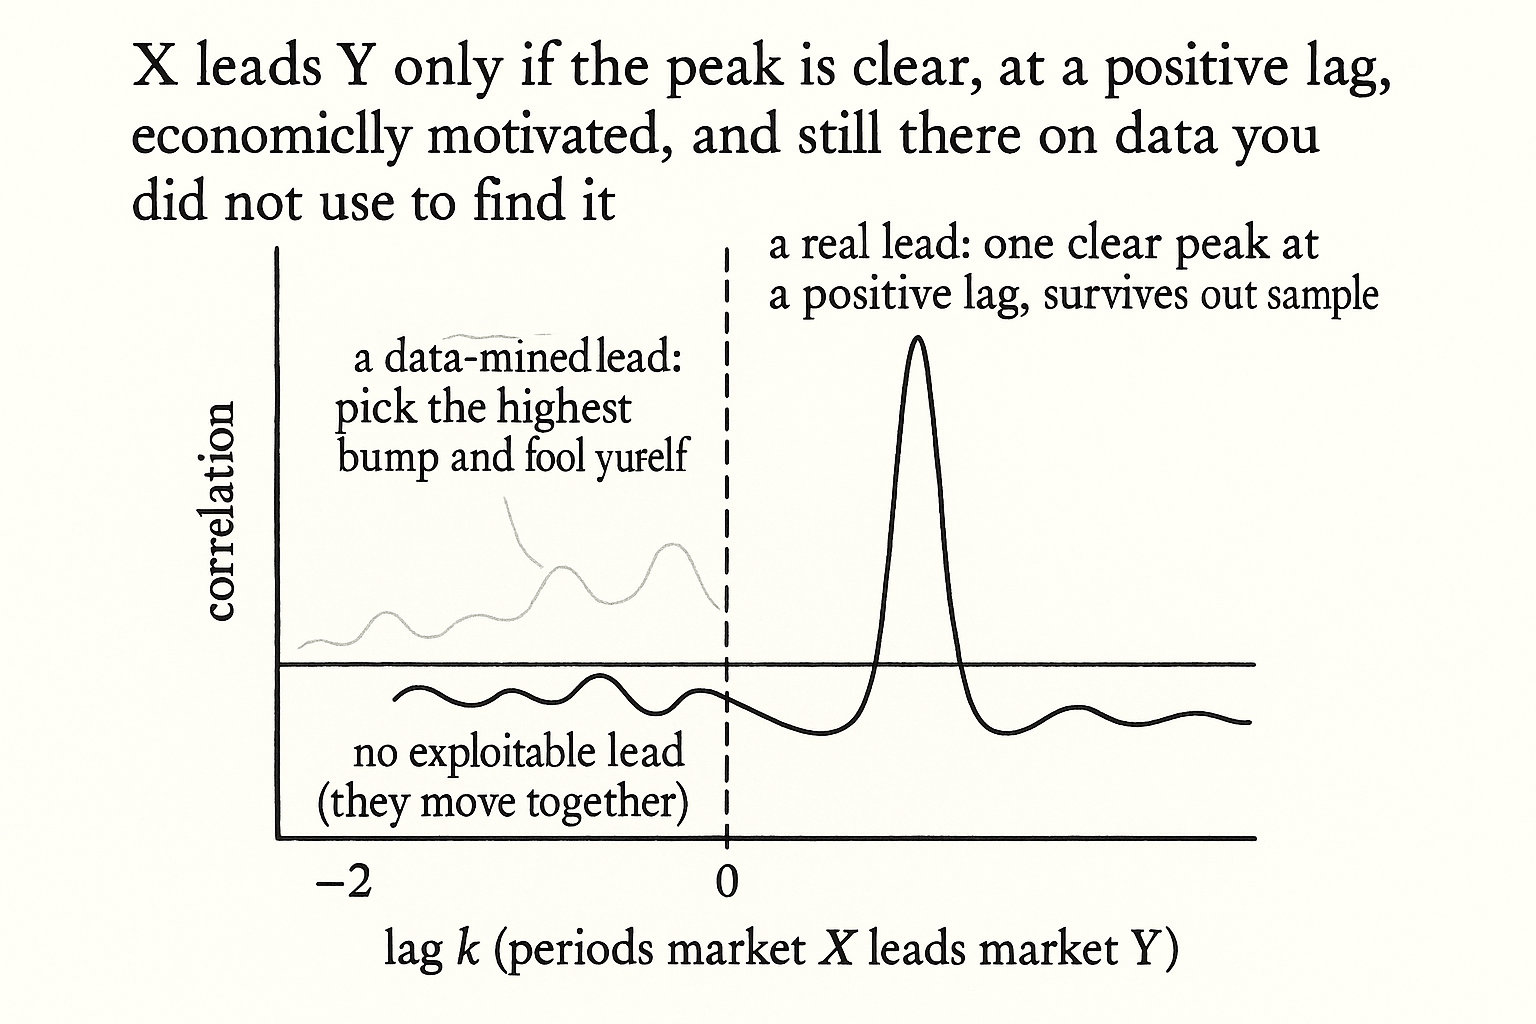
A lead-lag relationship is found by the lagged cross-correlation: correlate one market's returns today against another market's returns some number of periods later, and scan the lag that maximizes the correlation. If market X's returns at time t correlate most strongly with market Y's returns at time t plus k, then X leads Y by k periods.
$$ \rho_{XY}(k) = \text{corr}\big(X_t,\; Y_{t+k}\big), \qquad \hat{k} = \arg\max_{k} \,\rho_{XY}(k) $$
The lagged cross-correlation is the correlation between market X at time t and market Y at time t plus k, computed across a range of lags k. The estimated lead is the lag that maximizes it. A positive peak at a positive k says X leads Y by that many periods; a peak at k equal to zero says they move together with no exploitable lead. The signal you want is a clear, single peak at a positive lag that survives out of sample. The signal you usually get is a noisy curve with several near-equal bumps, and picking the highest bump is how lead-lag becomes data-mining.
The leads worth knowing
The classical leads cluster around markets that sit closer to the economic cause than the markets they lead.
Short rates lead long rates and equities, because short-rate markets price central-bank policy directly, and policy is upstream of both the long bond and the equity discount rate. Utility stocks have historically led the broad equity market and the bond market at major tops, because their rate sensitivity makes them an early casualty of rising yields. Gold-miner stocks lead gold, and oil-producer stocks lead or coincide with crude, because the equity of a producer discounts the future commodity price that the producer's earnings depend on, the relationship the article "Crude Oil, Inflation, and FX" used in reverse to read crude from the oil complex.
The common thread: the leader is the market with the most forward-looking participants or the tightest link to the underlying driver. A market that prices expectations leads a market that prices the present. That is the only economically defensible reason to expect a lead, and a lead without such a reason is a coincidence waiting to break.
Why most leads are illusions
The honest core of the article. Three mechanisms manufacture fake leads, and all three are common.
The shared slow driver. Two markets both driven by the same slow macro variable will show a lead-lag pattern in the data even when neither causes the other, purely because the common driver hits them with slightly different delays. This is the ice-cream-and-drowning problem: both rise in summer, neither causes the other. A lead found this way vanishes the moment the common driver behaves differently, and it gives you no real predictive power over the lagging market.
The arbitraged-away lead. A genuine, stable, exploitable lead is a free forecast, and free forecasts get traded until they disappear. The most-cited leads from decades past decayed as markets grew more efficient and faster, the way the article "Why Systems Work Until They Don't" framed every edge. A lead that was real in slow markets can be gone in fast ones.
The data-mined lead. Scan enough market pairs and enough lags and you will find impressive lead-lag correlations by chance. With dozens of markets and dozens of candidate lags, the number of combinations is huge, and the best one looks tradeable on the sample and is noise out of sample. The defenses are the ones the article "Induction in Trading: Why Past Patterns Are Always Uncertain" insisted on: restrict to economically motivated pairs before testing, demand a single clean peak rather than the best of many bumps, and confirm the lead holds on data you did not use to find it.
Using a lead without getting burned
If a lead survives the economic-reason test and out-of-sample validation, use it conservatively. Treat the leader as a confirmer or a tilt, not as a standalone signal, because even a real lead explains only a fraction of the lagging market's move. Size the bet to the strength of the lead, which the cross-correlation peak measures: a lead that explains a small slice of variance deserves a small tilt, not a full position.
Re-estimate the lead on a rolling window and watch for the peak migrating toward zero lag or splitting, which is the early sign the lead is decaying or inverting. A lead that was three days last year and is one day this year is on its way to zero, and a system that hard-codes the old lag will be trading a relationship that no longer exists, the slow-drift failure the article "Slow Wandering: The Most Dangerous Type of Market Change" warned about. The discipline is to trust the lead exactly as much as the current data supports and not one period more.
Visualizing the cross-correlation scan
KEY POINTS
- A lead-lag relationship is one market moving first and a related market following with a measurable delay. A leading market is a forward-looking signal, the rarest and most valuable thing in intermarket analysis.
- Lead-lag is also the most fragile relationship in the web: leads decay, reverse, or turn out to be artifacts of a shared slow driver. The most seductive part is the most likely to be an illusion.
- Measure a lead with the lagged cross-correlation: correlate market X at time t against market Y at time t plus k, and find the lag that maximizes it. A real lead is a single clean peak at a positive lag that survives out of sample.
- The defensible leads sit closer to the economic cause: short rates lead long rates and equities, utilities have led the market and bonds at tops, and producer stocks lead their commodity. A market pricing expectations leads a market pricing the present.
- Three mechanisms manufacture fake leads: a shared slow driver hitting both markets with different delays (the ice-cream-and-drowning trap), a real lead getting arbitraged away as markets speed up, and a data-mined lead from scanning too many pairs and lags.
- The defenses: restrict to economically motivated pairs before testing, demand a single clean peak rather than the best of many bumps, and validate on unused data.
- Use a surviving lead conservatively, as a confirmer or tilt rather than a standalone signal, and size it to the variance the lead actually explains.
- Re-estimate the lead on a rolling window and watch the peak migrate toward zero or split, the early sign of decay or inversion. Trust the lead exactly as much as current data supports.
References
- Trading Systems and Methods - Perry Kaufman (Amazon)
- Cybernetic Trading Strategies - Murray Ruggiero (Amazon)
- The Art of Currency Trading - Brent Donnelly (Amazon)
- Full article: Revisiting Cont's stylized facts for modern stock markets
- Identifying Noise Traders: The Head-And-Shoulders Pattern In U.S.
- Tocquevillean Association and the Market (Chapter 10)
- Seismic Characterization of Lahars on Volcán de Fuego Toward the
- Microstructure Evidence from the Polymarket Order Book - arXiv
- Reframing Financial Markets as Complex Systems
- A Classical Theory of Markets and Effectual Demand - D'Agata - 2026
- Temporal Graph Neural Networks for Traffic Prediction - arXiv
- Lead–lag relationships in foreign exchange markets
- The lead-lag relation between the stock and the bond markets
- Economic sources of asymmetric cross-correlation among stock returns
- Time-shift asymmetric correlation analysis of global stock markets
- Emergence and temporal structure of Lead–Lag correlations in collective stock dynamics
- Lead-Lag Relationships in Market Microstructure
- An Investigation of the Lead-Lag Relationship in Returns and Volatility between Cash and Stock Index Futures: The Case of Greece
- DeltaLag: Learning Dynamic Lead-Lag Patterns in Financial Markets
A note on AI. The ideas, research, analysis, and conclusions in this article are my own. I use AI tools to help with editing and wordsmithing, because English is not my first language, and I am not shy about that. AI-generated ideas and AI-assisted writing are not the same thing: the first is empty slop from a generic prompt, the second is a tool for communicating years of real research more clearly. Judge the work by its substance, not by whether software helped polish the prose.