4.24 From Intermarket Analysis to Network Momentum
Classical intermarket is a hand-drawn graph of a few edges. Network momentum learns the whole graph from prices and builds each asset's signal from its neighbors' momentum. Same equation, more edges.
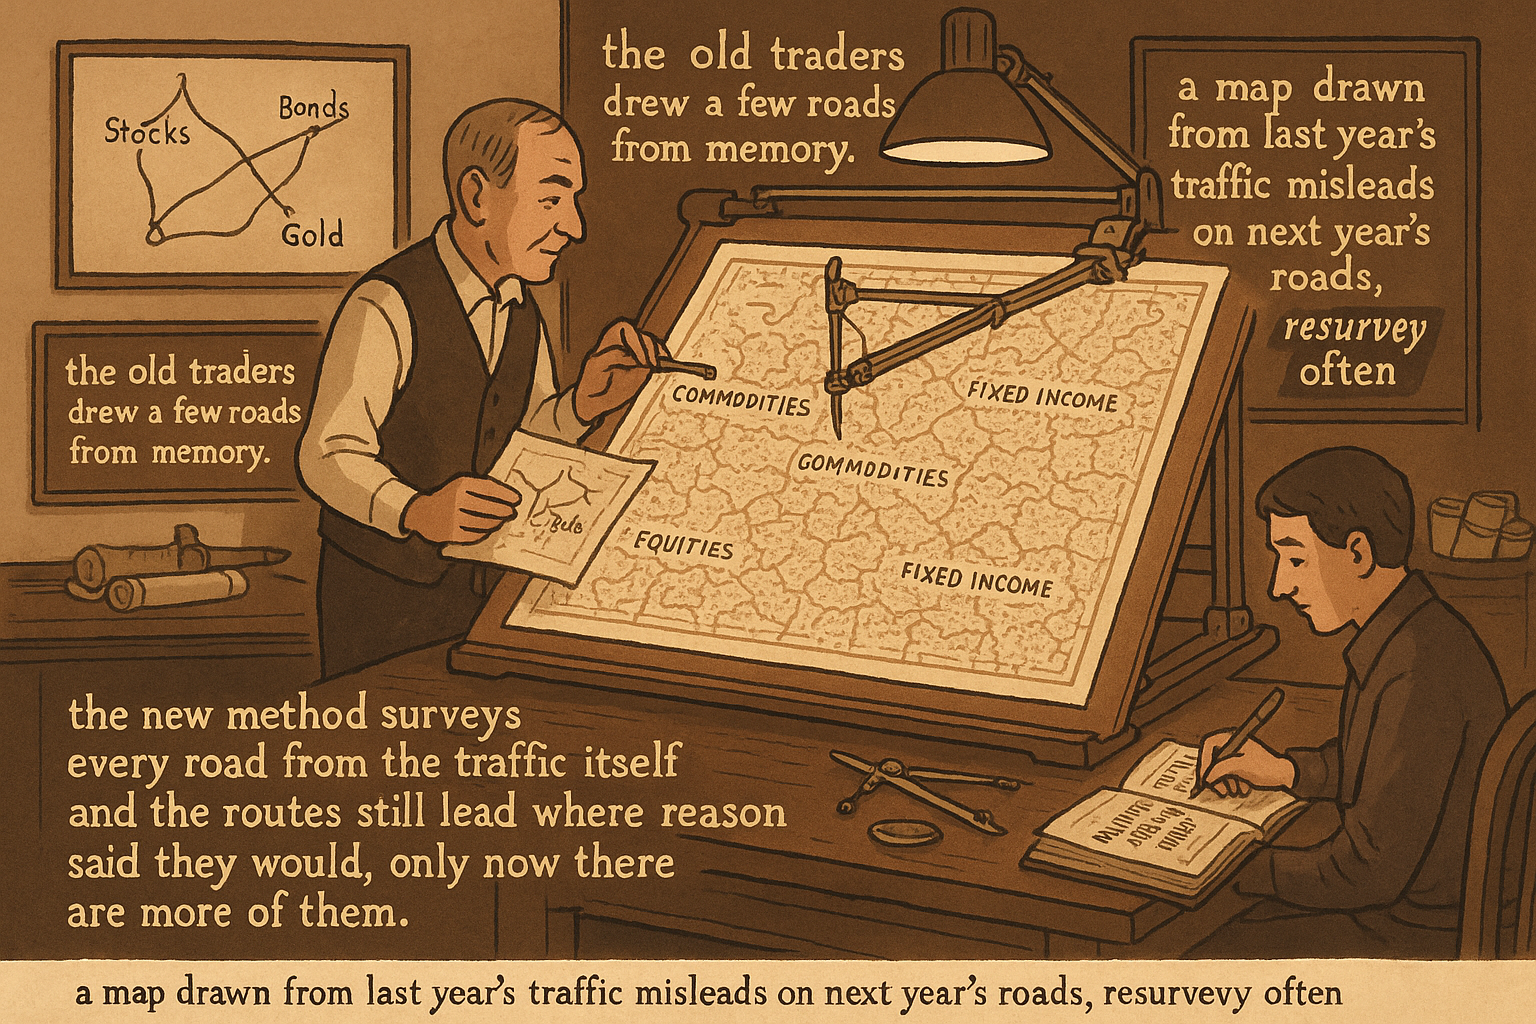
Classical intermarket analysis is a hand-drawn graph. A trader decides bonds link to stocks, gold links to the dollar, copper links to yields, and writes those edges in by hand from economic reasoning. The whole web in "Intermarket Analysis for System Traders" is maybe a dozen edges chosen by a human who knew the macro story. The obvious question, once you have built a few of these by hand, is whether you can stop guessing the edges and learn the entire graph from the price data itself, then let a signal flow along it. That is network momentum, and it is the natural endpoint of everything in this pillar.
The idea has one moving part. Momentum spills over between connected assets: when one asset trends, the assets linked to it tend to inherit a piece of that trend a little later. Classical intermarket already used this for single pairs (bonds leading stocks is momentum spilling from one to the other). Network momentum generalizes it from a pair to a whole graph, and from a hand-picked edge to a learned one. Instead of a trader asserting that bonds matter for stocks, an algorithm infers the connection strengths from how the assets' momentum features co-move, then builds each asset's signal from its neighbors.
This article closes the intermarket arc by reframing the hand-built web of the earlier articles as a special, sparse, human-specified case of a learned network. It builds on the lead-lag measurement from "Lead-Lag Relationships in Global Markets" and the confirmation logic from "Cross-Asset Confirmation for Trend Systems", both of which become automatic once the graph is learned.
The network momentum signal
The core construction is simple enough to write in one line. For a target asset, its network momentum signal is the weighted average of its neighbors' momentum, where the weights are the learned connection strengths.
$$ \text{NetMom}_i \;=\; \sum_{j \neq i} A_{ij}\,\text{Mom}_j, \qquad A_{ij} = \text{learned connection strength between assets } i \text{ and } j $$
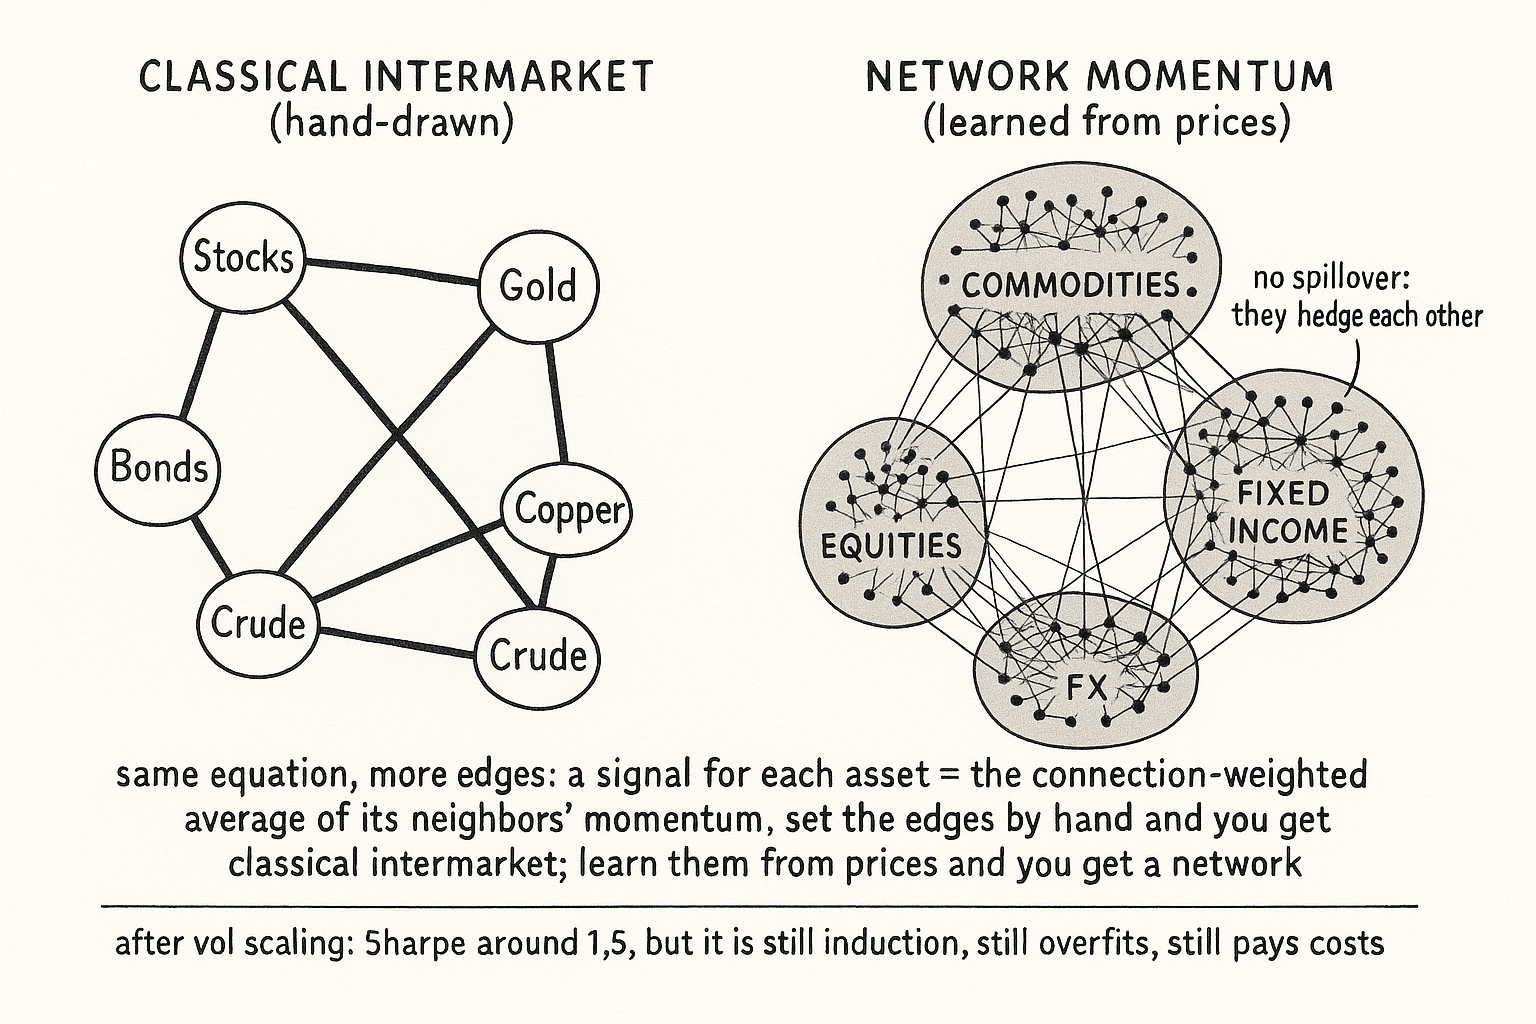
The network momentum of asset i is the sum over all other assets j of the connection strength between i and j times asset j's own momentum. The matrix A holds the graph: a large entry means a strong link, a zero means no link. Set A by hand with a dozen economic edges and you recover classical intermarket analysis. Learn A from the data across dozens of assets and you get network momentum. The equation is the same; the difference is who fills in the weights and how many there are.
The momentum that spills is the standard time-series kind: an asset's own recent trend, normalized by its volatility. The network turns each asset's individual momentum into a second signal built from its neighbors, and the two can be combined. An asset whose own momentum is flat but whose well-connected neighbors are all trending up inherits an upward network signal that its own chart does not show.
Learning the graph from prices alone
The practical breakthrough is that the graph is learned from pricing data, with no fundamental database, no company linkages, no sector tags. Earlier momentum-spillover work needed an explicit relationship to exist (two stocks of the same company, firms in a supply chain), which confined it to within-equity links. Learning the network from how momentum features co-move removes that constraint and lets the graph span asset classes, the thing classical intermarket analysis reached for with a handful of hand-drawn cross-asset edges.
A linear, interpretable graph-learning model is enough; the network does not require a black box. Run across 64 continuous futures spanning commodities, equities, fixed income, and currencies, the learned graph reproduces the macro intuition rather than contradicting it. The assets cluster into communities that match their asset classes. Commodities act as a bridge, connecting to the other three classes, which is the data's version of the copper-and-crude-feed-everything story from "Copper as an Economic Activity Indicator" and "Crude Oil, Inflation, and FX". Equities and fixed income show little direct spillover between them, consistent with the two being hedges that often move opposite, the same sign-instability the bond-equity filter had to manage.
What the empirical result says
The honest summary of what learning the graph buys you. A network momentum strategy built on the learned graph, after volatility scaling, posted a Sharpe ratio around 1.5 and an annual return near 22% over roughly 2000 to 2022. An end-to-end version that learns the network and optimizes the trading signal together pushed the Sharpe toward 1.7 over a comparable window. Those are strong numbers for a systematic multi-asset strategy, and the more important point is where they come from: a signal source that is neither each asset's own momentum nor a hand-coded intermarket rule, but the propagation of momentum across a graph inferred from prices.
The result also validates the whole premise of this pillar. Cross-asset information is real and tradeable, the claim "Why Cross-Asset Signals Beat Isolated Chart Reading" made with a single bond-equity split, now demonstrated across an entire learned network of assets. The hand-built intermarket web was a low-resolution sketch of a structure that, drawn at full resolution from the data, carries a measurable risk premium.
Why this does not retire the hand-built web
The skeptical balance, because a learned graph is not magic and the earlier articles still matter.
It is still induction. The learned graph is estimated from history, and like every relationship in this pillar it drifts; the connection strengths in a turbulent year differ from a calm one. A network learned on one regime degrades in the next, the inductive limit "Induction in Trading: Why Past Patterns Are Always Uncertain" applies to graphs as much as to single rules. Re-learning the graph on a rolling basis is mandatory, and even then the strategy carries the regime-change cost every system carries.
It has more parameters, so it overfits more easily. A graph over dozens of assets has far more free quantities than a dozen hand-drawn edges, and more free quantities means more ways to fit noise. The linear, interpretable, sparse formulation is what keeps this in check; a denser or more flexible model would fit the backtest beautifully and fail live, the warning from "Why Works on All Markets Is Usually a Red Flag" scaled up to a network. The economic reasoning behind the hand-built web is the sanity check on the learned one: when the learned graph reproduces the known macro communities, you trust it; when it asserts a strong link with no conceivable economic basis, you suspect overfit.
It does not remove costs. The strategy trades many assets, and the turnover, spreads, and slippage across 64 futures are real, the constraint "Why Transaction Costs Should Be Added Before You Fall in Love" puts on every multi-asset book. A Sharpe measured before costs is a different animal from one measured after, and the network's many small cross-asset tilts are exactly the kind of signal that can be eaten alive by execution if traded carelessly.
Visualizing the learned network
KEY POINTS
- Classical intermarket analysis is a hand-drawn graph: a human writes in about a dozen economic edges. Network momentum learns the entire graph from price data and lets a signal flow along it.
- The one moving part is momentum spillover: when one asset trends, its connected assets inherit a piece of that trend a little later. Network momentum generalizes this from a single pair to a whole graph.
- The signal in one line: an asset's network momentum is the connection-weighted average of its neighbors' momentum. Fill the connection matrix by hand and you recover classical intermarket; learn it from data and you get network momentum. Same equation, different source and scale.
- The graph is learned from prices alone, with no fundamental database, which lets it span asset classes where earlier spillover work was confined to within-equity company links.
- A linear, interpretable model is enough. Across 64 futures the learned graph reproduces macro intuition: assets cluster by class, commodities bridge to the other three, and equities and fixed income show little spillover because they hedge each other.
- Empirically, a vol-scaled network momentum strategy posted a Sharpe near 1.5 and about 22% annual return over roughly 2000 to 2022, with an end-to-end version near 1.7. The signal source is neither own-momentum nor a hand-coded rule but propagation across a learned graph.
- The result validates the pillar's premise: cross-asset information carries a real, tradeable risk premium, demonstrated across a whole network rather than a single bond-equity split.
- It does not retire the hand-built web. It is still induction and the graph drifts; it has more parameters and overfits more easily, kept in check by a sparse interpretable form and economic sanity checks; and it trades many assets, so costs are real and can eat the edge.
References
- Trading Systems and Methods - Perry Kaufman (Amazon)
- Cybernetic Trading Strategies - Murray Ruggiero (Amazon)
- The Art of Currency Trading - Brent Donnelly (Amazon)
- Network analysis of aggregated money flows in stock markets
- Revisiting Cont’s stylized facts for modern stock markets
- Foreign Exchange Volume: Sound and Fury Signifying Nothing?
- The Microstructure of Foreign Exchange Markets
- [2308.12212] Learning to Learn Financial Networks for Optimising
- Why Tokenised Securities Need Authoritative Market Records, Not
- This work has been submitted to IEEE Access for possible ... - arXiv
- Triangular Arbitrage, Market Microstructure, and Correlation
- Time Series Momentum
- Data as a Networked Asset: On the Network Topology of Variance Decompositions: Measuring the Connectedness of Financial Firms
- Using Network Method to Measure Financial Interconnection
- Correlation networks in economics and finance: A review of recent progress
- Mapping Momentum
- Dynamics of momentum in financial markets based on the
- A novel inter-intra graph neural networks for stock price forecasting
- Narrative Momentum
A note on AI. The ideas, research, analysis, and conclusions in this article are my own. I use AI tools to help with editing and wordsmithing, because English is not my first language, and I am not shy about that. AI-generated ideas and AI-assisted writing are not the same thing: the first is empty slop from a generic prompt, the second is a tool for communicating years of real research more clearly. Judge the work by its substance, not by whether software helped polish the prose.