4.17 Copper as an Economic Activity Indicator
Copper is almost pure industrial demand, so it reads activity before the statistics do and leads bond yields. Use it to gate bonds and growth assets, but a mine strike fakes the signal.
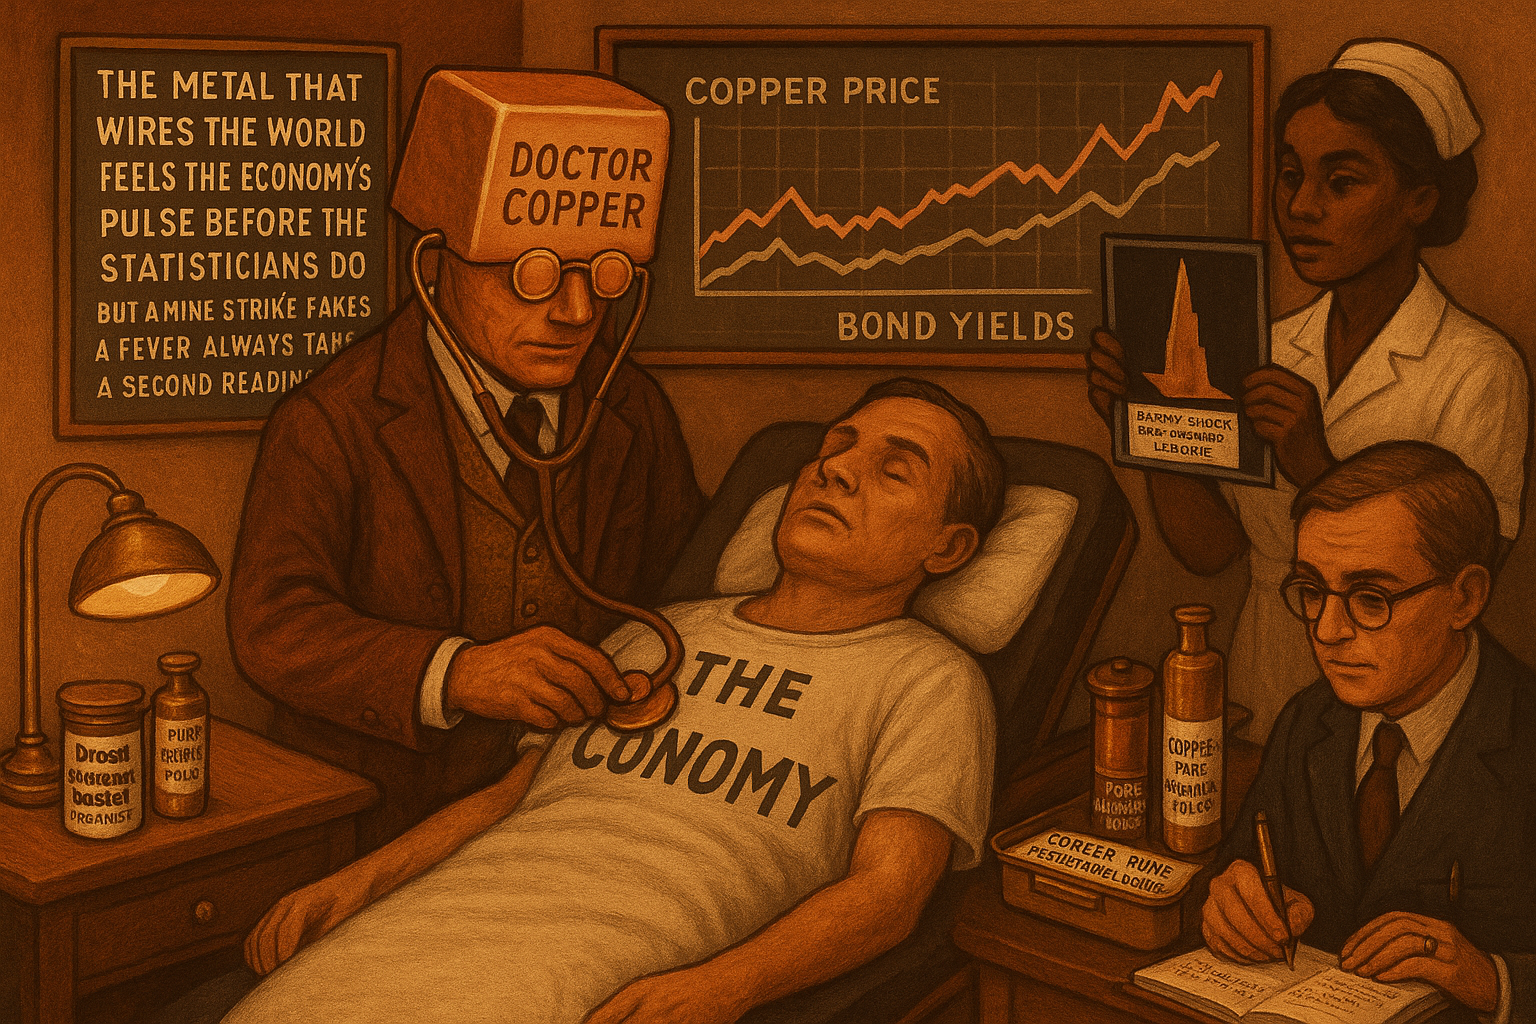
Copper goes into wiring, plumbing, motors, and construction, so the quantity of copper the world wants to buy this quarter is a direct read on how much building and manufacturing is happening. That physical fact gives copper a job no purely financial series can do: it measures real economic activity in close to real time, before the official statistics confirm it. Traders nicknamed it "Doctor Copper" for the joke that it holds an economics PhD, and the serious version of the joke is that copper's price leads the data that central banks and bond markets eventually react to. For an intermarket system, copper is the cleanest single proxy for the growth side of the macro picture.
This article makes the case that copper beats the broad commodity basket as an activity gauge, then turns copper into filters on bonds and growth-sensitive assets using the templates from "Intermarket Analysis for System Traders". It pairs with "Crude Oil, Inflation, and FX", which handles the inflation side of the commodity complex, so together they split the commodity world into its growth signal and its inflation signal.
Why copper beats the broad commodity index
The instinct is to use a broad commodity basket as the activity gauge, because a basket is diversified and stable. For measuring activity, the diversification works against you.
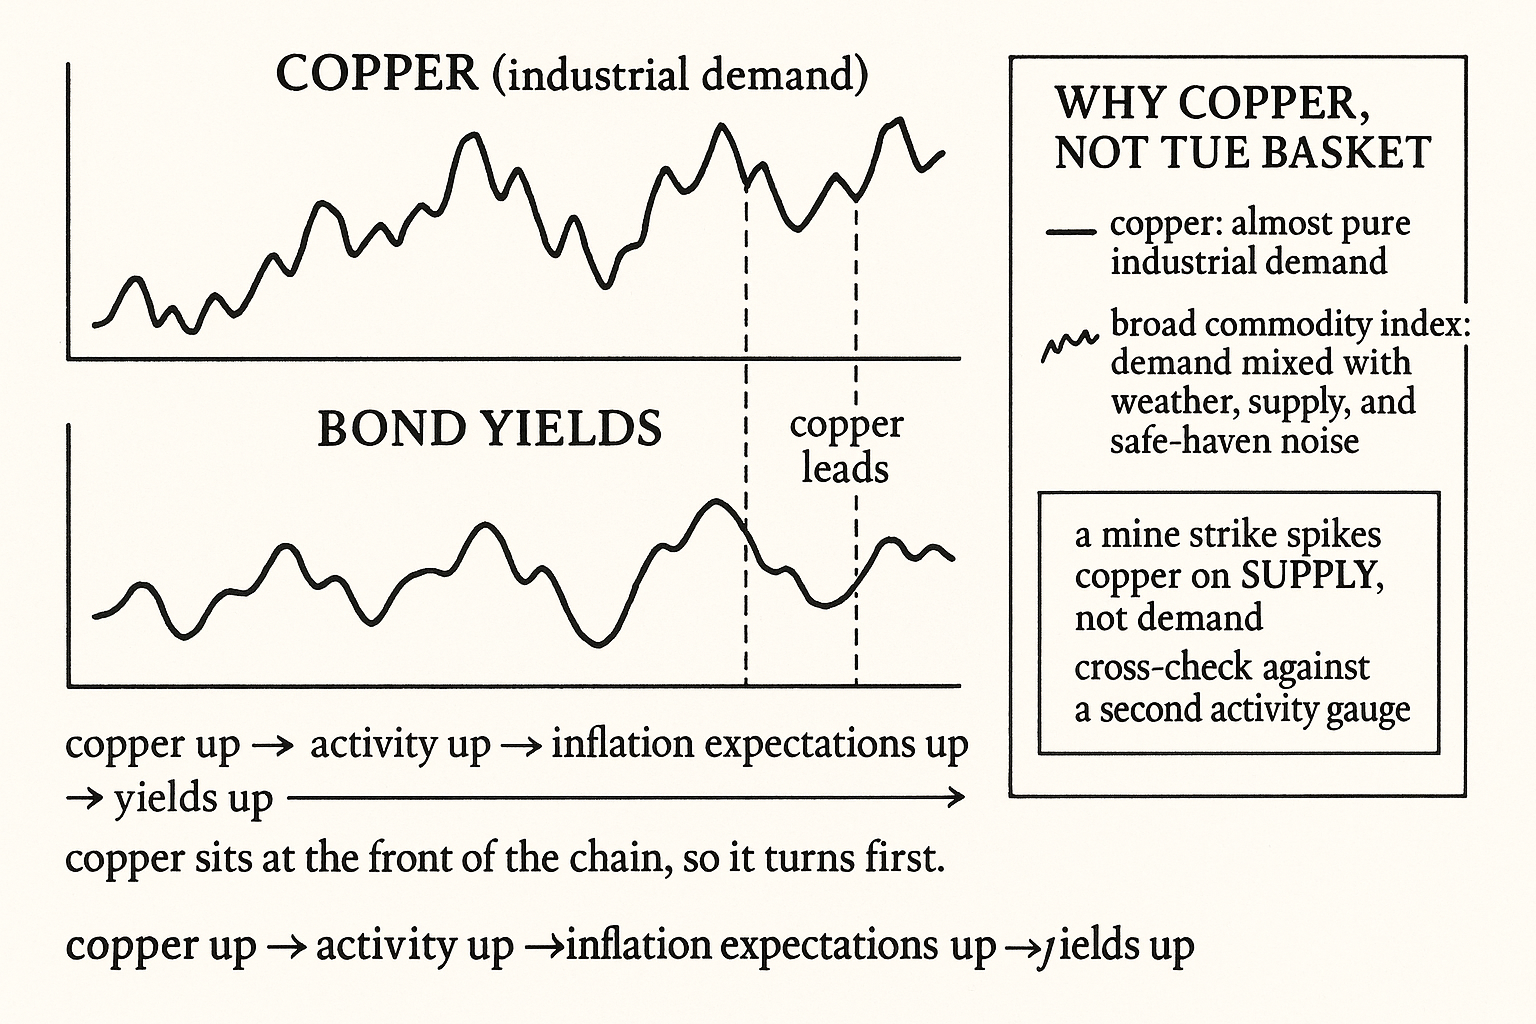
A broad commodity index mixes things driven by demand (industrial metals) with things driven by supply shocks and weather (grains, livestock, natural gas) and things driven by monetary fear (gold). The index average blends a clean growth signal with a pile of unrelated noise, so it tracks activity loosely. Copper is almost pure industrial demand. It has no significant safe-haven bid, no weather-driven supply spikes on the scale of agriculture, and its consumption maps directly to construction and manufacturing. The narrower instrument carries the cleaner signal, the same reason the article "Why One Indicator Should Not Be Used on Every Market" argued a sharp single-purpose tool beats a blunt general one.
Lumber sits in the same category for the same reason: it is a direct read on housing and construction, and historically it has led activity and bond yields. The general principle is to pick the commodity whose demand is closest to the economic variable you want to measure, rather than averaging everything and hoping the signal survives the blend.
The copper-bond link
Copper's most useful intermarket relationship is its inverse link to bond prices, which is really a positive link to yields.
Rising copper means rising industrial demand, which means a strengthening economy, which means rising inflation expectations and a central bank more likely to hold or raise rates. All of that pushes bond yields up, so bond prices down. Copper up, yields up, bonds down. The chain runs through real activity and inflation expectations, and copper sits at the front of it because the physical demand registers in the price before the inflation prints arrive.
$$ \text{Copper} \;\uparrow \;\Rightarrow\; \text{activity} \;\uparrow \;\Rightarrow\; \text{inflation expectations} \;\uparrow \;\Rightarrow\; \text{yields} \;\uparrow \;\Rightarrow\; \text{bond price} \;\downarrow $$
The chain reads left to right: rising copper signals rising activity, which lifts inflation expectations, which lifts yields, which lowers bond prices. Because copper sits at the front of the chain and bonds at the back, copper tends to lead bonds at turning points, which is what makes it a forward-looking filter rather than a coincident one, the lead-lag property the article "Lead-Lag Relationships in Global Markets" treats as its own measurement.
Copper as a filter
Two filters fall out of the chain, both using the simple state templates.
Bond/rate filter. Suppress long-bond signals when copper is in a strong uptrend (copper above its moving average and rising), because rising copper is a forward warning of rising yields and falling bond prices. Allow long-bond signals when copper is weak or falling, because slowing activity points to falling yields and rising bond prices. Copper gates the bond system from outside the bond market.
Growth-asset filter. Use copper as a risk-on/risk-off gate for growth-sensitive positions. When copper is trending up, the growth backdrop is supportive, so enable cyclical and equity-trend signals. When copper rolls over, the growth backdrop is deteriorating, so reduce or suppress them. This is the same logic as the bond filter pointed at the equity side, and it complements the bond-equity gate from "Using Bonds to Filter Equity Signals" by adding an activity reading the bond price alone does not give.
A worked sketch on a long-bond trend system: gating out long-bond entries during strong copper uptrends removes a cluster of trades that fight a rising-yield backdrop, lifting the per-trade quality of the remaining long-bond signals. The filter does not change the bond system's logic; it removes the macro condition under which that logic is structurally disadvantaged.
The traps with copper
Where the "Doctor Copper" story misleads if you take it too literally.
Supply shocks override demand. Copper is mined in a handful of countries, and a major mine strike, a political disruption in a key producer, or an export ban can spike the price for reasons that have nothing to do with global demand. During such a spike, copper is signaling supply scarcity, not booming activity, and reading it as an activity surge is wrong. The fix is to cross-check copper against a second activity proxy (lumber, an industrial-production nowcast) and distrust copper moves that no other activity series confirms, the cross-check discipline the article "Why Cross-Asset Signals Beat Isolated Chart Reading" built in.
Financialization adds noise. Copper is now a heavily traded financial asset, not just an industrial input, so speculative flows and dollar moves push it around on horizons shorter than the activity signal it is supposed to measure. The activity signal lives at the weekly-to-monthly scale; the daily wiggle is mostly financial noise. Reading copper on too short a timeframe is reading the noise, the timeframe-matching point from "How to Choose the Right Timeframe for a Strategy".
The link to yields is not constant. Like every intermarket relationship in this pillar, the copper-yield correlation drifts and can weaken when monetary policy is driven by factors other than activity. Re-estimate the relationship on a rolling window rather than assuming it holds, the slow-drift discipline that applies to every edge in the web.
Visualizing copper as the lead
KEY POINTS
- Copper goes into wiring, plumbing, motors, and construction, so demand for it is a near real-time read on real economic activity, ahead of the official statistics. That earns it the "Doctor Copper" nickname.
- Copper beats a broad commodity basket as an activity gauge because the basket blends demand-driven metals with weather-driven grains, supply-driven energy, and fear-driven gold. The narrow instrument carries the cleaner signal. Lumber works for the same reason on housing.
- The core link is copper up, activity up, inflation expectations up, yields up, bond price down. Copper sits at the front of that chain and bonds at the back, so copper tends to lead bonds at turning points.
- Bond filter: suppress long-bond signals during strong copper uptrends (a forward warning of rising yields) and allow them when copper is weak. Copper gates the bond system from outside the bond market.
- Growth-asset filter: use copper as a risk-on/risk-off gate for cyclical and equity-trend signals, enabling them when copper trends up and reducing them when it rolls over. This adds an activity reading the bond price alone does not provide.
- Trap one: supply shocks (mine strikes, export bans) spike copper for reasons unrelated to demand. Cross-check against a second activity proxy and distrust copper moves nothing else confirms.
- Trap two: copper is financialized, so daily moves are mostly speculative and dollar-driven noise. The activity signal lives at the weekly-to-monthly scale; reading copper too short captures the noise.
- Trap three: the copper-yield correlation drifts and weakens when policy is driven by non-activity factors. Re-estimate on a rolling window rather than assuming it holds.
References
- Trading Systems and Methods - Perry Kaufman (Amazon)
- Cybernetic Trading Strategies - Murray Ruggiero (Amazon)
- The Art of Currency Trading - Brent Donnelly (Amazon)
- Bond Yields, Sovereign Risk and Maturity Structure by Marcos
- The Market Microstructure of Central Bank Bond Purchases - jstor
- Measuring Liquidity in Bond Markets - jstor
- Bitcoin spot and futures market microstructure - Wiley Online Library
- Measuring Global Economic Activity
- A Comparison of Monthly Global Indicators for Forecasting Growth
- Commodity-price comovement and global economic activity
- Copper demand, supply, and associated energy use to 2050
- Scenarios for anthropogenic copper demand and supply in China: implications of a scrap import ban and a circular economy transition
- Forecasting copper prices with dynamic averaging and selection models
- Co-movement of international copper prices, China's economic activity, and stock returns: Structural breaks and volatility dynamics
- Copper-to-Gold Ratio as a Leading Indicator for the 10-Year Treasury Yield
A note on AI. The ideas, research, analysis, and conclusions in this article are my own. I use AI tools to help with editing and wordsmithing, because English is not my first language, and I am not shy about that. AI-generated ideas and AI-assisted writing are not the same thing: the first is empty slop from a generic prompt, the second is a tool for communicating years of real research more clearly. Judge the work by its substance, not by whether software helped polish the prose.