4.16 Gold, Dollar, and Rates: A Practical Intermarket Map
Gold, the dollar, and rates form a closed triangle: rates up, dollar up, gold down. Pin two corners and the third follows. But gold tracks real yields and the triangle jams in a crisis.
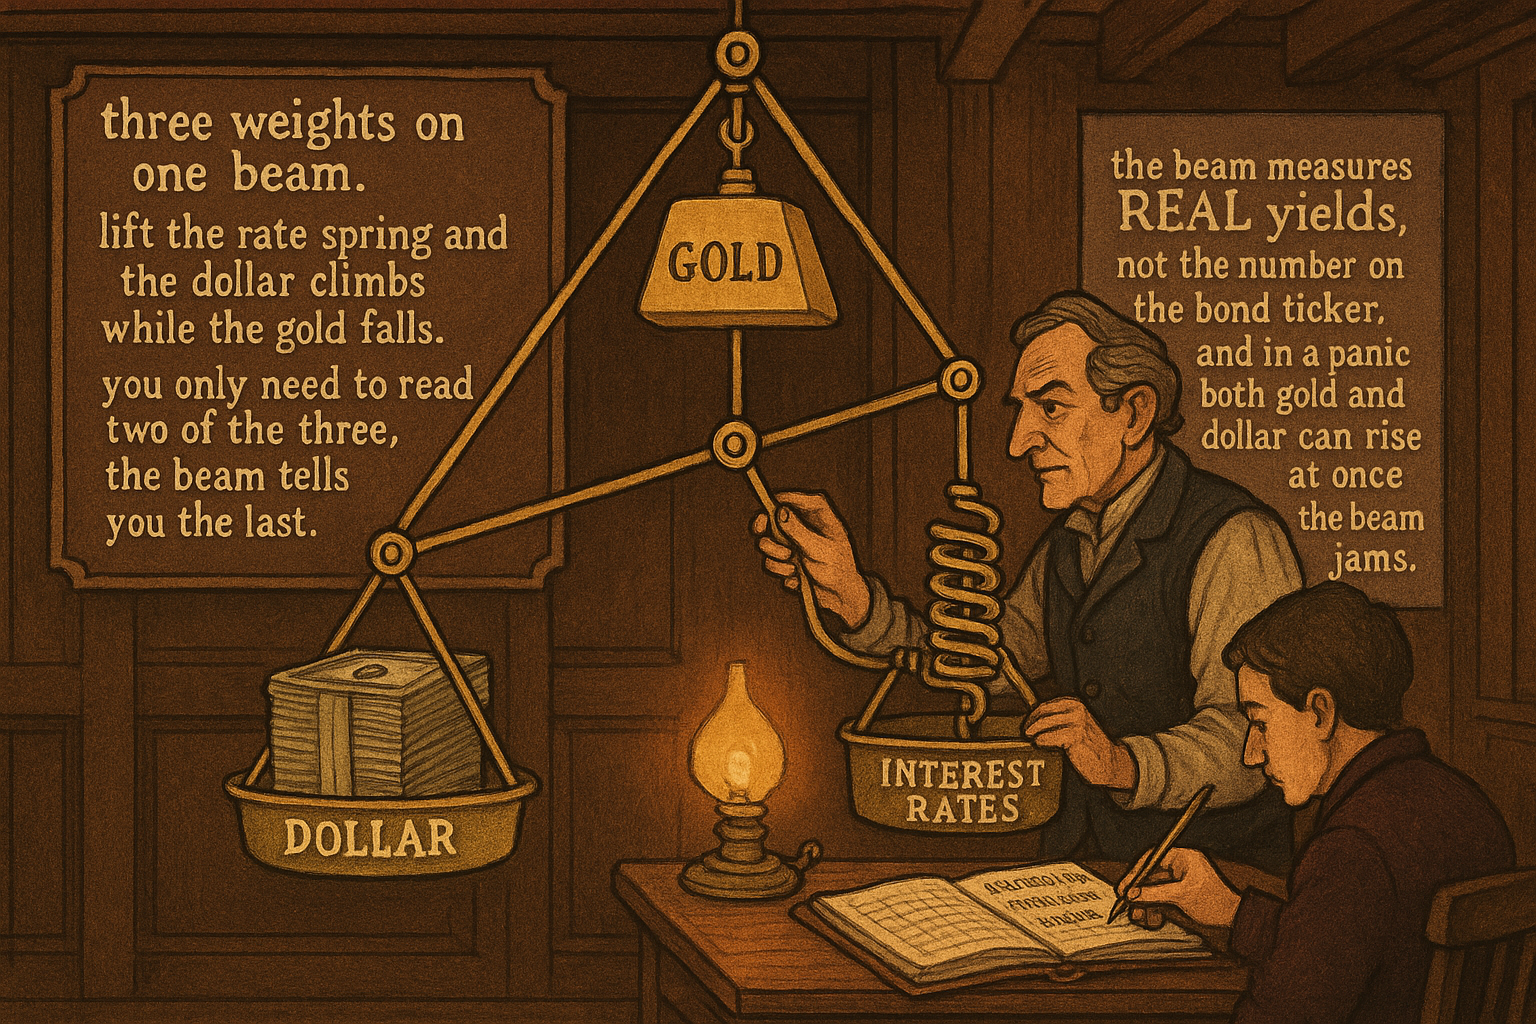
Three instruments sit at the center of every macro intermarket system: gold, the US dollar, and the interest-rate complex. They form a tight triangle. Gold runs inverse to real interest rates, because gold pays no coupon and loses its appeal when bonds and cash pay more. The dollar runs inverse to gold, because gold is priced in dollars and a stronger dollar buys more of it. Rates drive the dollar, because higher US rates pull capital toward dollar assets and lift the currency. Pin down two corners of that triangle and the third is largely determined, which is what makes it a practical map rather than a list of trivia.
This article draws the gold-dollar-rates triangle, gives each edge its mechanism and its sign, and turns the map into concrete filters using the rule templates from "Intermarket Analysis for System Traders". It feeds directly into the FX-focused articles later in the pillar, "Why FX Traders Must Watch Gold, Rates, and Equities" and "Using Gold as an FX Indicator", which apply this triangle to currency trading.
The three edges
Edge one, gold against rates. Gold is a zero-yield asset. When real yields rise, holding gold means giving up the yield you could earn in bonds or cash, so gold weakens. When real yields fall (or go negative), the opportunity cost of holding gold drops and gold strengthens. The link is to real yields (nominal yield minus inflation), not nominal yields, which matters because gold can rise alongside rising nominal rates if inflation is rising faster. This is the subtlety that trips up traders who watch the nominal ten-year and wonder why gold is not cooperating.
Edge two, dollar against gold. Gold is quoted in dollars per ounce. Hold the global demand for gold roughly constant and a stronger dollar mechanically lowers the dollar price of gold, because each dollar is worth more gold. The two trade inverse over most samples. The inverse is not mechanical-only; the dollar and gold are also competing safe-haven and store-of-value assets, so capital rotating between them reinforces the negative correlation.
Edge three, rates against the dollar. Higher US short rates, relative to the rest of the world, make dollar deposits more attractive and pull capital into the dollar, lifting it. This is the carry mechanism: money flows toward the higher risk-adjusted yield. Falling US rates do the reverse, weakening the dollar and, by edge two, supporting gold. The triangle closes: rates up, dollar up, gold down; rates down, dollar down, gold up.
$$ \text{Gold} \;\downarrow\; \text{as real rates} \;\uparrow, \qquad \text{Dollar} \;\uparrow\; \text{as US rates} \;\uparrow, \qquad \text{Gold} \;\downarrow\; \text{as Dollar} \;\uparrow $$
The three relations are consistent: a rise in real US rates lifts the dollar and weighs on gold through two reinforcing channels (the opportunity-cost channel directly on gold and the dollar-strength channel on gold's price). When two of the three corners agree, the third is confirmed; when they disagree, one of the edges is in a regime shift and the map is warning you, the divergence logic the article "Intermarket Divergence as a Trading Filter" formalizes.
Turning the triangle into filters
Each edge is a ready-made gate, using template 1 and template 2 from the intermarket overview.
Gold long, gated by the dollar. Allow long-gold signals only when the dollar index is below its moving average (template 2, inverse pair). A falling dollar is the tailwind; a rising dollar fights every long-gold trade. The same gate inverted (short gold only when the dollar is above its average) handles the other side.
Gold long, gated by rates. Allow long-gold signals only when the rate proxy is falling (bond price above its average, since bond price up means yields down). Rising real yields are gold's structural headwind, so suppressing long-gold trades into rising yields removes a predictable losing condition.
Dollar long, gated by rates. Allow long-dollar signals only when the US short-rate trend is up relative to a foreign benchmark. The dollar is a carry vehicle, and trading it with the rate differential rather than against it aligns the position with the dominant flow.
The most robust setups require two corners to agree. A long-gold trade taken only when the dollar is below its average and bonds are above theirs (yields falling) is gated by two reinforcing edges, which cuts the trade count and lifts the per-trade quality. Fewer trades, cleaner distribution, the same trade-off the article "Using Bonds to Filter Equity Signals" described for a single gate, doubled.
Worked example: gold conditioned on two corners
Numbers, because the map is useless without them. Take a long-gold trend system and three states.
Unconditioned long-gold trades: suppose a hit rate of 48% and a small positive average trade.
Gated on the dollar alone (dollar below its 50-day average): hit rate near 54%, larger average trade, roughly 60% of the original trade count retained.
Gated on both corners (dollar below its average and bonds above theirs): hit rate near 58%, the largest average trade, but only about 35% of the original trade count retained.
The double gate produces the best per-trade quality and the fewest trades. Whether that is the right setting depends on whether you have enough trades left for the result to be reliable, the sample-size constraint the article "Trade-Count Thresholds for Backtest Reliability" insisted on. Gate too hard and you end up with twenty trades and a beautiful, meaningless hit rate.
Where the triangle breaks
The honest caveats, because this triangle is more stable than the stock-bond link but still drifts.
The real-rate subtlety dominates. Gold tracks real yields, and real yields require an inflation estimate that is itself noisy and lagged. In a sudden inflation spike, nominal yields can rise while real yields fall, and gold rallies against what a nominal-rate watcher expects. A system that gates gold on nominal bond prices will misfire in exactly those high-inflation regimes where gold matters most. Using a real-yield proxy (or a breakeven-inflation series) fixes this, at the cost of more data plumbing.
The dollar is not one thing. "The dollar" usually means a trade-weighted index dominated by the euro. Gold's inverse relationship to the dollar index can weaken when the euro is moving for idiosyncratic European reasons unrelated to gold. The article "FX Is Not One Market: Retail vs Wholesale Structure" makes the broader point that a currency index hides as much as it shows.
The safe-haven regime scrambles signs. In a genuine crisis, gold and the dollar can both rally as everything else is sold, breaking edge two for the duration. The triangle is a normal-regime map, and like every relationship in this pillar it gets switched off when the regime changes, the acceptance built into "Why Systems Work Until They Don't".
Visualizing the triangle
KEY POINTS
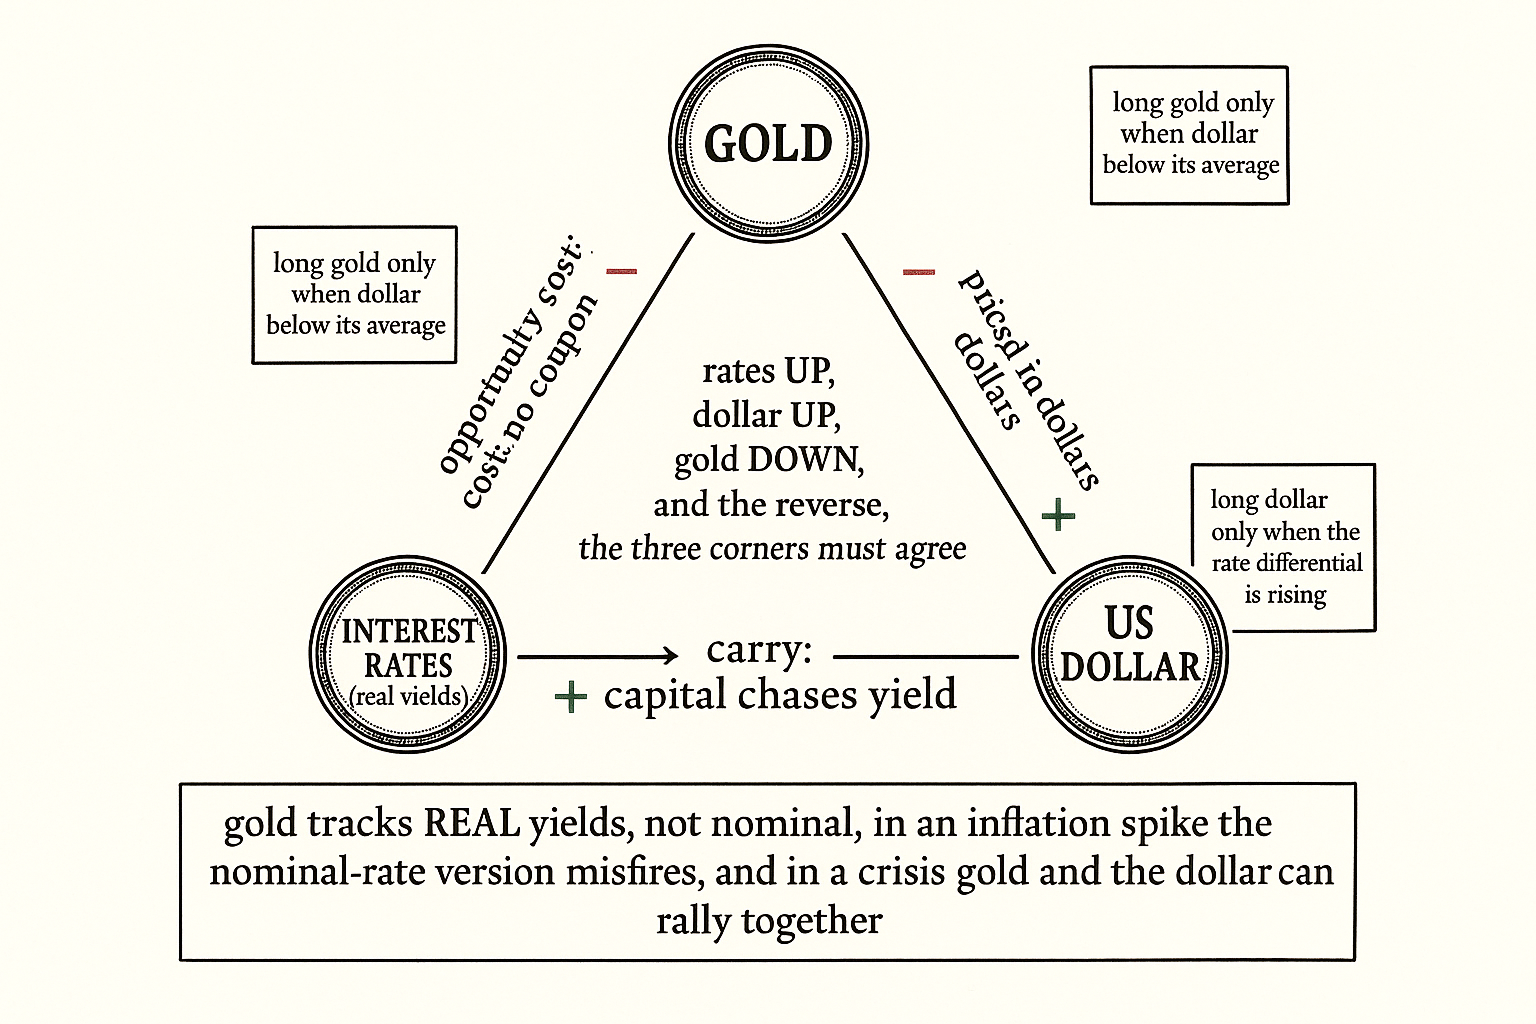
- Gold, the dollar, and rates form a tight triangle. Gold runs inverse to real yields (it pays no coupon), the dollar runs inverse to gold (gold is priced in dollars), and rates drive the dollar (capital chases yield).
- The triangle is internally consistent: rates up, dollar up, gold down, and the reverse. Pin down two corners and the third is largely determined; when two corners disagree, one edge is shifting and the map is warning you.
- Each edge is a filter. Gate long-gold on a falling dollar, gate long-gold on falling yields (bonds above their average), and gate long-dollar on a rising rate differential. The most robust setups require two corners to agree.
- Worked example: an unconditioned long-gold system at 48% hit rate rises to 54% gated on the dollar alone and 58% gated on both the dollar and bonds, but the double gate retains only about a third of the trades.
- The double gate trades quantity for quality. Gate too hard and you are left with too few trades for the result to be reliable; balance per-trade quality against sample size.
- Gold tracks real yields, not nominal. In an inflation spike, nominal yields can rise while real yields fall and gold rallies against a nominal-rate watcher's expectation. Use a real-yield or breakeven proxy.
- The dollar index is dominated by the euro and can move for European reasons unrelated to gold, weakening edge two. A currency index hides as much as it shows.
- In a genuine crisis gold and the dollar can both rally, breaking the inverse edge. The triangle is a normal-regime map and gets switched off when the regime changes.
References
- Trading Systems and Methods - Perry Kaufman (Amazon)
- Cybernetic Trading Strategies - Murray Ruggiero (Amazon)
- The Art of Currency Trading - Brent Donnelly (Amazon)
- Gold and U.S. Treasuries as Competing Safe Assets
- Dollar Safety and the Global Financial Cycle
- Monetary Policy and Exchange Rate Returns: Time-Varying Risk Premia in Currency Markets
- Full article: Revisiting Cont's stylized facts for modern stock markets
- Identifying Noise Traders: The Head-And-Shoulders Pattern In U.S.
- The relationship between gold price and the American financial
- No. 8/2026
- Reframing Financial Markets as Complex Systems
- Gold's Value as an Investment
- The Golden Dilemma
- Gold and the Dollar (and the Euro, Pound, and Yen)
- Can gold hedge and preserve value when the US dollar depreciates?
- Understanding the Profitability of Currency-Trading Strategies
- Currency Carry Trades
- What Drives Fluctuations in Exchange Rates? An Asset Market Perspective
- The Term Structure of Currency Carry Trade Risk Premia
A note on AI. The ideas, research, analysis, and conclusions in this article are my own. I use AI tools to help with editing and wordsmithing, because English is not my first language, and I am not shy about that. AI-generated ideas and AI-assisted writing are not the same thing: the first is empty slop from a generic prompt, the second is a tool for communicating years of real research more clearly. Judge the work by its substance, not by whether software helped polish the prose.