4.6 Why One Indicator Should Not Be Used on Every Market
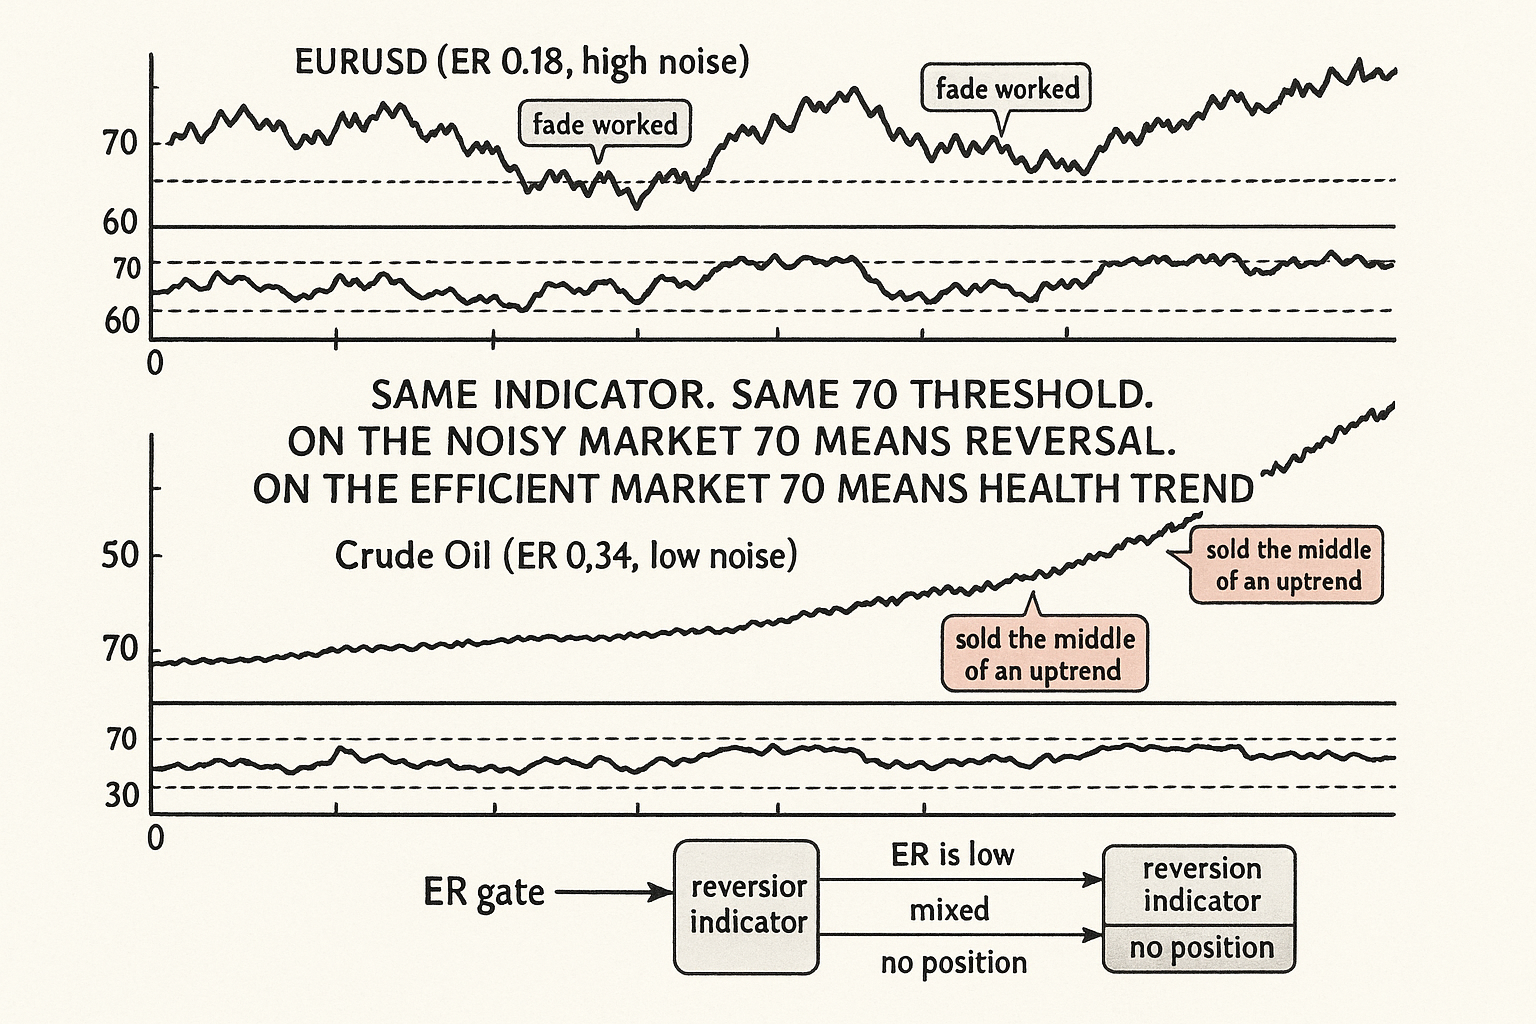
One indicator means opposite things across noise regimes: RSI 70 reverses on EURUSD but marks a healthy uptrend on crude. Gate the family on the efficiency ratio, don't force one parameter set.

A trader builds a 14-period RSI mean-reversion rule, buy below 30 and sell above 70, and it works beautifully on EURUSD. Encouraged, the trader applies the same 14-period RSI with the same 30/70 thresholds to crude oil, to BTC, and to the SPX, and reports the blended result to show "the indicator is robust across markets". The blended result is mediocre, and the trader concludes the edge was weak. The edge was not weak. The 14-period RSI at 30/70 is a high-noise mean-reversion tool, and it was deployed on markets with completely different noise structures where the same overbought reading means a different thing. The indicator did not generalize because indicators do not generalize across noise regimes; they are calibrated to one.
This article is the operational consequence of the trend-reversion split from the previous two articles. "High Noise Markets Are Mean-Reversion Markets" and "Low Noise Markets Are Trend-Following Markets" established that the noise level determines which family works. This article goes one level finer: even within a family, a single indicator with a single parameter set encodes assumptions about noise, volatility, and horizon that hold on one market and break on another. The article "Why Works on All Markets Is Usually a Red Flag" warned about cross-market robustness claims; this is the indicator-level mechanism behind why those claims fail.
An indicator is a bet on a specific market structure
Every indicator has hidden parameters that are really assumptions about the market it was built for. A 14-period RSI assumes that 14 bars is the horizon over which overbought and oversold conditions resolve. A 70 threshold assumes a return distribution where the 70 level is reached often enough to trade but rarely enough to mean something. A 20-day breakout assumes that 20 days is long enough to filter noise but short enough to catch trends. Change the market and you change the horizon at which conditions resolve, the return distribution, and the noise level, which means the indicator's hidden assumptions no longer match.
Consider the overbought threshold concretely. On a high-noise market like EURUSD, an RSI of 70 is a genuine extreme that tends to revert, because the market mean-reverts at that horizon. On a low-noise trending market like a crude-oil run, an RSI of 70 is not an extreme at all; it is what a healthy uptrend looks like, and it can stay above 70 for weeks while the trend continues, the exact behavior the source material on the Commodity Channel Index noted when prices stay overbought during strong moves. Selling at 70 on the trending market is selling the middle of an uptrend. Same indicator, same threshold, opposite meaning, because the noise structure flipped. The article "Why You Should Test Long and Short Thresholds Separately" made the related point that even within one market the long and short thresholds carry different information; across markets the asymmetry is larger.
The three things that change across markets
When you move an indicator from one market to another, three structural properties change, and each one invalidates a different part of the indicator's calibration.
Property 1: the noise level. This determines whether the indicator should be a trend tool or a reversion tool at all, and it is the largest of the three. An RSI used as a reversion signal assumes the market reverts; on a low-noise market it does not, and the signal inverts in meaning. The article "Efficiency Ratio Explained for Traders" gives the measurement; the indicator's family has to match the market's efficiency ratio.
Property 2: the volatility level and shape. This determines the thresholds. A fixed 30/70 RSI band or a fixed-point breakout distance assumes a particular volatility; on a market with twice the volatility, the same band is reached twice as often and means half as much. The article "Why ATR Normalization Is More Than a Volatility Trick" gave the fix: normalize the indicator's distance to volatility so the threshold means the same thing across markets. An indicator that is not volatility-normalized is silently recalibrated every time you change instruments.
Property 3: the horizon at which conditions resolve. This determines the lookback. A 14-period setting assumes conditions resolve over 14 bars; on a faster-resolving market they resolve in 7 and the indicator is too slow, on a slower-resolving one they resolve in 28 and the indicator is too fast. The article "How to Choose the Right Timeframe for a Strategy" handles this; the indicator's period has to match the market's resolution horizon.
A single indicator with a single parameter set fixes all three of these to the values that suited the market it was built on. Deploy it elsewhere and at least one of the three is wrong.
The normalization that makes an indicator portable
You cannot make an indicator truly market-agnostic, but you can make it less market-specific by replacing fixed parameters with adaptive ones tied to the market's own structure. Three substitutions.
Substitution 1: replace fixed thresholds with volatility-normalized or percentile thresholds. Instead of "sell at RSI 70", use "sell when the indicator is in the top decile of its own recent distribution". The percentile adapts to each market's distribution, so the threshold means the same thing (a genuine extreme for this market) everywhere. This is the distributional thinking the article "Why Indicator Histograms Matter" pushed: read the indicator against its own histogram, not against a universal constant.
Substitution 2: replace a fixed lookback with a noise-adaptive one. The adaptive moving average from the efficiency-ratio article does this: its effective speed varies with the market's noise, so it is slow in choppy markets and fast in efficient ones without you changing a parameter. The general pattern is to make the period a function of the measured efficiency ratio or measured cycle length rather than a hardcoded number.
Substitution 3: gate the indicator's family on the regime. Even a well-normalized reversion indicator should be switched off when the efficiency ratio says the market is trending, and a trend indicator switched off when it says the market is chopping. The gate, from the previous two articles, is what stops a reversion indicator from firing sell signals into an uptrend.
$$ \text{signal} = \begin{cases} \text{reversion indicator} & \text{if } \text{ER}_t < \theta_{\text{low}} \\ \text{trend indicator} & \text{if } \text{ER}_t > \theta_{\text{high}} \\ \text{no position} & \text{otherwise} \end{cases} $$
The signal switches family based on the efficiency ratio at time t: below a low threshold the market is noisy and the reversion indicator is active, above a high threshold the market is efficient and the trend indicator is active, and in the mixed band between them neither fires because that band is where both families overfit, the danger zone from "Efficiency Ratio Explained for Traders". This is not one indicator on every market; it is a regime-aware switch that picks the right indicator for the measured structure.
Why "it works on everything" should worry you
An indicator that posts a positive result on every market in a diverse universe is suspicious, not reassuring. Markets with opposite noise structures need opposite-family indicators, so a single fixed indicator that profits on a strong trend market and a strong reversion market at the same time is either capturing something so weak it survives both (and will not survive costs) or has been tuned on a sample where the structures happened to align. The article "Why Works on All Markets Is Usually a Red Flag" framed the skeptical reading; the noise framework gives the mechanism. The honest expectation is that a reversion indicator works on the high-noise markets and fails on the low-noise ones, and a trend indicator does the reverse. A clean split by noise level is the signature of a real edge; uniform success across noise levels is the signature of an artifact.
This also reframes what robustness means. Robustness is not "the same indicator with the same parameters works everywhere", which is the property the article "The Difference Between Robustness and Optimization" warned is usually a sign of an over-flexible fit. Robustness is "the indicator works on the markets whose structure it matches, and I can predict which those are from the efficiency ratio before testing". A robust system knows where it should not be deployed.
Decision summary
| Symptom | Cause | Fix |
|---|---|---|
| Indicator works on market A, fails on market B | Different noise level; wrong family for B | Gate family on the efficiency ratio |
| Thresholds hit too often on a new market | Higher volatility; fixed thresholds miscalibrated | Use volatility-normalized or percentile thresholds |
| Indicator too slow or too fast on a new market | Different resolution horizon; fixed lookback wrong | Make the period adaptive to noise or cycle length |
| "Works on everything" blended result is mediocre | Opposite structures averaged together | Stop blending; split by noise level and match family |
The fix is never "find the one indicator that works everywhere". It is to make the indicator's family, thresholds, and horizon adaptive to each market's measured structure, and to accept that the indicator belongs only on the markets it matches.
Visualizing the portability problem
KEY POINTS
- An indicator is a bet on a specific market structure. Its period, thresholds, and family encode hidden assumptions about the noise level, volatility, and resolution horizon of the market it was built for.
- The same overbought threshold means opposite things across noise regimes. RSI 70 on a high-noise market is a genuine reversal extreme; on a low-noise trending market it is what a healthy uptrend looks like and can persist for weeks.
- Three properties change when you move an indicator across markets: the noise level (determines whether it should be a trend or reversion tool), the volatility (determines whether fixed thresholds are calibrated), and the resolution horizon (determines whether the lookback fits). A single fixed parameter set gets at least one wrong.
- Make indicators more portable with three substitutions: percentile or volatility-normalized thresholds instead of fixed levels, a noise-adaptive lookback instead of a hardcoded period, and a regime gate that switches the indicator's family on the efficiency ratio.
- The regime switch fires a reversion indicator when the efficiency ratio is low, a trend indicator when it is high, and nothing in the mixed band where both families overfit.
- An indicator that works on every market in a diverse universe is suspicious, not reassuring, because opposite noise structures need opposite-family indicators. A clean split by noise level is the signature of a real edge; uniform success is the signature of an artifact.
- Robustness is not the same indicator working everywhere. It is the indicator working on the markets whose structure it matches, with the ability to predict which those are from the efficiency ratio before testing. A robust system knows where it should not be deployed.
- The next article, "How to Choose the Right Timeframe for a Strategy", isolates the horizon dimension: how the resolution timescale interacts with noise and why measuring at the wrong timeframe produces false conclusions about the right one.
References
- Trading Systems and Methods - Perry Kaufman (Amazon)
- Cybernetic Trading Strategies - Murray Ruggiero (Amazon)
- The Art of Currency Trading - Brent Donnelly (Amazon)
- Behavioral Technical Analysis (BTA)
- Short Term Trading Model for Asian Equity Index Futures
- Volatility-Driven Trading Systems: A Dual-Model Analysis Across 50 Assets
- What Are Market Regimes? Definitional Chaos, Validation Failure, and Algorithmic Confusion
- Foreign Exchange Market Mechanism
- The FX Race to Zero: Electronification and Market Structural Issues
- Good versus Bad COVOL in Cryptocurrency Markets: A Measure of Market Noise
- Full article: Revisiting Cont's stylized facts for modern stock markets
- New Concepts in Technical Trading Systems
- Key Technical Indicators for Stock Market Prediction
- A Comparison of Short-Term Mean-Reversion Indicators for Global Equities
- Estimating the Price Impact of Trades in a High-Frequency Order Book
- Explainable Patterns in Cryptocurrency Microstructure
- Evidence from Spread, Volatility, and RSI across Global
- Market-neutral carry strategies
A note on AI. The ideas, research, analysis, and conclusions in this article are my own. I use AI tools to help with editing and wordsmithing, because English is not my first language, and I am not shy about that. AI-generated ideas and AI-assisted writing are not the same thing: the first is empty slop from a generic prompt, the second is a tool for communicating years of real research more clearly. Judge the work by its substance, not by whether software helped polish the prose.