4.5 Low Noise Markets Are Trend-Following Markets
Low noise is trend fuel: motion that accumulates keeps going. The payoff is few big winners against many small losers; the risk is a flip to chop, so gate breakouts on the efficiency ratio.
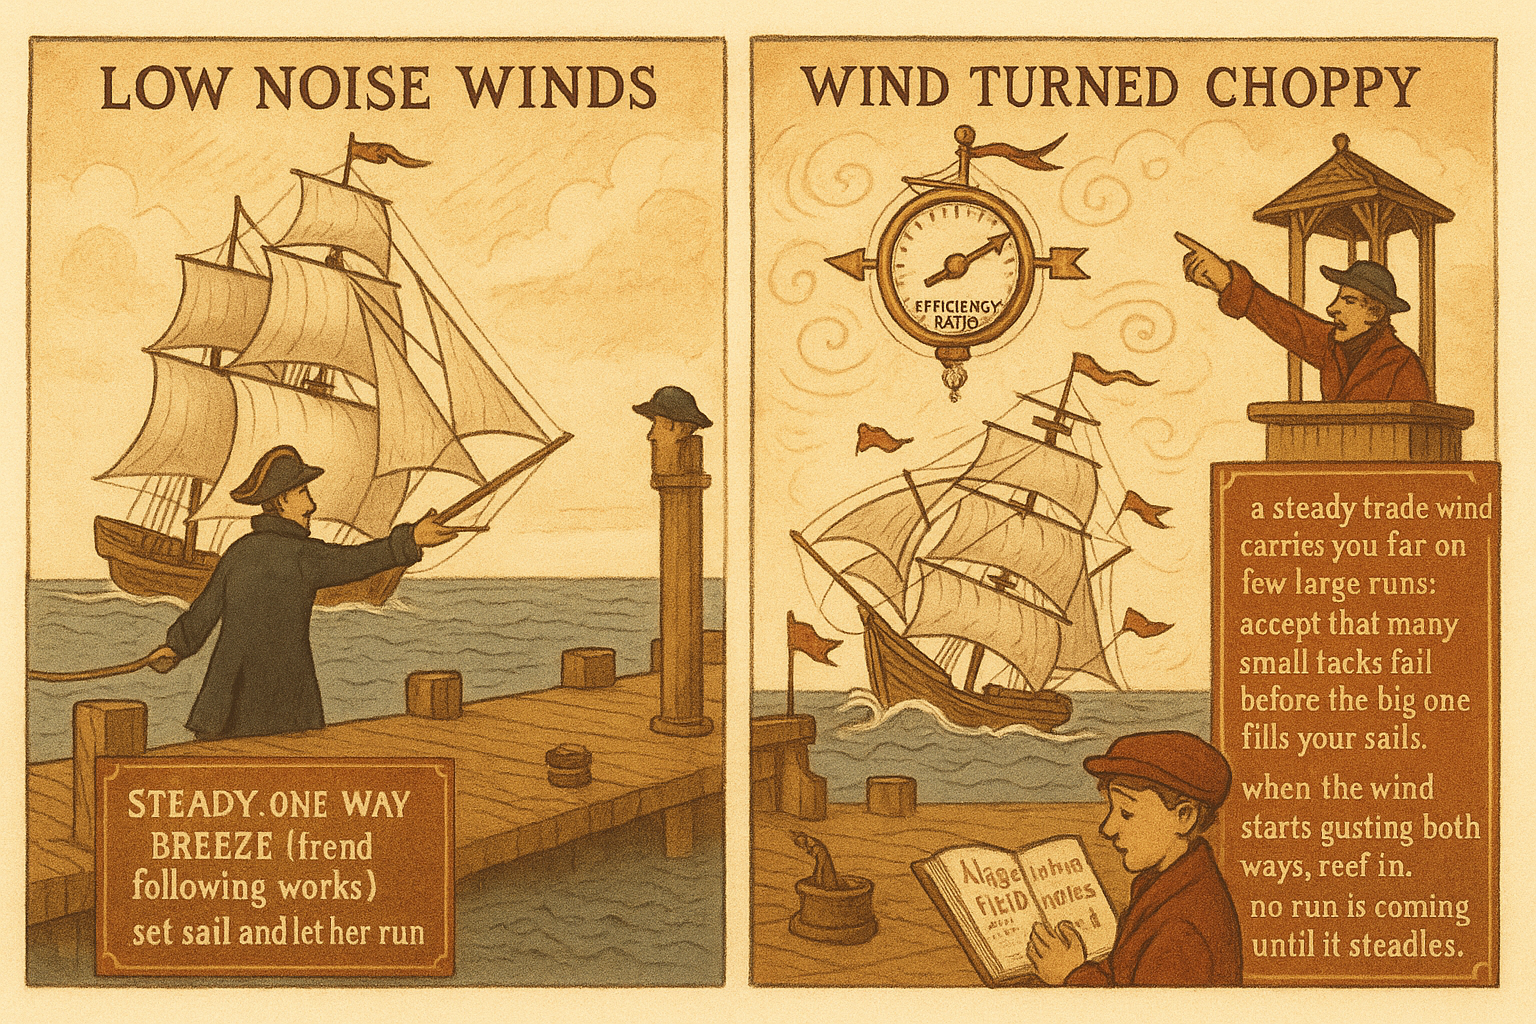
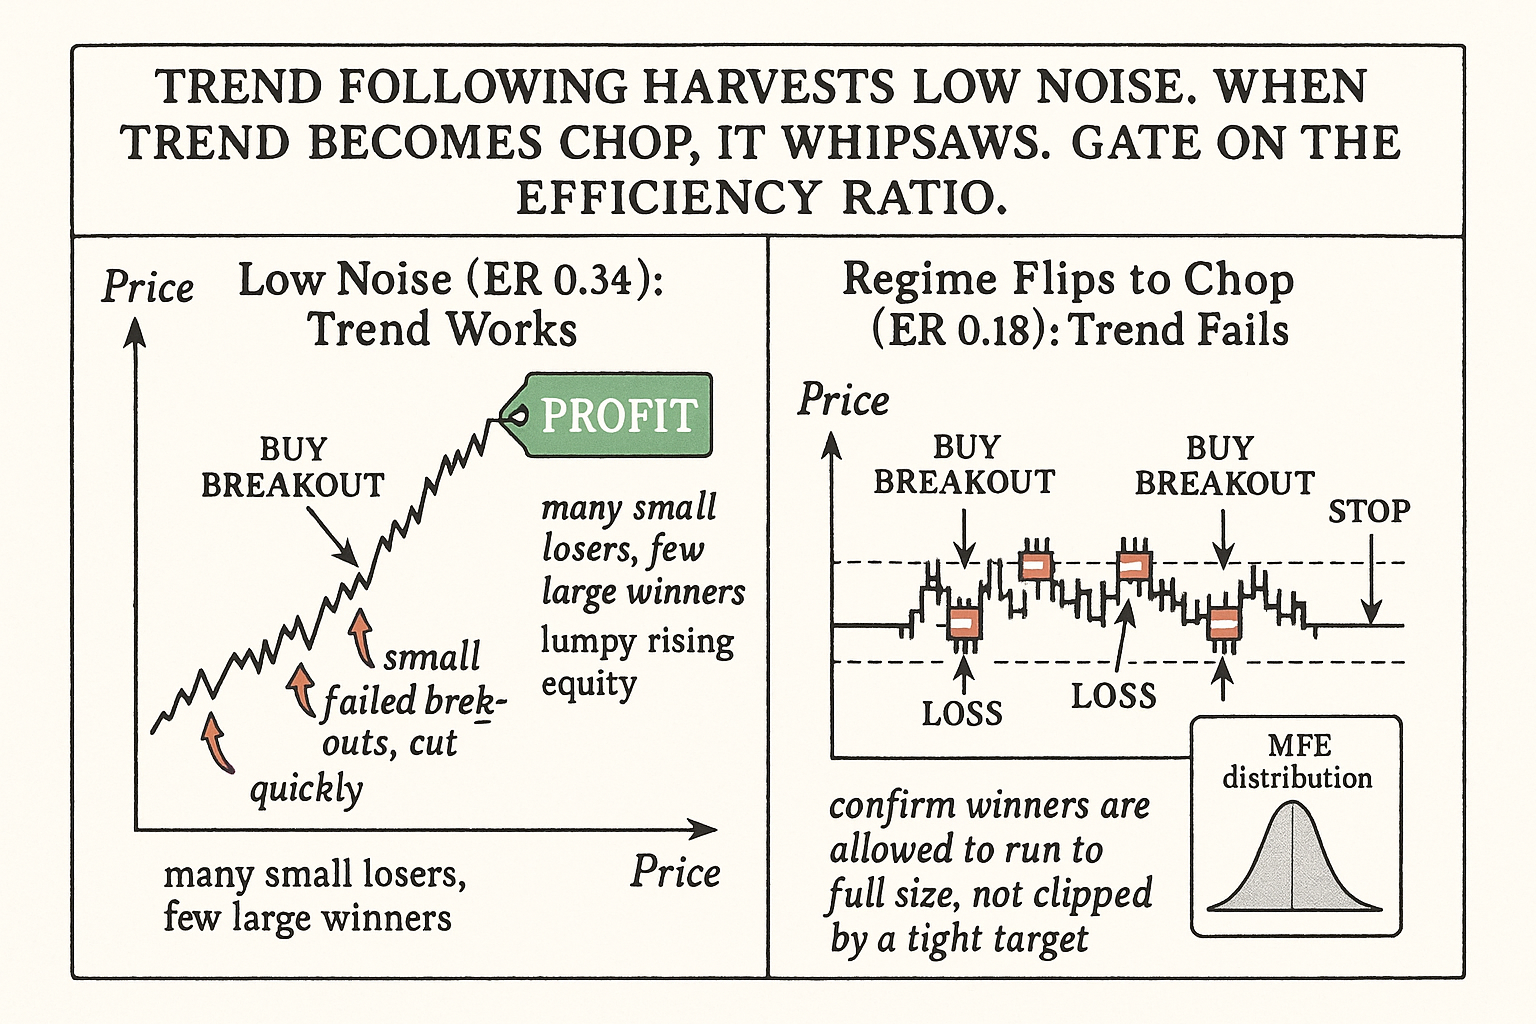
Run a 20-day breakout system, the kind that buys when price exceeds the highest high of the prior 20 days and exits at the lowest low of the prior 10, on a market with an efficiency ratio of 0.34. The entries catch the start of sustained moves, the exits give back a little at the end, the winners are large and the losers are small and frequent. The equity curve is lumpy but it climbs. Now run the identical system on EURUSD at an efficiency ratio of 0.18. Every breakout triggers near a local extreme that immediately reverses, the system buys the high and sells the low over and over, and the equity curve grinds down through a thousand small whipsaws. Same rules, opposite result, and the only thing that changed was that the second market converts almost none of its motion into net direction.
This is the mirror of the previous article. "High Noise Markets Are Mean-Reversion Markets" explained why choppy instruments feed fade systems; this article explains why efficient instruments, the top of the trend-quality ranking from "How to Rank Markets by Trend Quality", feed trend systems, and why a trend system deployed in a high-noise market is not mistuned but misplaced. The two articles are deliberately symmetric, because the strategic divide between trend and reversion is the noise axis and nothing else.
Why low noise mechanically favors trend
A trend system makes one bet: a move in one direction is more likely to continue than to reverse. That bet pays exactly when the market's motion accumulates in one direction, which is the definition of low noise. A high efficiency ratio says net change is large relative to total path, which means the price keeps going rather than coming back, which means continuation, which is trend. The efficiency ratio and the trend edge are the same structure measured twice, the exact symmetry to the reversion case.
The flow mechanism is the opposite of dealer inventory management. Low-noise persistence comes from slow, directional, repeating order flow: a supply shock that keeps a commodity bid for months, a central-bank divergence that keeps a currency pair on one side for a year, an earnings-and-growth regime that keeps an equity index drifting up. The article "Noise Is Not Volatility" named this: a market dominated by slow directional flow generates persistence because the underlying imbalance repeats. The same buyer keeps coming back, so the same direction keeps printing, so the efficiency ratio stays high and a trend system stays paid.
The autocorrelation signature is positive at the trend horizon: an up move is more likely to be followed by another up move. Where reversion markets show negative first-lag autocorrelation, trend markets show positive, and that positive autocorrelation is what a moving-average or breakout system monetizes. The article "Market Personality" listed positive autocorrelation as the trend-favoring personality dimension; it is the time-series footprint of low noise.
The trend payoff is the reversion payoff inverted
Where mean reversion is many small winners and occasional large losers, trend following is many small losers and occasional large winners. Low win rate, high average win to average loss, profit concentrated in a few big moves. The article "Why Profit Factor Can Lie" applies here in the opposite direction: a trend system's profit factor can look weak because the win rate is low, even though the strategy is sound, because the few large winners carry everything.
Write out the asymmetry. Suppose the breakout wins 35% of the time for an average of 2.5 volatility units and loses 65% of the time for an average of 0.7 volatility units (the small loss being the cost of a failed breakout that gets cut quickly).
$$ E = p_{\text{win}} \cdot g - (1 - p_{\text{win}}) \cdot l = 0.35 \times 2.5 - 0.65 \times 0.7 = 0.875 - 0.455 = 0.42 $$
The expectancy E is 0.875 minus 0.455, equal to 0.42 volatility units per trade, far larger than the reversion system's thin 0.01, but it arrives with a 65% loss rate that the trader has to sit through. The psychological and statistical problem is the same: most trades lose, and the strategy depends on not cutting the rare large winners short. The article "MAE/MFE Analysis: Seeing What Net Profit Hides" matters here for the opposite reason it mattered in reversion: you need the maximum favorable excursion distribution to confirm the winners are being allowed to run to their full size rather than clipped by a tight target.
The low win rate also means a trend system needs many trades and a long sample before its edge is statistically visible, the trade-count problem from "Trade-Count Thresholds for Backtest Reliability" and "Why 30 Trades Is Not a Strategy". A handful of trend trades on one market tells you almost nothing, because the profit is concentrated in the tail and the tail is rare. You need either many years on one efficient market or a basket of efficient markets to accumulate the trade count that makes the edge measurable.
The failure mode: trend that turns into chop
A low-noise market is not permanently low-noise. The efficiency ratio drifts, and the worst environment for a trend system is an efficient market that goes choppy. Every trend system is implicitly long continuation, so a market that stops continuing and starts oscillating is its slow-bleed scenario: a string of breakouts that immediately fail, each one a small loss, with no large winner to pay for them. This is the trend-follower's drawdown, and it is structural, not a bug to be optimized away.
The defense is the same gate, run in the opposite direction. Compute the rolling efficiency ratio at the trend horizon and reduce or disable new breakout entries when it falls below the trend threshold (drifting toward 0.20, into chop territory). The article "Efficiency Ratio Explained for Traders" described the adaptive moving average that does this automatically by slowing down when the efficiency ratio drops; a discretionary or rules-based trend book does it by sizing down or stepping aside when the regime turns choppy. A trend system without this gate will keep firing breakouts into a range and donate its prior gains back through whipsaw.
The harder problem is that you cannot eliminate the chop drawdown entirely, only manage its size. Trend following accepts a structural cost: it gives back a portion of profits during chop regimes to be positioned when the next sustained move starts, because the system cannot know in advance which breakout is the real one. The article "Why Systems Work Until They Don't" framed this acceptance; the chop drawdown is the premium a trend follower pays to always be present when the large move arrives. Trying to optimize it away usually means tightening the system until it misses the large moves too, which destroys the only thing that made it work.
Which markets, and at which horizons
Trend quality is horizon-dependent, mirror to noise. Equity indices are trend markets at multi-week to multi-month horizons (efficiency ratio around 0.30) and reversion markets at the 1-to-5-day scale. Trending commodities are trend markets during supply-shock regimes and revert to choppy seasonality otherwise. Crypto is a trend market in active breakout regimes (efficiency ratio swinging to 0.50) and a choppy market during multi-month consolidations (efficiency ratio dropping toward 0.05). The article "Market Personality" catalogued these horizon-and-regime dependencies; the operational instruction is to measure the efficiency ratio at the horizon you intend to trend-follow and accept that the same instrument may be a trend market this quarter and a chop market next quarter.
The instruments that are trend markets across most horizons are the ones with structural drift: equity indices (the equity risk premium produces a persistent up-bias) and commodities or currencies under sustained macro imbalances. The instruments that are trend markets only episodically are the no-drift ones (most FX, range-bound commodities) where trend appears during specific regimes and disappears otherwise. The discipline matches the reversion case exactly: read the efficiency ratio at your horizon, deploy the family the regime supports, and gate on the regime drifting against you.
Decision summary
| Efficiency ratio at trend horizon | Market type | Action |
|---|---|---|
| Above 0.30 | Strong trend (equity indices, trending commodities, active crypto) | Deploy breakout or moving-average, let winners run to MFE, accept low win rate |
| 0.25 to 0.30 | Weak / emerging trend | Trend with smaller size, tighter regime gate |
| Below 0.20 | Chop regime | Disable breakouts, the move will reverse |
The trend system belongs in the top rows of the efficiency ratio and nowhere in the bottom rows. The chop drawdown is a structural cost to be sized, not a defect to be optimized away.
Visualizing the trend edge and its failure
KEY POINTS
- Low noise means motion that accumulates in one direction, which is the raw material a trend system converts to profit. A high efficiency ratio and a trend edge are the same structure measured two ways.
- The flow mechanism is slow, directional, repeating order flow: supply shocks, central-bank divergences, growth regimes. The same buyer keeps returning, so the same direction keeps printing and the efficiency ratio stays high.
- The autocorrelation signature is positive first-lag return autocorrelation at the trend horizon: an up move tends to be followed by another up move. It is the time-series footprint of low noise.
- The payoff is the reversion payoff inverted: many small losers, few large winners, low win rate, high average-win-to-average-loss. A 35% win rate at 2.5 units against 0.7-unit losers nets 0.42 units expectancy, far larger than reversion's thin edge but with a 65% loss rate to sit through.
- A trend system needs many trades and a long sample because the profit is concentrated in a rare tail. A handful of trend trades on one market tells you almost nothing; accumulate trade count across years or across a basket of efficient markets.
- The defining failure mode is a low-noise market turning choppy: breakouts fire into a range, each a small loss, with no large winner to pay for them. This is the structural trend-follower drawdown.
- The defense is the efficiency-ratio gate run in reverse: reduce or disable breakouts when the rolling ratio falls toward chop territory. The chop drawdown can be sized but not eliminated; it is the premium paid to always be present for the next large move.
- Trend quality is horizon-dependent. Equity indices trend at multi-week horizons and revert at the 1-to-5-day scale; crypto trends in active regimes and chops in consolidations. Measure the efficiency ratio at the horizon you intend to trend-follow.
- The next article, "Why One Indicator Should Not Be Used on Every Market", builds on this trend-reversion split to show why a single indicator with a single parameter set cannot serve markets with different noise structures.
References
- Trading Systems and Methods - Perry Kaufman (Amazon)
- Cybernetic Trading Strategies - Murray Ruggiero (Amazon)
- The Art of Currency Trading - Brent Donnelly (Amazon)
- Cycles: The Science of Prediction
- Technical Analysis: The Complete Resource for Financial Market Technicians (sections on trend-following, momentum, and breakout systems)
- The Anatomy of the Global FX Market through the Lens of the 2013 Triennial Survey
- Capital Market Efficiency
- Explainable Patterns in Cryptocurrency Microstructure
- The FX Race to Zero: Electronification and Market Structural Issues in Spot FX
- Adaptive Signal Extraction via Kalman Filtering and Markov-Switching: Regime-Dependent Information Asymmetry in Equity Markets
- The Physics of Price Discovery: Deconvolving Information, Volatility, and Investor Flows in Equity Markets
- Liquidity and Market Efficiency: A Large Sample Study
- High Frequency Market Microstructure Noise Estimates and Liquidity Measures
- On the Correlation Structure of Microstructure Noise: A Financial Economic Approach
- Drivers of Technical Trend-Following Rules’ Profitability in World Stock Markets
- Carry and Trend Following Returns in the Foreign Exchange Market
- Why Is Equity Order Flow So Persistent?
- A Unified Theory of Order Flow, Market Impact, and Volatility
- Caught on Tape: Institutional Order Flow and Stock Returns
A note on AI. The ideas, research, analysis, and conclusions in this article are my own. I use AI tools to help with editing and wordsmithing, because English is not my first language, and I am not shy about that. AI-generated ideas and AI-assisted writing are not the same thing: the first is empty slop from a generic prompt, the second is a tool for communicating years of real research more clearly. Judge the work by its substance, not by whether software helped polish the prose.