4.19 Using Ratios as Trading Signals
A ratio nets out the move two markets share and keeps only who is winning. Signal off it like a price to rotate between them, but watch for near-zero denominators and whipsaw on both legs.
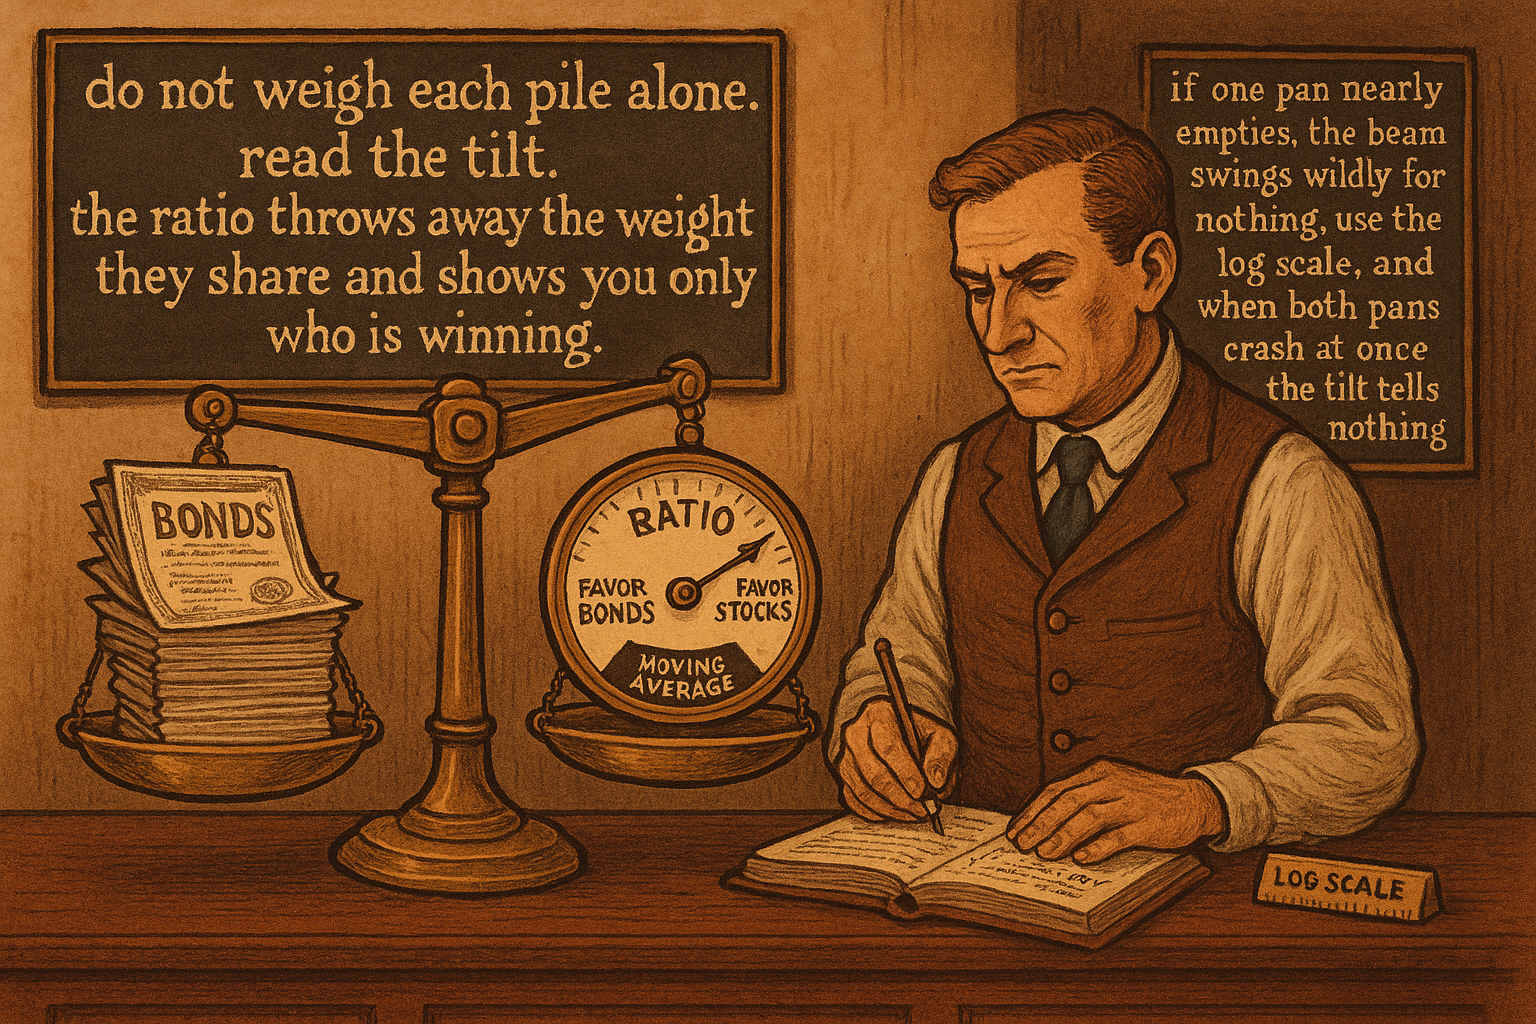
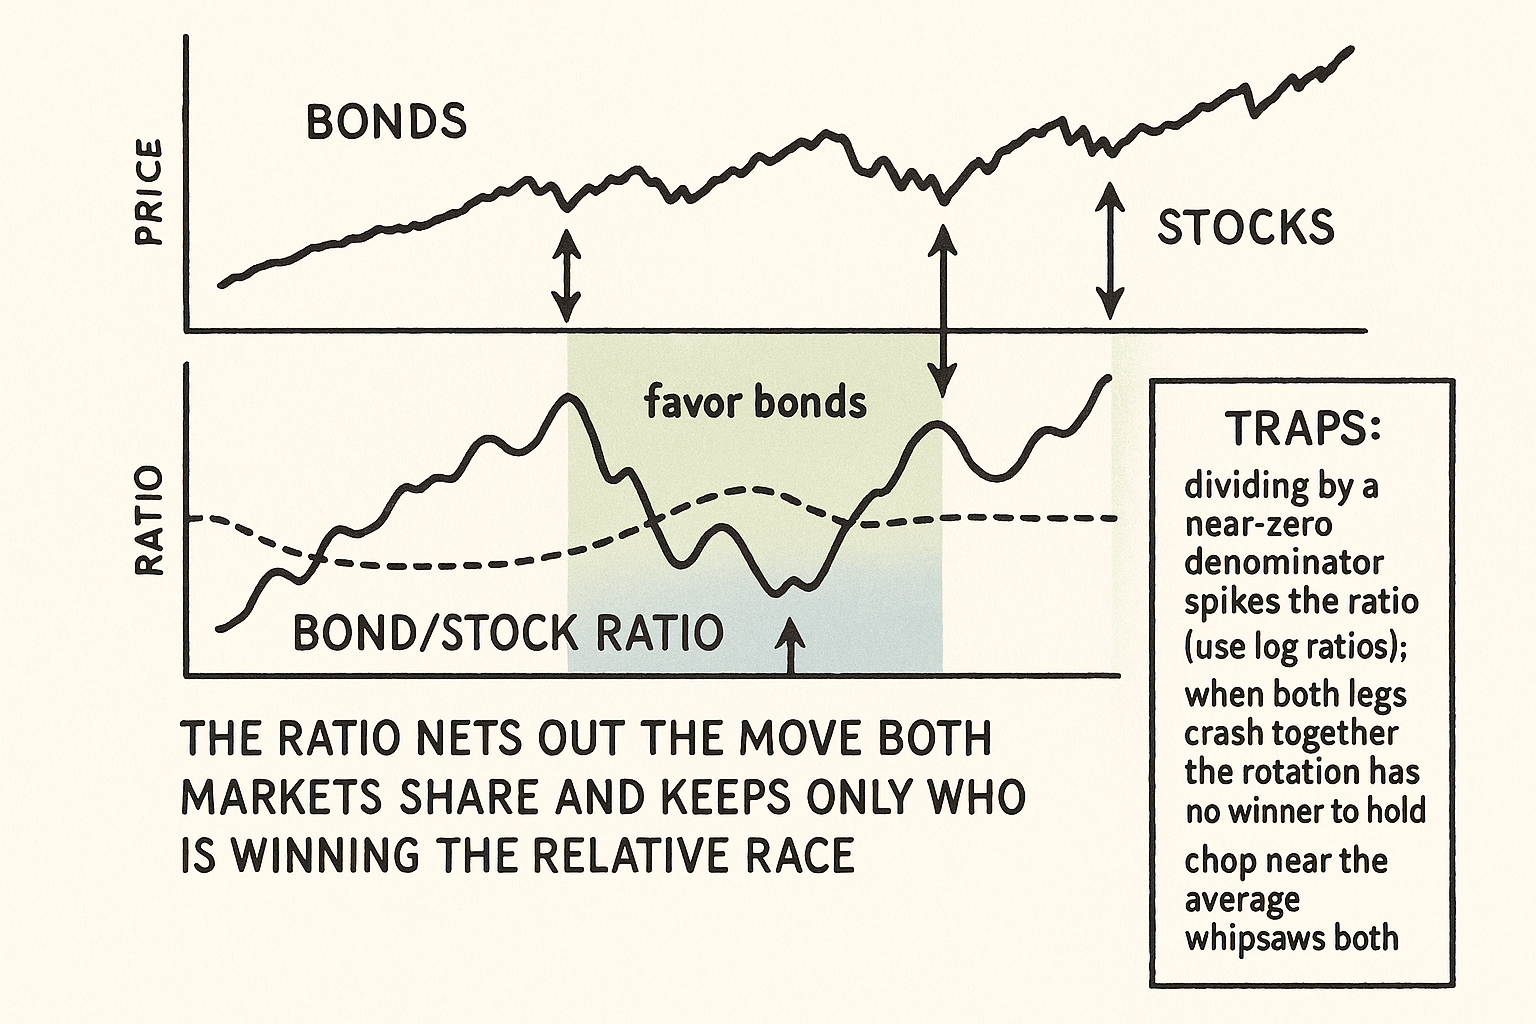
Divide one market's price by another and you get a ratio, a single series that throws away the part of the move both markets share and keeps only their relative performance. Take the bond price divided by the stock price. When that ratio rises, bonds are outperforming stocks; when it falls, stocks are outperforming bonds. Now apply a plain moving-average rule to the ratio: above its average, favor bonds; below its average, favor stocks. You have converted two price series into one tradeable signal that captures rotation between them, and rotation is exactly what a pair of correlated markets does that you cannot see by watching either chart alone.
This article covers the ratio, the fourth rule template from "Intermarket Analysis for System Traders", as its own tool: how to build it, what it measures, how to signal off it, and the specific traps that make naive ratio systems blow up. The ratio is also the engine behind relative-strength and currency-strength work later in the pillar, including "Currency Strength Models from Pair Decomposition".
What a ratio actually measures
A ratio is relative performance with the common move netted out. If two markets both rise 10%, their ratio is unchanged, because the shared move cancels in the division. The ratio only moves when one outperforms the other, which is why it isolates rotation and ignores the overall direction of the pair.
$$ R_t = \frac{A_t}{B_t}, \qquad \text{Signal}_t = \begin{cases} \text{favor } A & \text{if } R_t > \text{MA}_n(R)\\[4pt] \text{favor } B & \text{if } R_t < \text{MA}_n(R) \end{cases} $$
The ratio R at time t is market A's price divided by market B's price. The signal compares the ratio to its own n-period moving average: above the average, A is in a relative uptrend, so favor A; below, favor B. The rule is identical to a moving-average trend rule, but applied to relative performance instead of an outright price, so it generates a rotation signal rather than a directional one.
This is what makes the ratio different from the directional gates in the earlier intermarket articles. A gate says "trade A only when B is in some state." A ratio signal says "hold whichever of A and B is winning the relative race." One filters; the other rotates.
Two ways to use a ratio
Use one, the rotation switch. Hold the outperforming asset and switch when the ratio crosses its average. The bond/stock ratio above its average puts you in bonds; below, in stocks. This is a long-only rotation that is always invested in the stronger of the two, which historically smooths the equity curve relative to holding either one, because the two assets tend to take turns leading. The cost is whipsaw when the ratio chops around its average, the same turnover problem every moving-average rule has.
Use two, the spread trade. Go long the outperformer and short the underperformer, holding the ratio as a market-neutral position. This strips out the common market move entirely and bets only on the relative leg, which is the basis of pairs trading. The neutrality is the appeal and the danger: a market-neutral ratio position has no directional cushion, so if the relative relationship breaks, there is no broad market tailwind to bail you out, and the article "When a Stop Loss Improves Risk but Destroys Edge" applies because stopping a spread trade is its own hard problem.
A ratio oscillator refines both uses. Instead of the raw ratio against its average, compute the ratio minus its average (or a normalized version), giving an oscillator centered on zero. Positive means A is outperforming, negative means B is, and the distance from zero measures how stretched the rotation is. The oscillator form makes overextension visible, which helps separate a fresh rotation from an exhausted one.
A worked rotation
Numbers, because a risk-adjusted claim is empty without them. Take a monthly bond/stock rotation using a ratio against its 10-month average.
Hold bonds when the ratio is above its average, stocks when below. Over a long sample, the rotation tends to produce a return between the two assets' standalone returns but with a lower drawdown than either, because it is usually out of the asset having its worst stretch. Suppose stocks alone annualize 8% with a 50% max drawdown and bonds alone annualize 5% with a 15% max drawdown; the rotation might annualize 8% to 9% with a 25% max drawdown, beating both on risk-adjusted terms in the historical sample.
The honest footnote: that result is the in-sample best case, and the rotation's edge depends entirely on the two assets continuing to take turns. In a regime where both fall together (the negative-diversification crash), the rotation is in one of two losers and the relative signal does nothing for you. The article "How to Evaluate a Strategy Beyond Net Profit" applies: a rotation that looks great on risk-adjusted return in calm decades can still hand you both losers at once in the regime that matters.
The traps that blow up ratio systems
The ratio has failure modes that outright price systems do not, and they are the reason most naive ratio strategies disappoint.
The denominator can approach zero or change scale. If B falls hard, the ratio A/B explodes upward for reasons that have nothing to do with A outperforming, purely an artifact of dividing by a small number. Ratios of series that can approach zero or that live on very different scales produce unstable, spiky signals. Working with log ratios (the log of A minus the log of B) tames this, because logs turn the ratio into a difference and treat proportional moves symmetrically.
Both legs can move together and kill the rotation premium. The rotation switch earns its keep only when the two assets are imperfectly correlated and take turns. When the correlation spikes toward 1 in a crisis, the ratio flattens and the switch adds nothing while you sit in a falling asset. The diversification a ratio promises is exactly the diversification that fails when you need it, the recurring warning of this pillar.
The signal whipsaws near the average. A ratio chopping around its moving average flips the rotation repeatedly, each flip a round-trip cost, and the article "Why Transaction Costs Should Be Added Before You Fall in Love" applies with force because a rotation system trades both legs. A band around the average, or a longer smoothing, cuts the whipsaw at the cost of slower switches.
It is easy to data-mine. With a universe of markets you can search thousands of ratio pairs and moving-average lengths and find one with a gorgeous backtest by luck, the multiple-comparisons trap. Restrict ratio pairs to economically linked markets (bonds and stocks, gold and the dollar, two related currencies) before testing, and count every pair you tried, the discipline from "Optimization Comes After Testing, Not Before".
Visualizing the ratio signal
KEY POINTS
- A ratio divides one market's price by another, netting out the move both share and keeping only relative performance. The ratio moves only when one asset outperforms the other, so it isolates rotation and ignores the pair's overall direction.
- Signal off the ratio the same way you signal off a price: above its moving average, favor the numerator asset; below, favor the denominator asset. It is a moving-average trend rule applied to relative performance.
- A gate filters ("trade A only when B is in some state"); a ratio rotates ("hold whichever of A and B is winning"). They are different tools built from the same parts.
- Two uses: the rotation switch holds the outperformer and switches on the crossing (long-only, smoother than either asset); the spread trade goes long the winner and short the loser for a market-neutral position with no directional cushion.
- A ratio oscillator (ratio minus its average, normalized) centers on zero, showing direction by sign and overextension by distance, which separates a fresh rotation from an exhausted one.
- Worked rotation: a bond/stock switch on a 10-month ratio average tends to land between the two assets' returns with a lower drawdown than either, because it sits out the asset having its worst stretch. That is an in-sample best case that fails when both fall together.
- Trap one: a denominator approaching zero or living on a different scale spikes the ratio. Use log ratios (log A minus log B) to tame it.
- Trap two: when correlation spikes to 1 in a crisis the rotation premium vanishes. Trap three: chop near the average whipsaws both legs at double cost. Trap four: ratio pairs are easy to data-mine, so restrict to economically linked pairs and count every pair tested.
References
- Trading Systems and Methods - Perry Kaufman (Amazon)
- Cybernetic Trading Strategies - Murray Ruggiero (Amazon)
- The Art of Currency Trading - Brent Donnelly (Amazon)
- An Intermarket Approach to Tactical Risk Rotation: Using the Signaling Power of Treasuries to Generate Active Asset Allocation Decisions
- Market-Timing Strategies That Worked?
- The Microstructure of Foreign Exchange Markets
- Lead-Lag Relationships in Market Microstructure
- Identifying Noise Traders: The Head-And-Shoulders Pattern in U.S. Equities
- Microstructure Evidence from the Polymarket Order Book - arXiv
- High-Frequency Trading, Asset Pricing, and Market Microstructure
- NBER WORKING PAPER SERIES NOISE TRADING AND
- Market Timing & Trading Strategies Using Asset Rotation
- Relative Strength Strategies for Investing
- Testing the Profitability of Moving-Average Rules as a Portfolio Selection Strategy
- A Theory of Technical Trading Using Moving Averages
- Trend Following with Momentum versus Moving Averages
- Dynamic Sector Rotation Strategy
- Deep Sector Rotation Swing Trading
- A New Sector Rotation Strategy and Its Performance Evaluation
A note on AI. The ideas, research, analysis, and conclusions in this article are my own. I use AI tools to help with editing and wordsmithing, because English is not my first language, and I am not shy about that. AI-generated ideas and AI-assisted writing are not the same thing: the first is empty slop from a generic prompt, the second is a tool for communicating years of real research more clearly. Judge the work by its substance, not by whether software helped polish the prose.