3.32 The Backtest Integrity Checklist
The deployment-readiness artifact: 32 items in 7 categories. Each box backed by analysis, reviewed by a second pair of eyes. Failures block or constrain.
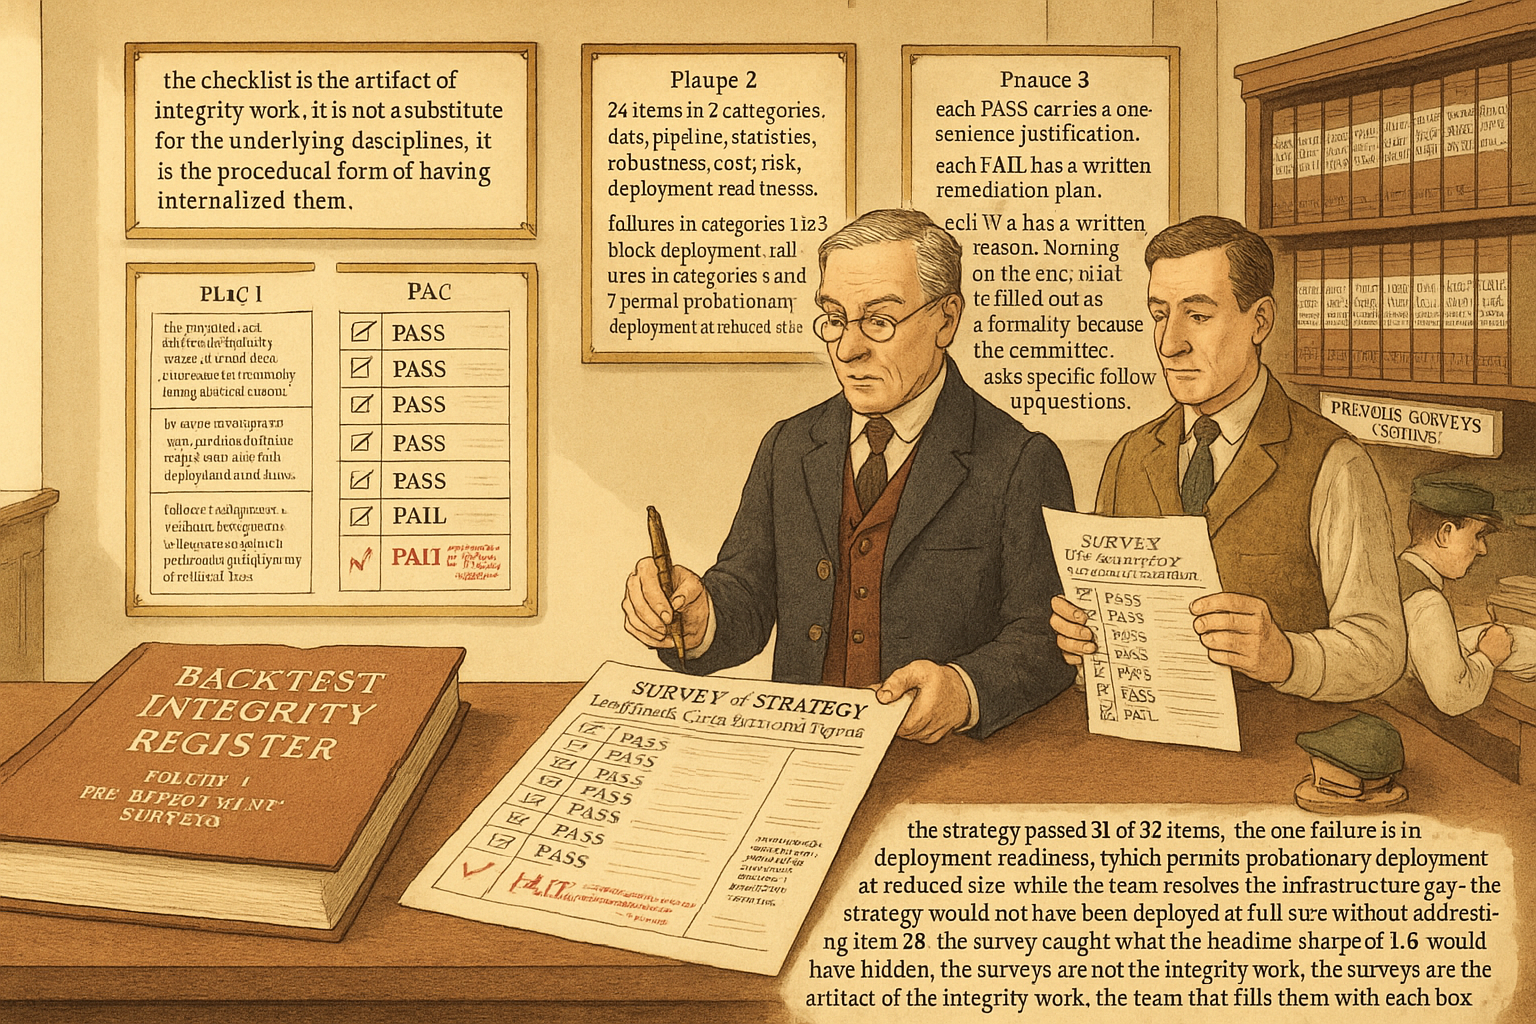
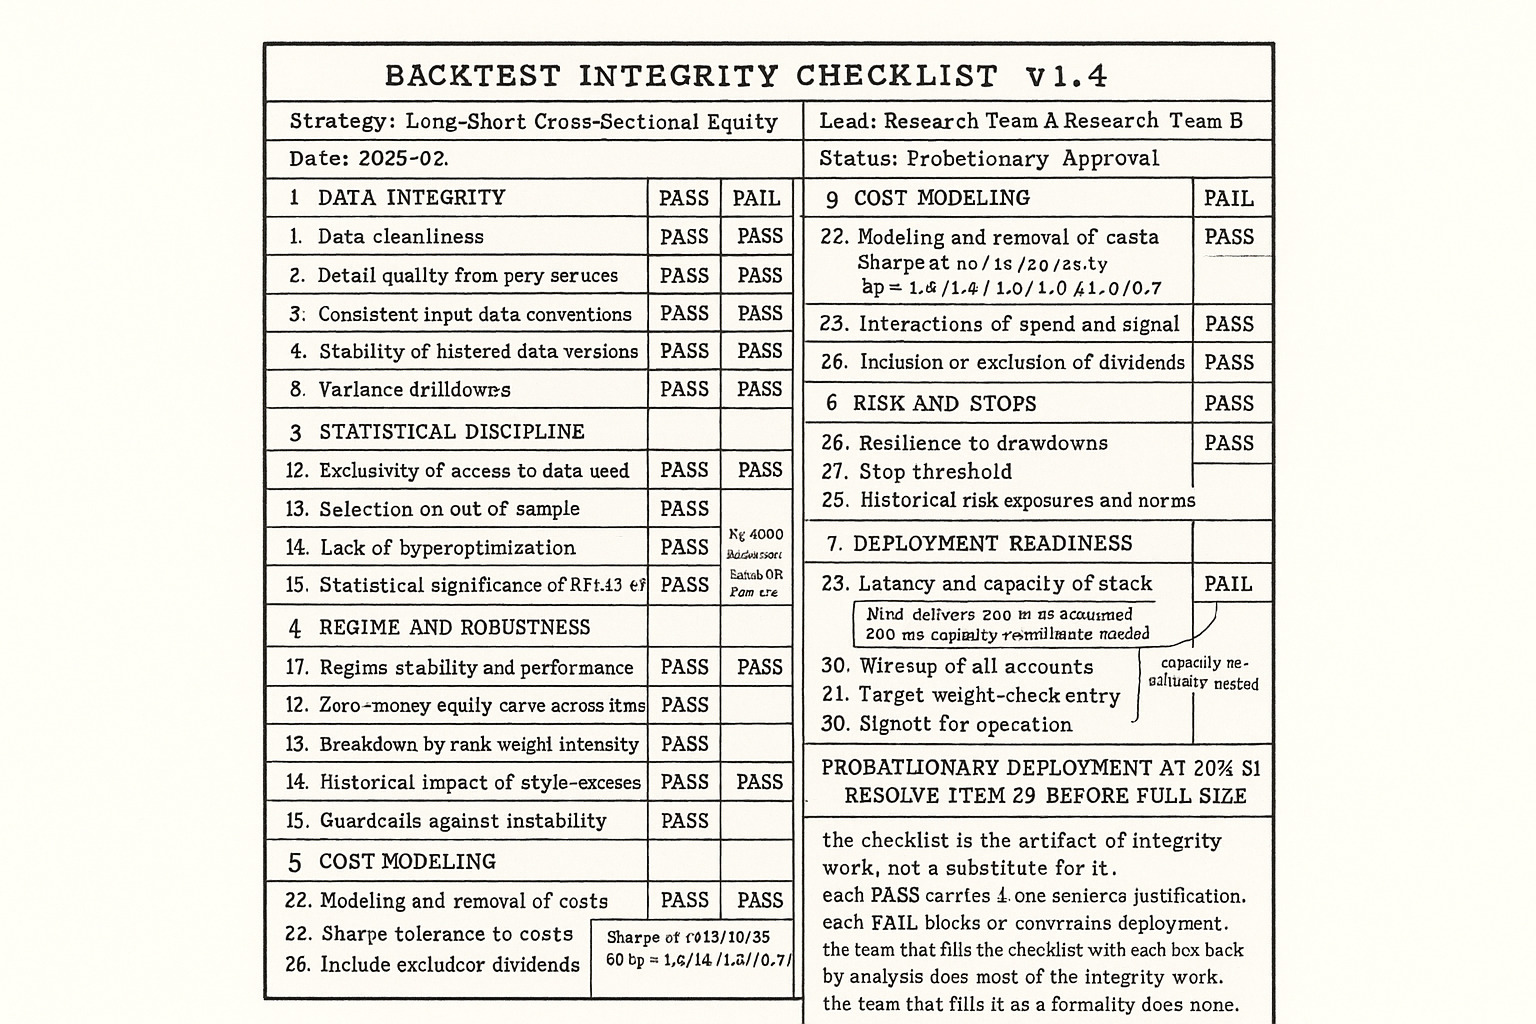
A research team presents a long-short cross-sectional equity strategy to the investment committee. The IS Sharpe is 1.6 across 2005 to 2022, the maximum drawdown is 14%, the average trade count per year is 380, the post-cost expectancy is positive on every annual slice. The committee asks one question before approving deployment: "walk me through the integrity checklist." The lead researcher pulls up a 32-item checklist and reads through it line by line. Items 1 to 14 (data and pipeline) pass. Items 15 to 20 (cost modeling) pass with one note: "small-cap costs estimated at 20 bp round-trip, conservative versus historical 15 bp average." Items 21 to 27 (statistical-test discipline) pass with one note: "permutation test p-value 0.018, robust to block length between 5 and 20 days." Items 28 to 32 (deployment readiness) flag two issues: "execution latency assumption is 200 ms, the team's current infrastructure has 350 ms median; capacity estimate has not been stress-tested against the strategy's actual position sizing rules." The committee approves a probationary deployment at 30% target size pending resolution of the two flagged items.
The checklist is the artifact that converts a backtest from an internal research exercise into a deployment-ready estimate. The articles in this pillar so far cover the individual disciplines: stationarity diagnostics, regime stratification, parameter stability, walk-forward and CSCV, Monte Carlo, MAE/MFE, profit-factor and Sharpe interpretation, transaction cost modeling. This article assembles the disciplines into a single procedural artifact that the team uses before any pitch deck, any committee review, and any deployment. The checklist is the operational form of having internalized the disciplines, and presupposes that understanding rather than replacing it. A strategy that fails one item on the checklist is not deployed; a strategy that passes all of them is at least not failing for a known reason.
The checklist has 32 items organized into 7 categories. Each item has a specific test, a specific pass criterion, and a specific failure action. The team that fills out the checklist with each box backed by the underlying analysis is doing 80% of the integrity work; the team that skips the checklist or fills it out as a formality is doing none of it.
The checklist's structural justification
Three structural reasons.
Reason 1: the research process is iterative and the iterations accumulate biases that the headline numbers hide. A team works on a strategy for 3 to 12 months. Decisions get made on partial information. Parameters get adjusted. Data sources get changed. Each decision is small and locally justified; the cumulative effect on the IS Sharpe is large and unobservable from the final numbers alone. The checklist forces the team to surface each decision as a checkbox.
Reason 2: the deployment is irreversible at the cost of real capital. The team's incentive is to ship; the allocator's incentive is to fund only strategies that survive. The checklist is the shared artifact that both parties can audit. The "How to Evaluate a Strategy Beyond Net Profit" article framed the 25-metric evaluation panel; the checklist is the procedural version of the panel that also covers data and methodology integrity.
Reason 3: humans are bad at remembering all the failure modes at once. The number of ways a backtest can be wrong (data leakage, look-ahead bias, survivorship bias, post-selection bias, regime mismatch, cost underestimation, capacity overestimation, etc.) exceeds working memory. A written checklist is a memory aid that converts integrity from a personal-discipline problem to a procedural problem.
Category 1: data integrity
Six items.
Item 1: source documentation. The team can name every data source, the vendor, the version, the date range, and the corrections-applied policy. A strategy built on data that the team cannot fully document is one regression-error or one corporate-action mistake away from being a different strategy.
Item 2: point-in-time alignment. Every input to the strategy uses only data that would have been available at the trading decision time. Earnings data uses announcement date and reported date, not as-of-today restated values. Fundamental data uses the as-reported version, not the latest restated version. The article "Why OOS Failure Is Often a Stationarity Failure" framed look-ahead as one of four causes of OOS failure; the data-integrity check is the first defense.
Item 3: survivorship-free universe. The strategy's investable universe at time t includes the names that were investable at t, not the names that survive to today. Equity universes that exclude delisted names will inflate the strategy's apparent Sharpe by 1 to 3 absolute units; commodity universes that exclude failed contracts will do the same.
Item 4: corporate-action handling. Splits, dividends, mergers, spin-offs are applied to the price series. The handling is documented and consistent across the universe. A common failure: forward-adjusted prices in the IS period and unadjusted prices in the OOS period, which produces nonsense.
Item 5: missing-data treatment. The team has a documented rule for missing observations (drop, forward-fill, interpolate). The rule is applied consistently across the universe and the time period. The rule does not introduce look-ahead (interpolating across a future-known value would).
Item 6: timezone and trading-calendar handling. The team can produce the strategy's behavior on each market's local calendar, including holidays, half-days, and timezone transitions. A strategy that fires entries on a US holiday because the calendar was incorrectly set to "weekdays only" is generating fake trades that will not exist in deployment.
Category 2: pipeline integrity
Five items.
Item 7: causal data flow. Every transformation in the pipeline uses only past data. Normalizations are computed on rolling windows ending at t-1. Regression coefficients are estimated on a fitting window that ends before the prediction window. The article "Rolling Normalization: Useful Tool or Hidden Overfit?" framed the rolling-window discipline.
Item 8: code review and reproduction. A second team member has reviewed the backtest code and can reproduce the headline numbers from the same data. A backtest that one person can reproduce and no one else can has a high probability of containing a bug that the original author has stopped seeing.
Item 9: unit tests on critical functions. The position-sizing function, the cost-application function, the signal-generation function, and the risk-management function each have unit tests with known inputs and expected outputs. The tests are run in CI before any backtest result is reported.
Item 10: random-seed control. Any stochastic component of the backtest (Monte Carlo resampling, randomized initialization) uses a controlled random seed. The same seed produces the same backtest output. A backtest whose numbers vary across runs is non-reproducible and the variation is an unmeasured source of result uncertainty.
Item 11: data-pipeline regression test. The pipeline has been re-run from raw data after the strategy was finalized, and the result matches the version the team has been iterating on. This catches the failure mode where the team has been iterating on a stale intermediate cache.
Category 3: statistical-test discipline
Five items.
Item 12: pre-specified hypothesis. The strategy is described as a hypothesis (e.g., "cross-sectional momentum at the 1- to 12-month horizon predicts future returns in large-cap US equities, post-cost Sharpe positive") before the backtest is run. The hypothesis is recorded with date and authors. Strategies that are constructed from a search through the data first and then hypothesized after are post-hoc and the apparent significance is inflated.
Item 13: trade-count adequacy. The strategy has at least 200 effective independent trades in the IS sample. The article "Trade-Count Thresholds for Backtest Reliability" gave the calibration; 100 is the lower bound, 200 is the comfortable minimum, 1000+ is the gold standard for tight CIs on derived metrics.
Item 14: permutation-test significance. The strategy's IS Sharpe is tested against the null of no predictive power using a block permutation test. The article "Permutation Tests for Indicator Significance" gave the mechanics. The p-value is below 0.05 with multiple-testing correction applied if more than one indicator was tested.
Item 15: search-width bias quantification. The team reports k_eff (the effective number of parameter combinations searched). The article "Degrees of Freedom in Trading Systems" gave the counting framework. The bias-corrected IS Sharpe is reported alongside the raw IS Sharpe.
$$ \widehat{\text{SR}}_{\text{corrected}} = \widehat{\text{SR}}_{\text{raw}} - \sigma_{\text{IS}} \sqrt{2 \log k_{\text{eff}}}, \qquad \sigma_{\text{IS}} \approx \frac{1}{\sqrt{N_{\text{trades}}}} $$
For a strategy with raw IS Sharpe 1.6, N = 500 trades, and k_eff = 1000, the bias correction is approximately 0.045 × sqrt(2 × 6.9) = 0.17. The corrected IS Sharpe is 1.43. For k_eff = 100000, the correction is 0.045 × sqrt(2 × 11.5) = 0.22, and the corrected Sharpe is 1.38. The raw Sharpe overstates the strategy by an amount that the team has to acknowledge before deployment.
Item 16: CSCV / PBO computation. The strategy has been evaluated under combinatorially symmetric cross-validation; the probability of backtest overfitting is below 0.30. The article "CSCV: A Direct Probability of Backtest Overfit" gave the procedure.
Category 4: regime and robustness
Five items.
Item 17: regime stratification. The strategy's performance is reported by volatility regime, trend regime, and macro regime. Each regime has at least 30 trades. No regime has Sharpe below -0.5 unless the strategy explicitly excludes that regime via a gating rule. The article "Regime Coverage: Why Your Backtest Needs Different Market States" gave the stratification framework.
Item 18: cross-market sanity. The strategy has been run on at least 2 comparable markets in the same family; the cross-market Sharpes are positive. The article "Why Works on All Markets Is Usually a Red Flag" framed the skeptical view; the sanity check is positive Sharpes on related markets, not on every market across all families.
Item 19: parameter perturbation. Each parameter has been perturbed by +/-25%; the Sharpe at each perturbed value is within 30% of the optimal-value Sharpe. The article "Parameter Stability Beats Best Parameter" gave the procedure.
Item 20: time-period robustness. The strategy has been evaluated on at least 2 non-overlapping sub-periods of the IS sample. The Sharpes are positive on each sub-period. A strategy whose IS Sharpe comes from a single 18-month window alone is regime-dependent and should be gated to that regime.
Item 21: walk-forward validation. The strategy has been evaluated through walk-forward analysis. The per-step OOS Sharpes have no clear downward trend. The article "Why Walk-Forward Testing Is Better Than One Big OOS Split" gave the procedure.
Category 5: cost modeling
Four items.
Item 22: realistic per-trade cost. The cost model includes commission, full bid-ask spread, slippage at the 75th percentile of historical observations, and market impact at the strategy's typical order size. The article "Why Transaction Costs Should Be Added Before You Fall in Love" gave the cost categories and magnitudes.
Item 23: cost-sensitivity table. The Sharpe is reported at 5 cost levels (optimistic, IS-assumed, mildly conservative, conservative, worst-case). A strategy whose Sharpe drops by more than 0.5 when the cost goes from IS-assumed to conservative is cost-fragile and the deployment depends on aggressive cost execution.
Item 24: capacity estimate. The team has a per-AUM Sharpe estimate that includes a market-impact model. The capacity is reported at multiple AUM levels ($10M, $50M, $250M, $1B). The deployment AUM is below the level at which the Sharpe degrades by 25%.
Item 25: live-vs-IS cost reconciliation plan. If the strategy is funded, the team commits to comparing live realized costs to IS-assumed costs at month 1, month 3, and month 6. A divergence triggers a cost-model update and a capacity re-estimate.
Category 6: risk and stops
Three items.
Item 26: bootstrap drawdown distribution. The strategy's expected maximum drawdown distribution has been generated via bootstrap of the historical trade sequence. The article "Monte Carlo for Trading Systems" gave the procedure. The hard kill-switch is set at the bootstrap 99th percentile, not the historical maximum.
Item 27: stop-loss audit. If the strategy uses stop losses, the team has computed the strategy with and without the stop; the with-stop version dominates the without-stop version in the deployment-relevant metrics (lower max DD, comparable or higher Sharpe). The article "When a Stop Loss Improves Risk but Destroys Edge" gave the trade-off.
Item 28: MAE/MFE diagnostic. The team has computed the MAE/MFE distribution per trade. The article "MAE/MFE Analysis: Seeing What Net Profit Hides" gave the procedure. The distribution is consistent with the strategy's hypothesized mechanism: a mean-reversion strategy has bounded MAE and slow-resolving MFE; a trend-following strategy has tighter MFE and wider MAE.
Category 7: deployment readiness
Four items.
Item 29: execution-infrastructure match. The strategy's latency, fill-rate, and order-type assumptions are matched against the team's actual execution infrastructure. A strategy that assumes 200 ms execution and 95% fill rate does not deploy on infrastructure that delivers 350 ms and 88%.
Item 30: written kill-switches. The strategy has 3 to 5 written kill-switch triggers (drawdown threshold, Sharpe threshold, profit-factor threshold, CUSUM trigger, execution-quality trigger). The thresholds are calibrated against the bootstrap and Monte Carlo distributions. The article "How to Detect When a Trading System Is Dying" gave the procedural manual.
Item 31: written decommission policy. The decommission policy is in writing, signed by the team and the allocator, before any capital is deployed. The article "Why Systems Work Until They Don't" framed the strategic case for written policies.
Item 32: capacity and scaling plan. The team has a written plan for scaling capital from initial deployment to target AUM, including the trigger conditions for each scaling step (typically a passing-grade quarter or a passing-grade Monte Carlo-implied test).
Using the checklist
A procedural sequence.
Step 1: the lead researcher fills out the checklist with one of three responses on each item: PASS, FAIL, or N/A WITH JUSTIFICATION. The justification for N/A is one sentence per item.
Step 2: a second team member reviews each item independently. Disagreements between the two responses are flagged and resolved before the checklist is finalized. The independent review catches the cases where the original researcher has stopped seeing a failure mode.
Step 3: the finalized checklist is attached to the strategy specification document. Any future change to the strategy that affects a checklist item triggers a re-evaluation of that item.
Step 4: at the deployment review, the committee reads the checklist line by line. Any FAIL or any N/A WITH WEAK JUSTIFICATION blocks deployment until resolved.
Step 5: post-deployment, the checklist is re-run at the 3-month, 6-month, and 12-month reviews. Items that pass at the IS stage may fail at the live stage (cost reconciliation diverging, execution latency higher than assumed, regime moving out of the validated distribution). The re-run is the operational form of the article "How to Detect When a Trading System Is Dying".
Anti-patterns
Five mistakes specific to the checklist artifact.
Anti-pattern 1: filling the checklist out as a formality. The team marks every item PASS without doing the underlying analysis. The artifact looks like integrity work and is the opposite of it. The cure: independent review by a second team member, and a committee that asks specific follow-up questions on at least 5 random items per checklist.
Anti-pattern 2: building the checklist into the research process at the end. The team does the research, falls in love with the strategy, then runs the checklist and rationalizes the failures. The checklist becomes a confirmation step rather than a gate. The cure: the checklist is filled out incrementally as the research progresses. Items 1 to 6 (data integrity) are passed before item 7 (causal pipeline) is started; item 14 (permutation test) is computed before item 21 (walk-forward).
Anti-pattern 3: skipping items the team treats as "fine by default". The team marks item 3 (survivorship) PASS because "we are using a major vendor that handles delistings". The vendor's handling has not been audited. The strategy turns out to be sensitive to the small-cap survivorship treatment. The cure: every PASS has a one-sentence justification that names the specific check performed.
Anti-pattern 4: not updating the checklist when the strategy changes. The team makes a small change to the parameter set or to the cost model; the previous checklist is left in place; the new strategy is now operating with a stale integrity statement. The cure: any strategy change triggers a re-run of the items affected by the change.
Anti-pattern 5: treating the checklist as the integrity work. The checklist is the artifact of the integrity work, not the work itself. A team that has the checklist filled out but has not internalized the disciplines that the checklist enforces is one personnel change away from losing all the integrity it had. The cure: the checklist is used as a teaching artifact for new team members and as a memory aid for the experienced ones, not as a substitute for understanding why each item is on the list.
Decision matrix
| Checklist outcome | Deployment decision | Follow-up |
|---|---|---|
| All 32 items PASS | Deploy at target size | Re-run checklist at 3/6/12 months |
| 1-2 items FAIL on low-criticality categories (5, 7) | Deploy at 30-50% size, fix flagged items in parallel | Re-run flagged items at 3 months |
| 1+ items FAIL on data integrity (category 1) | Do not deploy | Fix data pipeline, re-run full checklist |
| 1+ items FAIL on pipeline integrity (category 2) | Do not deploy | Fix pipeline, re-run categories 2 and 3 |
| 1+ items FAIL on statistical discipline (category 3) | Do not deploy | Address overfit / sample / leakage cause |
| 1+ items FAIL on robustness (category 4) | Do not deploy or deploy with gating | Add regime gate or shrink universe |
| 1+ items FAIL on cost modeling (category 5) | Do not deploy | Rebuild cost model, re-evaluate |
| 1+ items FAIL on risk/stops (category 6) | Do not deploy | Address stop or kill-switch design |
| 1+ items FAIL on deployment readiness (category 7) | Probationary deployment at reduced size | Resolve infrastructure or policy gap |
The matrix maps the type of failure to the type of action. Failures in categories 1 to 3 are blocking; failures in 5 and 7 may permit probationary deployment; failures in 4 and 6 require strategy modifications that may or may not preserve the original hypothesis.
Visualizing the checklist
KEY POINTS
- The backtest integrity checklist is the procedural artifact that converts a research result into a deployment-ready estimate. It does not replace the underlying disciplines; it is the operational form of having internalized them.
- The checklist has 32 items in 7 categories: data integrity (6 items), pipeline integrity (5), statistical-test discipline (5), regime and robustness (5), cost modeling (4), risk and stops (3), deployment readiness (4).
- Category 1 (data) covers source documentation, point-in-time alignment, survivorship-free universe, corporate-action handling, missing-data treatment, timezone and calendar handling.
- Category 2 (pipeline) covers causal data flow, independent reproduction, unit tests on critical functions, random-seed control, end-to-end pipeline regression.
- Category 3 (statistics) covers pre-specified hypothesis, trade-count adequacy of 200+ effective independent trades, permutation-test significance, k_eff and bias-corrected Sharpe reporting, CSCV / PBO below 0.30.
- Category 4 (robustness) covers regime stratification with positive performance in every required cell, cross-market sanity on comparable instruments, parameter perturbation surviving +/-25%, time-period robustness on non-overlapping sub-periods, walk-forward with no downward trend.
- Category 5 (costs) covers realistic per-trade cost modeling, cost-sensitivity table at 5 cost levels, capacity estimate at multiple AUM levels, live-vs-IS cost reconciliation plan at 3 and 6 months post-deployment.
- Category 6 (risk) covers bootstrap drawdown distribution with kill-switch at the 99th percentile, stop-loss audit comparing with-stop and without-stop versions, MAE/MFE distribution consistent with the hypothesized mechanism.
- Category 7 (deployment) covers execution-infrastructure match, written kill-switches with calibrated thresholds, written decommission policy signed before capital is deployed, written capacity scaling plan with trigger conditions.
- The bias-corrected Sharpe formula: raw IS Sharpe minus sigma_IS times sqrt(2 log k_eff). For raw SR 1.6, N = 500 trades, k_eff = 1000, the correction is approximately 0.17. The corrected value is the deployment-relevant estimate.
- The procedural sequence: lead researcher fills the checklist, second team member reviews each item independently, finalized checklist is attached to the strategy specification, committee reads line by line at deployment review, checklist is re-run at 3, 6, and 12 months post-deployment.
- Anti-pattern: filling the checklist as a formality without the underlying analysis. Anti-pattern: running the checklist at the end rather than incrementally throughout research. Anti-pattern: skipping items that look "fine by default" without recording the specific check performed. Anti-pattern: failing to update the checklist when the strategy changes. Anti-pattern: treating the checklist itself as the integrity work.
- The matrix: failures in data, pipeline, or statistical categories block deployment outright; failures in cost or deployment-readiness permit probationary deployment with parallel resolution; failures in robustness or risk require strategy modifications that may invalidate the original hypothesis.
- The current article closes the Pillar 3 procedural arc. The combination of the diagnostic disciplines from the prior articles and the procedural checklist of this article gives the operational toolkit for converting an apparent IS edge into a deployment that is at least not failing for a known reason.
References
- Testing and Tuning Market Trading Systems - Timothy Masters (Amazon)
- Data Mining Algorithms in C++ - Timothy Masters (Amazon)
- Boosting Models for Nonlinear Alpha in Indian Equity Markets
- The GT-Score: A Robust Objective Function for Reducing Overfitting
- Forecast-to-Fill: Benchmark-Neutral Alpha and Billion-Dollar ... - arXiv
- FactorEngine: A Program-level Knowledge-Infused Factor Mining
- 1 Introduction - arXiv
- small-cap stock trading strategies for retail
- AlphaCrafter: A Full-Stack Multi-Agent Framework for Cross ... - arXiv
- SHARP: A Self-Evolving Human-Auditable Rubric Policy for ... - arXiv
- Backtesting trading risk of commercial banks using expected shortfall
- A Monte Carlo Comparison of Dynamic Strategies of Asset Allocation
- Evaluating LLMs in Finance Requires Explicit Bias Consideration
- A Momentum-Gated Hierarchical Optimisation Framework for ... - arXiv
- Black Magic Investigation Made Simple: Monte Carlo Simulations
- Generative AI in Finance and Data Science: A Review
- Preprint not peer reviewed
- Implementation Risk in Portfolio Backtesting: A Previously ... - arXiv
A note on AI. The ideas, research, analysis, and conclusions in this article are my own. I use AI tools to help with editing and wordsmithing, because English is not my first language, and I am not shy about that. AI-generated ideas and AI-assisted writing are not the same thing: the first is empty slop from a generic prompt, the second is a tool for communicating years of real research more clearly. Judge the work by its substance, not by whether software helped polish the prose.