4.44 Long-Term Market Timing from Fundamentals, Not Charts
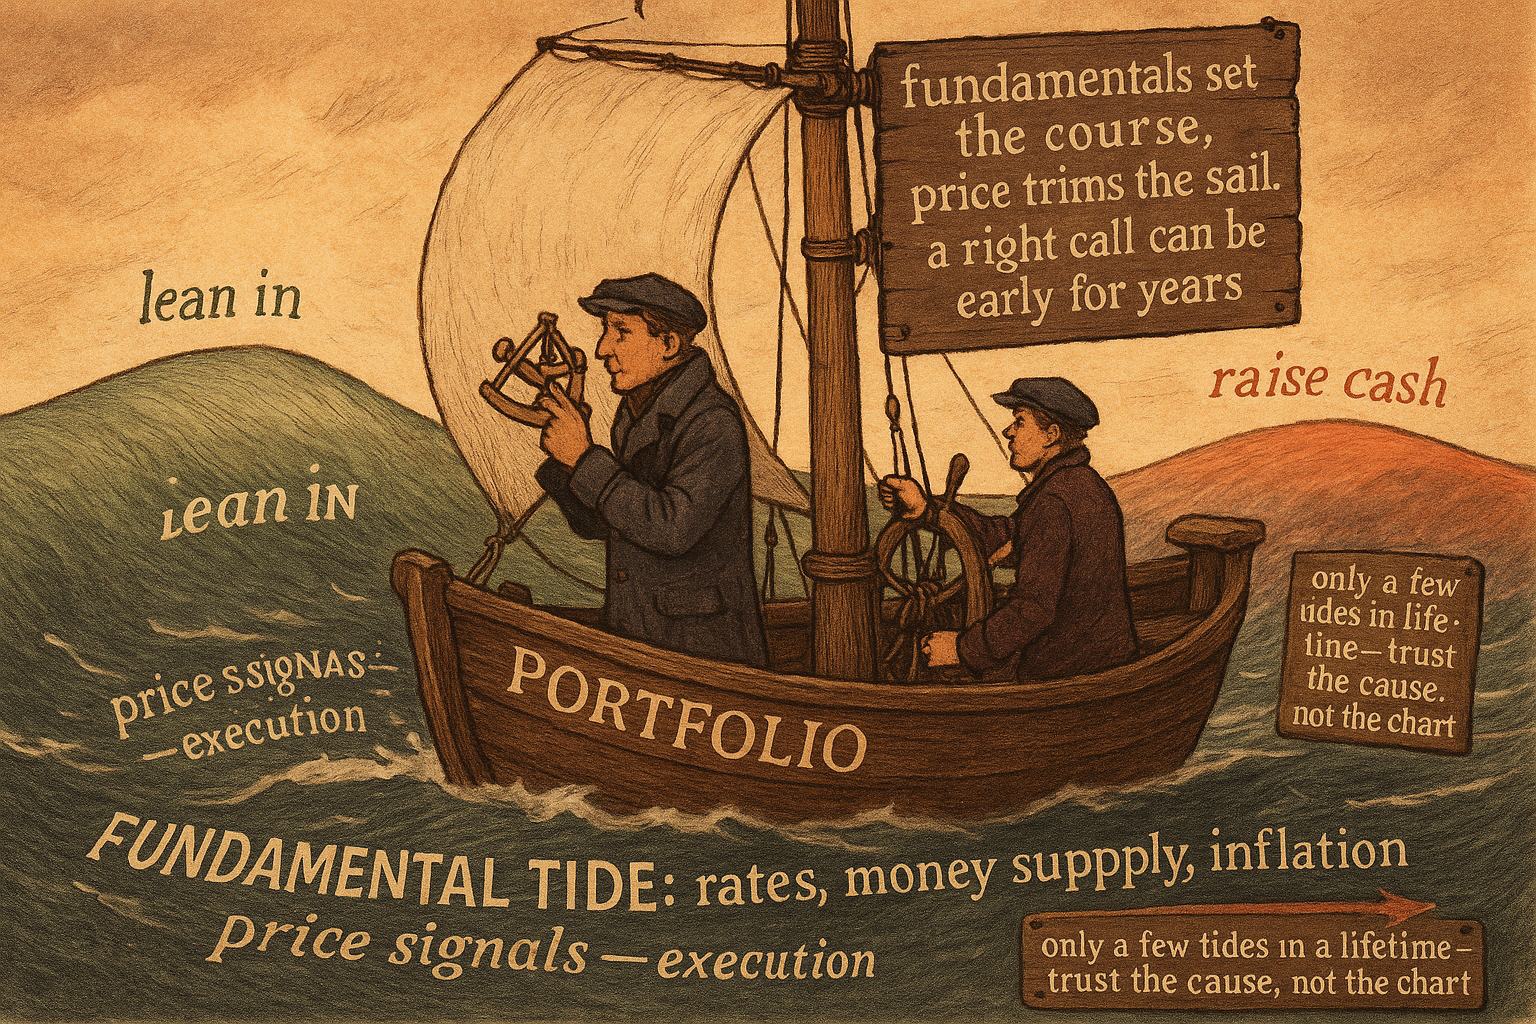
A moving average cannot see a decade-long trend. For multi-year timing, fundamentals lead and price lags. Use them to set the course, and let faster price signals trim the sail.
A moving average crossover cannot tell you whether stocks are entering a decade-long bull or a decade-long grind. It tells you what price did last week. For the slowest timing decisions, the multi-year tilt between owning stocks, owning bonds, or hiding in cash, the chart is the wrong instrument, because the forces that set those long swings are fundamental, and they move on a timescale the chart was never built to see. This article closes the macro-timing arc by stepping back from the individual signals and using the whole fundamental toolkit for the job it is actually suited to: timing trends measured in years.
The case for fundamentals here is not aesthetic. Over short horizons, price-based signals win because the fundamental data is too slow and too noisy to react in time. Over multi-year horizons, that flips. Fundamentals lead, price follows, and a chart-only trader is reading the smoke while the fundamentals are the fire. The inflation, money-supply, and rate signals built in the rest of this chapter are slow precisely because the trends they predict are slow, and that slowness is a feature when the holding period is measured in years.
What the fundamentals are timing
The two big slow trends are interest rates and the stock market, and they are linked. Stocks and long bonds are both discounted by the same long rate, the relationship "Using Bonds to Filter Equity Signals" used to gate equity trades, so a fundamental read on the rate trend is also a read on the equity backdrop. Falling rates lift the present value of future earnings and tend to support stocks; rising rates do the reverse. Time the rate trend and you have timed a large part of the equity trend for free.
The inputs are the ones already on the bench. The Real-Rate Ratio from "Predicting Interest Rates from Inflation: The Real-Rate Ratio" reads the inflation pressure on rates. The money-supply, confidence, and unemployment-duration signals from "Money Supply, Confidence, and Unemployment Duration as Rate Predictors" read the growth pressure. And the maturity split from "Short Rates Price the Present, Long Rates Price the Future" tells you which of those inputs to weight for which part of the curve. For multi-year timing you lean on the long-end drivers, money supply and expectations, because those are the ones pricing the future you are trying to position for.
$$ \text{long-term equity backdrop} \;\sim\; -\,\Delta(\text{long rate trend}),\qquad \Delta(\text{long rate trend}) \;\sim\; f\big(\text{money supply, inflation regime, growth}\big) $$
Read it as a chain, not a precise model. The equity backdrop improves when the long-rate trend falls, and the long-rate trend is driven by the money-supply, inflation, and growth fundamentals. So a fundamental read that points to falling long rates points, secondhand, to a supportive equity backdrop, and the reverse for rising rates. The arrows are tendencies with long and variable lags, which is the whole challenge.
Why this is timing, not prediction
The honest framing matters most here, because long-horizon fundamental timing is where overconfidence does the most damage. A fundamental setup that says "rates should fall over the next few years" is an explanation of the pressure on rates, not a prediction of the path. "The Difference Between Explanation and Prediction in Markets" drew this line, and it is sharpest at multi-year horizons: the explanation can be correct and the market can take three years to agree, during which you are early, which is indistinguishable from wrong on a brokerage statement.
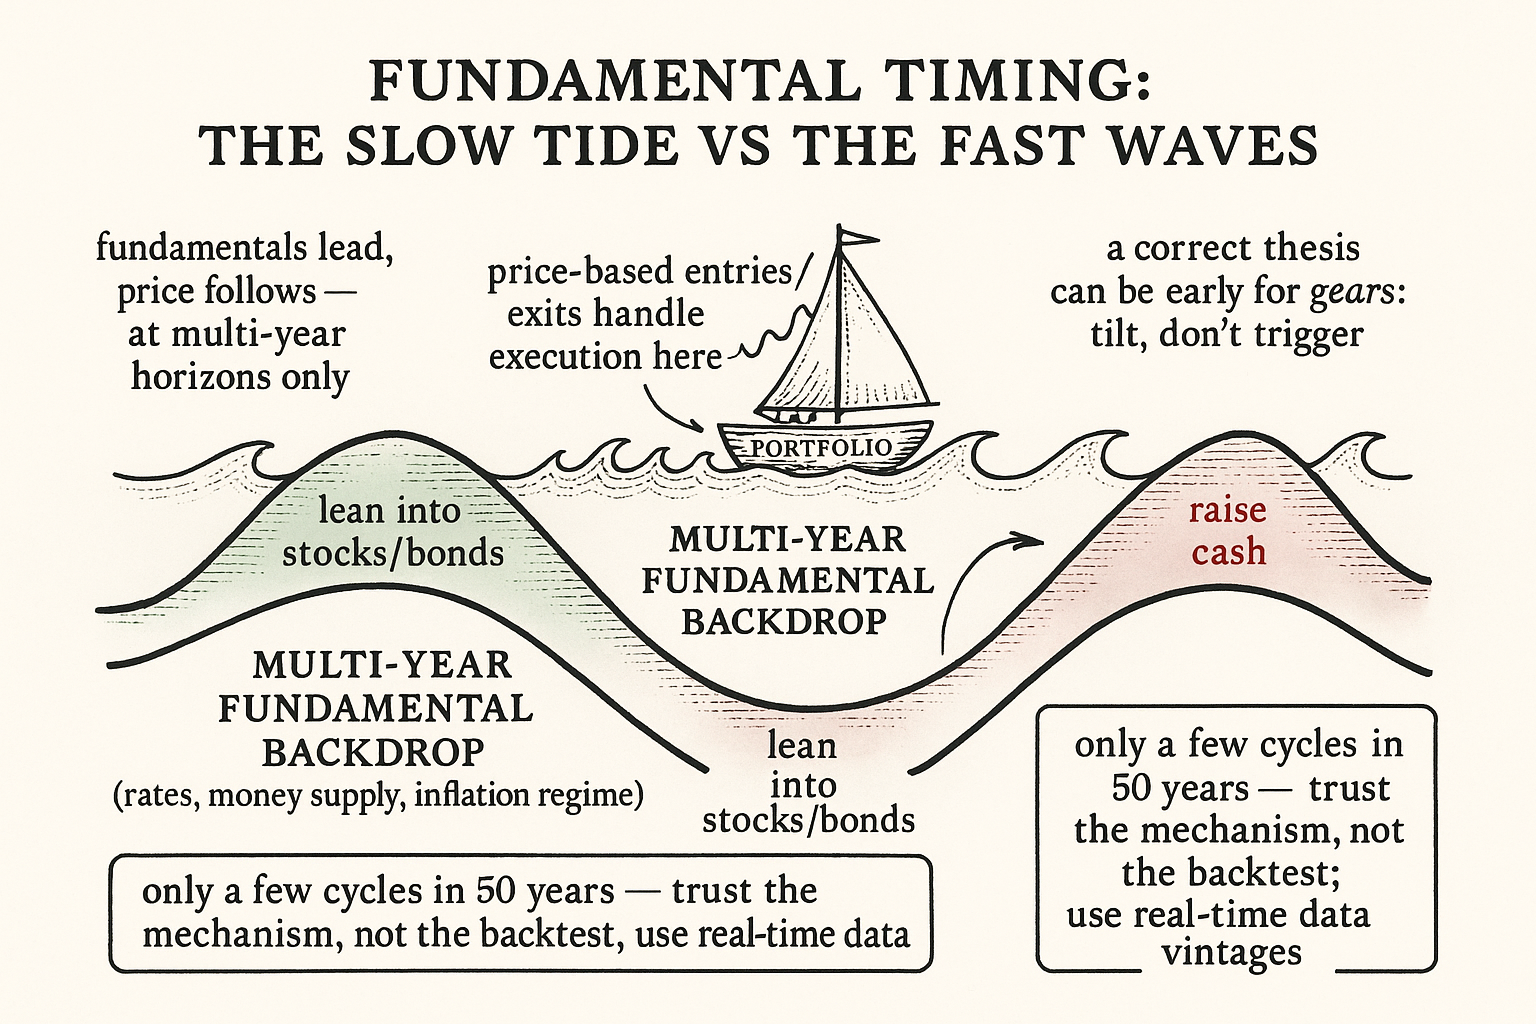
So fundamental timing buys you direction and backdrop, not entry precision. It tells you which way the slow tide is running and therefore which trades to favor and which to fade. It does not tell you the week to put the position on. The "long rates can stay artificially low for years" warning from the maturity article applies in full: a correct fundamental thesis can be punished for a long time before it pays, and sizing has to assume you will be early.
That is why long-term fundamental timing belongs in the role of a tilt, not a trigger. Use it to set the strategic lean, overweight equities and bonds when the fundamental backdrop is supportive, lighten up and raise cash when it turns hostile, and let faster, price-based systems handle the actual entries and exits inside that lean. The fundamental view is the wind; the price system is the sail. Trading the wind directly, with no regard for what price is doing, is how you end up short a market for three years because your macro model was right about a move that had not started.
The discipline this requires
Two failure modes kill fundamental timers, and both are avoidable.
The first is data that lies about what you knew. Macro series are published late and revised heavily, so a backtest of a fundamental timing model on final, revised data is fiction. You have to use the data vintage available on the decision day, the same real-time discipline from "How to Test Indicator Thresholds Without Fooling Yourself," or your beautiful multi-year timing model is reading numbers it could not have had. At long horizons this is worse, not better, because revisions accumulate and a few mis-dated releases can flip the whole signal.
The second is the small sample problem. Multi-year trends are rare. A 50-year history contains only a handful of complete rate-and-equity cycles, so any timing rule tuned on that history is fit to a tiny number of independent events, and "it worked across every major cycle" might mean it worked across four. That is not a sample, it is an anecdote with good production values. A fundamental timing rule has to rest on a mechanism robust enough to trust on causal grounds, because the statistics will never be strong enough to carry it alone, the exact bind this whole pillar keeps returning to: at the slowest horizons, the cause does more of the work than the backtest can.
The verdict is narrow and useful. Fundamentals are the right instrument for multi-year timing, where they lead and the chart lags, but they deliver a strategic tilt with a wide error bar, not a dated signal. Treat the fundamental backdrop as the slow context that decides which way to lean, run faster systems for execution inside that lean, respect the lag, and never trust a multi-year rule that has only a handful of cycles and no mechanism behind it.
Visualizing fundamental timing
KEY POINTS
- For multi-year timing decisions, the strategic tilt between stocks, bonds, and cash, the chart is the wrong instrument. The forces setting those long swings are fundamental and move on a timescale price signals cannot see.
- The slowness of fundamental data is a feature at long horizons. Over years, fundamentals lead and price follows; the chart-only trader reads the smoke while fundamentals are the fire.
- Rates and stocks are linked through the same long discount rate, so a fundamental read on the rate trend is also a read on the equity backdrop. Falling rates support stocks, rising rates pressure them.
- The inputs are the chapter's toolkit: the Real-Rate Ratio for inflation pressure, money supply/confidence/duration for growth pressure, and the maturity split to weight long-end drivers for multi-year work.
- This is timing, not prediction. A correct fundamental thesis gives direction and backdrop, not entry precision, and can be early for years, which looks identical to wrong on a statement.
- Use fundamentals as a strategic tilt, not a trigger: set the lean with the backdrop, let faster price-based systems handle entries and exits inside it. The fundamental view is the wind, the price system is the sail.
- Two failure modes: backtesting on revised data instead of real-time vintages, and tuning a rule to a tiny sample of multi-year cycles. At the slowest horizons the mechanism must carry the rule, because the statistics never will.
References
- Trading Systems and Methods - Perry Kaufman (Amazon)
- Cybernetic Trading Strategies - Murray Ruggiero (Amazon)
- The Art of Currency Trading - Brent Donnelly (Amazon)
- The Term Structure of Real Rates and Expected Inflation
- The Determination of Long-Term Interest Rates
- Price Inflation, Portfolio Choice and Nominal Interest Rates
- Forecasting the Real Interest Rate
- Monetary Policy Drivers of Bond and Equity Risks
- Natural and Neutral Real Interest Rates: Past and Future
- Origins of Stock Market Fluctuations - NBER
- Unemployment, Consumer Confidence, Business Confidence