2.7 How to Test Indicator Thresholds Without Fooling Yourself
scanning 41 RSI thresholds and reporting the best one inflates the naive p-value by an order of magnitude. The right test shuffles the target, re-runs the full threshold scan thousands of times, and compares the observed best statistic to the distribution of best statistics from noise.

You compute a 14-day RSI on SPX, target sign(P_{t+1}/P_t - 1), and scan 41 candidate "buy below this RSI" thresholds from 5 to 45 in steps of 1. Threshold 27 gives mean forward return +0.082% per day at a t-statistic of 2.41. The naive p-value at α = 0.05 looks clean. You ship it.
Live performance over 18 months: indistinguishable from the unconditional mean. The threshold did not break. The p-value broke.
This article is about the gap between the t-statistic the optimizer printed and the one a third party would have to defend in front of new data. The gap is large enough that most published "RSI below X works" results are noise dressed in 2.0 to 2.5 t-statistic clothing.
Why "best threshold" is the wrong frame
When you scan K thresholds and report the best, the statistic you printed is not the t-statistic of one test. It is the maximum of K t-statistics computed on the same data. Under the null hypothesis that the indicator carries no information, the maximum of K test statistics has a known distribution. It is not the marginal distribution of a single test.
The simple version of the inflation:
If the K tests are independent and each has marginal p-value α, the family-wise error rate is 1 - (1-α)^K. For K = 41 and α = 0.05, the chance of at least one t-statistic clearing 1.96 under H_0 is 1 - 0.95^41 ≈ 0.88. Almost certain.
The candidate thresholds are not independent. They are smooth shifts of the same underlying ranking, so the effective number of tests is smaller than 41. The naive Bonferroni correction (multiply your reported p by K) is too conservative. The right correction is empirical: estimate the distribution of the maximum-statistic under the null by permutation, then compare your observed maximum to that distribution.
The permutation test of the entire search
The procedure has five steps. The cost is one shuffle and one full re-scan per replication. Sub-second on any modern laptop for a 9000-bar series.
- Compute the statistic of interest at every candidate threshold on the real data. Record the maximum and the threshold at which it occurred. Call these t_obs and θ_obs.
- Shuffle the target series y relative to the indicator X. The shuffle breaks the temporal link between indicator state and forward return while preserving the marginal distribution of both.
- Re-run the full threshold scan on (X, y_shuffled). Find the new maximum t_max,b across the same K candidate thresholds.
- Repeat steps 2 and 3 for B replications. B = 5000 is the floor.
- The permutation p-value of the search is the fraction of replications where t_max,b ≥ t_obs.
The permutation p-value is the honest one. It accounts for the search process. If 14% of the 5000 shuffled datasets produced a "best threshold" t-statistic at least as large as 2.41, your real result is consistent with what the search process produces from noise alone.
For block-time-series data, replace the iid shuffle with a block bootstrap (5 to 20 day blocks). The block bootstrap preserves autocorrelation and volatility clustering. The article "The Null Hypothesis for Trading Systems" covers null model selection.
Worked example: RSI thresholds on SPX
SPX daily, 1990 to 2026, 9100 bars. Target y_t = sign(P_{t+1}/P_t - 1). Indicator: 14-day RSI. Scan 41 "buy below θ" thresholds from 5 to 45 in steps of 1. Statistic: t-statistic of the conditional mean forward return inside the threshold versus the unconditional mean.
Four readings.
The naive p of 0.016 looks publishable. It is the p-value of one specific test of one specific threshold. You did not test one threshold. You tested 41.
Bonferroni at K = 41 gives p = 0.66. Far too pessimistic, since the 41 thresholds are correlated draws on the same underlying ranking. Bonferroni assumes independence the data does not have.
The IID permutation of the full search gives p = 0.18. Above the 0.05 bar. The search-adjusted result is consistent with chance under a null that preserves the marginal distributions but breaks the autocorrelation.
The block bootstrap permutation, which preserves the autocorrelation and volatility clustering structure of the data, gives p = 0.31. The IID null underestimates how often "winning" threshold statistics emerge from clustered noise. The realistic null says 31%.
The "RSI < 27 works on SPX" result is the search process picking the maximum of 41 correlated noisy samples on clustered data. The signal is not distinguishable from the noise once the search is accounted for.
The plateau requirement
A second test runs alongside the permutation: the threshold must sit in a smooth region of the threshold-statistic curve. The same loose-pants argument from the article "Loose Pants Fit Everyone: Why General Trading Ideas Survive Longer" applies here.
Plot the conditional statistic (mean forward return, profit factor, Sharpe) as a function of the threshold across the candidate range. Two readings.
A smooth concave region with the chosen threshold near its peak. Moving the threshold ±20% of its range changes the statistic by less than 10%. Real signal. The threshold is a property of the region, not of one number.
A single needle spike at the optimizer's chosen value, with neighboring thresholds at half the statistic. Curve-fit. The threshold is the maximum of a noisy surface and lives at a fragile point.
Operationally, after the permutation test passes, fit a smoothing spline to the threshold-statistic curve. The spline's local maximum is closer to the structural threshold than the raw optimizer's pick. Deploy the spline maximum if the underlying curve has a plateau. Reject the indicator if the curve is a single spike, regardless of how good the permutation p-value looked.
Walk-forward as the second filter
Permutation handles the search-bias problem on a single dataset. It does not handle the regime-shift problem on a non-stationary series.
Walk-forward threshold selection:
- Split history into rolling training and forward windows. Typical: 5-year training, 1-year forward.
- Run the full threshold scan plus permutation test on the training window. If permutation p > α, drop the indicator. If p ≤ α, record the threshold from the training window.
- Evaluate the indicator at the recorded threshold on the forward window, with no re-optimization.
- Roll the window forward and repeat.
The walk-forward concatenation of forward-window evaluations is the out-of-sample performance. If the indicator passes the in-sample permutation test in window 1 but the threshold drifts by 30% across windows, the threshold is fitting noise per window. The indicator is not structurally informative; the search is relocating the noise peak.
The walk-forward also generates a confidence interval on the live behavior. The 5th and 95th percentiles of the forward-window statistics across rolling windows are a non-parametric CI that reflects both the sampling uncertainty and the regime drift. Report the CI alongside the point estimate. The article "The Problem with One Sample of Market History" covers why this CI matters more than the in-sample one.
The single-threshold alternative
The cheapest defense against threshold-search bias is to skip the search entirely. Pre-commit to a single threshold from a structural property of the data.
Three candidates, in order of preference:
- The indicator's in-sample median. A two-sample test "above median vs below median" is one test, not K. No selection bias.
- A theoretical threshold from the indicator's construction. RSI has 30 and 70 as boundary values designed by construction. They are not optimized to your data.
- The quantile that splits the indicator population at the prior probability of the target event. For a target with a 53% positive rate, the 53rd percentile of the indicator.
A single pre-committed threshold gives one t-statistic with one p-value and no search inflation. The cost is power: the pre-committed threshold may not be where the signal lives. The benefit is honesty.
The right deployment is to use the single threshold for the indicator's "does this carry information" test, and to use the search-with-permutation for the threshold's "where does the information concentrate" test. Two different questions, two different protocols. Mixing them produces a search inflation dressed as a confirmation test.
Visualizing the search bias
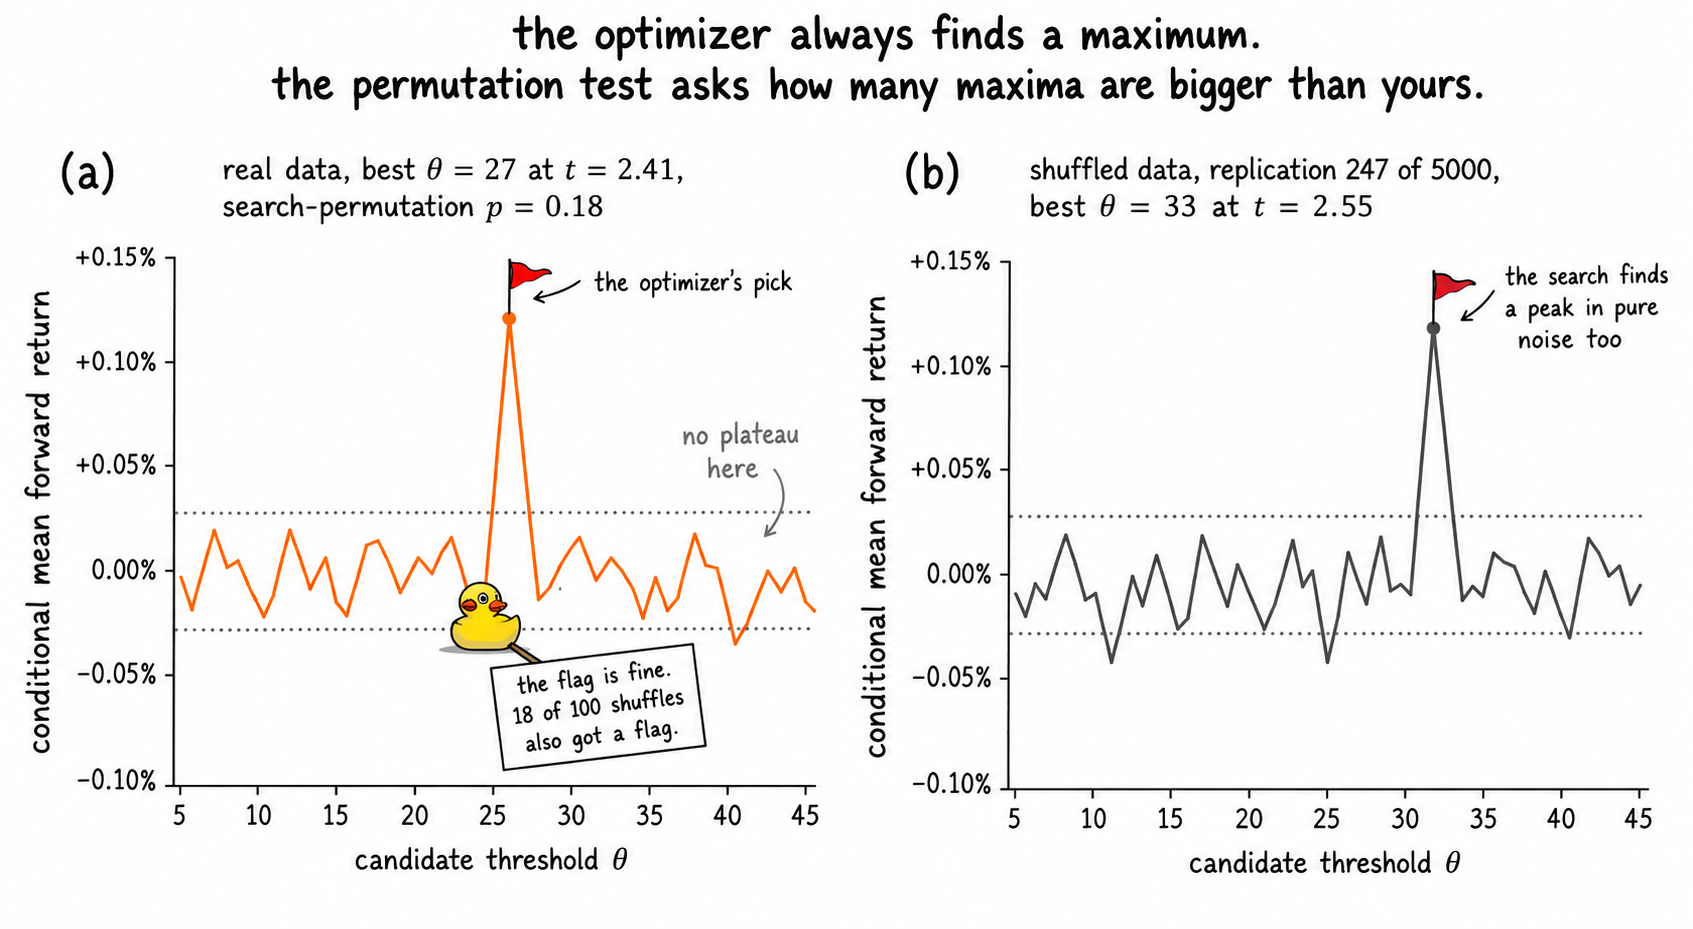
The two panels are the central diagnostic. The optimizer always finds a maximum. The honest question is how often noise finds a maximum at least as big.
What this changes in practice
Three operational shifts.
The reported p-value is the search-adjusted permutation p-value, not the naive p-value of the winning threshold. If the indicator's permutation p is above α, the indicator does not ship, regardless of how good the winning t-statistic looked.
Every threshold deployed to live trading has a recorded plateau check. The threshold is replaced by the local maximum of a smoothing spline through the threshold-statistic curve when the underlying curve has a plateau. The threshold is rejected when the underlying curve is a single spike, regardless of permutation p-value. The permutation handles the false discovery rate. The plateau handles the fragility.
Walk-forward thresholds are recorded across rolling windows. If the threshold drifts by more than 30% across windows, the indicator is fitting noise per window. The forward-window concatenation provides the out-of-sample CI that the in-sample t-statistic cannot.
KEY POINTS
- Reporting the best of K threshold tests treats a maximum-of-K statistic as if it were a single test. Under H₀, the family-wise error rate is 1 - (1-α)^K. For K = 41 candidate thresholds at α = 0.05, the probability of at least one false positive is around 88%.
- Bonferroni multiplies the naive p by K. For correlated threshold candidates the correction is too conservative. The right correction is empirical via permutation of the entire search.
- The permutation test: shuffle the target relative to the indicator, re-run the full threshold scan, record the maximum statistic. Repeat 5000 times. The p-value of the search is the fraction of permuted maxima at least as large as the observed maximum.
- For autocorrelated and volatility-clustered series, use block bootstrap with 5 to 20 day blocks instead of an IID shuffle. The realistic null produces larger permutation p-values than the IID null.
- The plateau requirement: the chosen threshold must sit in a smooth region where ±20% threshold shifts change the statistic by less than 10%. A single-needle peak surrounded by lower values is curve-fit and fails this test regardless of permutation p.
- Walk-forward threshold selection generates the out-of-sample evaluation. Threshold drift of more than 30% across rolling training windows indicates noise-fitting, regardless of in-sample permutation p-value.
- A pre-committed single threshold (median, theoretical construction value, or marginal-probability quantile) eliminates search bias by construction. Lower power, but the resulting p-value is interpretable without correction.
- The search-with-permutation is the right tool for "where does the indicator's signal concentrate." The pre-committed threshold is the right tool for "does the indicator carry any signal at all." Use both, on different questions.
- On SPX 14-day RSI with 41 thresholds, the naive winning p-value of 0.016 becomes 0.18 under IID search-permutation and 0.31 under block-bootstrap permutation. The published "RSI < 27 works" result is consistent with chance once the search is accounted for.
- The plateau and permutation diagnostics belong to the indicator's threshold definition, not to a free knob optimized on the backtest. They are computed once at design time and stored with the indicator-threshold pair.
References
- Statistically Sound Indicators for Financial Market Prediction - Timothy Masters (Amazon)
- Cycle Analytics for Traders - John Ehlers (Amazon)
- Technical Market Indicators: An Overview
- Digital Signal Processing, System Analysis and Design, 2nd Edition
- FINANCIAL TIME-SERIES PREDICTION USING DEEP LEARNING
- A Simple Yet Powerful Data Augmentation for Time-series Prediction
- Rocket Science for Traders: Digital Signal Processing Applications
- deep learning inductive biases for fmri time series classification
- Introduction to Real-Time Digital Signal Processing
- FORECASTING FINANCIAL TIME SERIES USING HYBRID MODELS