1.7 Loose Pants Fit Everyone: Why General Trading Ideas Survive Longer
The best-looking backtests are often the most fragile. Rules optimized to fit one market, one period, and one parameter set rarely survive live trading. Robust systems behave like loose pants: imperfect, flexible, and stable across many instruments, regimes, and parameter choices.
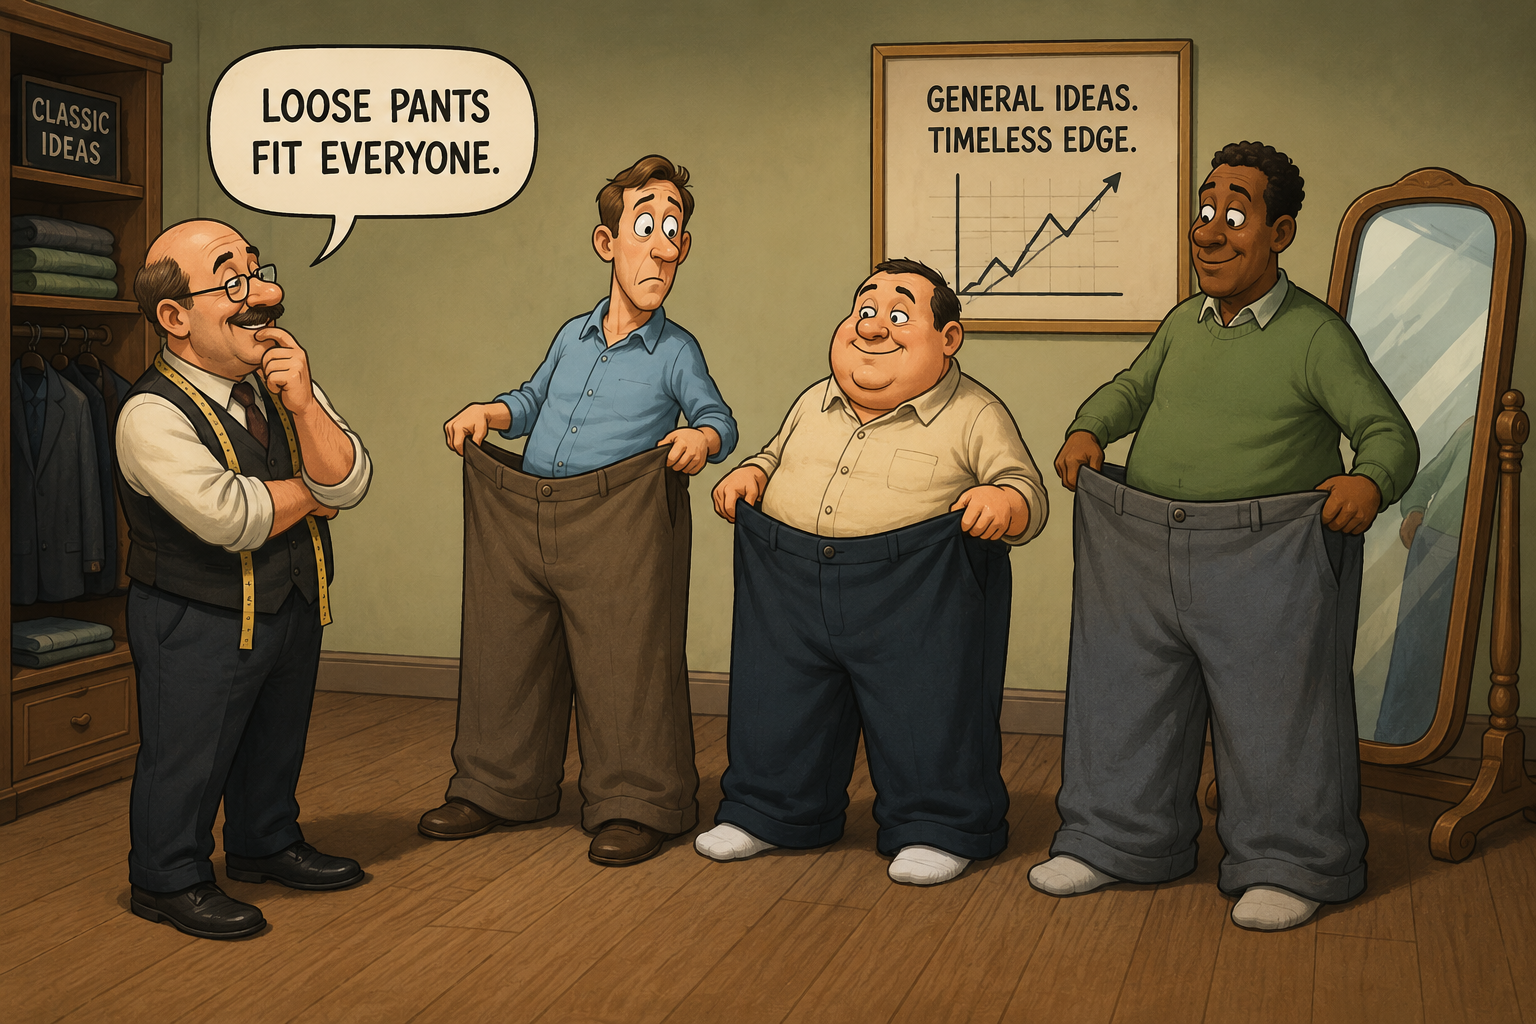
Loose pants fit a wide range of waist sizes. Tailored trousers fit one waist exactly and nothing else. A trading rule should be sized like the loose pants.
The two design philosophies sit at opposite ends of the rule-building spectrum. Tailored rules calibrate every parameter to maximize backtest Sharpe on the in-sample period. Loose rules pick parameter ranges that work at an acceptable level across many parameter combinations, many instruments, and many time windows. The tailored rule wins on the backtest. The loose rule wins on the live account.
The structural argument for generality
A rule that works at one specific parameter setting and dies at adjacent settings has two failure modes baked into it.
The first is parameter drift. Markets change. The "best" lookback length in 2018 is not the "best" lookback length in 2024. A rule with a sharp performance peak at one parameter setting loses most of its return when the regime shifts the location of the peak by 20%.
The second is selection bias. If you tested 200 parameter combinations and picked the one with the highest Sharpe, the displayed Sharpe is inflated by the search process. The expected out-of-sample Sharpe sits well below the in-sample one. The wider the search and the narrower the peak, the larger the gap.
A rule that works across a broad parameter range has neither problem. There is no peak to drift away from. There is no peak to over-select. The performance is the property of the family of rules, not of any individual member.
The robustness ratio
A simple diagnostic for whether a rule is loose or tailored. Compute the Sharpe ratio across a parameter sweep covering the surrounding region of the parameter you chose. Then take the standard deviation of those Sharpes and divide by their mean.
The measure is the coefficient of variation of performance across nearby parameter choices. Low R means the rule performs in a similar way across the sweep, which is loose-pants behavior. High R means small changes in parameters produce large changes in performance, which is skinny-jeans behavior.
The parameter you picked from the backtest is one draw from a distribution of parameter choices. In live trading, the equivalent draws are the parameters that will turn out to be optimal in each future window. If R is low, your draw and the future draws produce similar performance. If R is high, your draw is one of many possible draws, and most of the others are worse than the one you saw.
Practical thresholds. R below 0.3 suggests the rule is stable across the parameter window. R above 0.6 suggests the rule is concentrated at a peak that is unlikely to survive.
Visualizing the difference
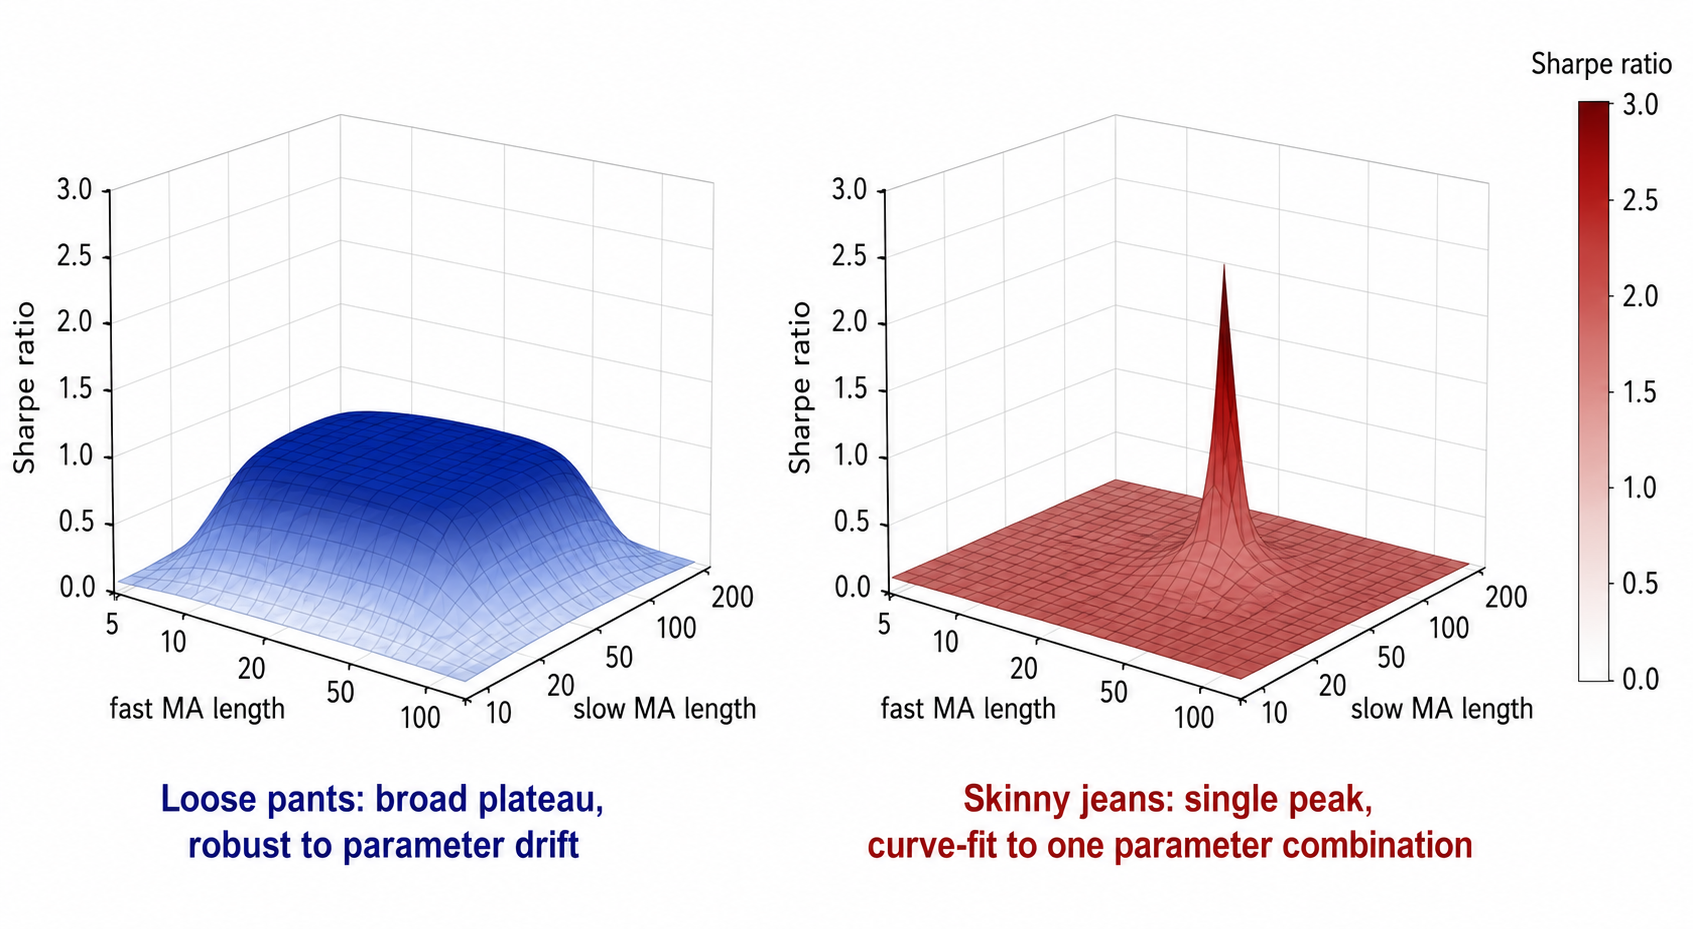
The left surface in the visual is the rule you want to trade. The right surface is the rule that will die in live trading. Both look fine on a single-point backtest report. Only the surface view reveals which is which.
Cross-market generality
Parameter robustness is one dimension of generality. Cross-market robustness is the other.
A rule that works on GBPUSD 30-minute bars and only on GBPUSD 30-minute bars is fitting something specific to that instrument and that timeframe. A rule that works on GBPUSD, EURUSD, AUDJPY, and USDCAD, on 15-minute, 30-minute, 1-hour, and 4-hour bars, with the same parameter range, is fitting something structural in FX intraday price behavior.
The cross-market test does not require identical Sharpes across all instruments. It requires positive Sharpe on most instruments with parameters drawn from the same range. A rule that produces Sharpe 1.8 on one instrument and Sharpe minus 0.5 on five others is not a general rule. It is a one-instrument curve fit dressed in cross-market clothing.
A practical protocol: pick 8 to 12 instruments in the asset class the rule is designed for. Test the rule with the same parameter window on all of them. Count the instruments where the rule produces positive Sharpe after costs. If the count is below 60%, the rule is fitting the in-sample instrument, not the underlying behavior.
Cross-period generality
Time is the third dimension. The same rule with the same parameters should produce positive net performance across multiple non-overlapping historical windows.
Split the available history into thirds. Run the rule on each third independently. Compare the resulting Sharpe ratios. A loose rule produces three Sharpes within a factor of 1.5 of each other. A tailored rule produces three Sharpes where one is large and positive, the others are near zero or negative, and the large one corresponds to the period the rule was developed on.
The same protocol applies to walk-forward analysis. Re-optimize the rule's parameters in rolling training windows and apply them to forward windows. A loose rule produces optimized parameters that drift within a narrow band across windows. A tailored rule produces optimized parameters that jump around, sometimes by factors of 2x or 3x, because each new training window has different noise.
If the optimized parameters jump, the rule is not stable. The system is overfitting to whichever noise sample appears in the training window.
The cost of loose pants
Generality is not free. A loose-fitting rule has a lower in-sample Sharpe than a tailored rule by construction. If the tailored rule achieves Sharpe 2.4 at its peak and the loose rule produces Sharpe 0.9 across the plateau, the published comparison flatters the tailored rule.
The published comparison is the wrong comparison. The relevant comparison is expected live Sharpe.
The tailored rule's expected live Sharpe sits well below its in-sample Sharpe because the peak is fragile. The loose rule's expected live Sharpe sits close to its in-sample Sharpe because the plateau is stable.
The pattern is consistent across systematic strategy testing. Strategies built with the parameter that maximized in-sample Sharpe lose around half of that Sharpe out of sample. Strategies built on the broad center of the parameter plateau lose around 10% to 20%. The loose rule's live performance is close to its backtest. The tailored rule's live performance is a fraction of the backtest.
The trader who picks the in-sample peak is buying a worse expected live result for a better-looking backtest report. The trader who picks the plateau is buying a more accurate forecast of live performance, at the price of a less impressive marketing slide.
Designing for generality from the start
The protocol is operational, not aspirational.
- Pick a parameter range, not a parameter value. Trade the average of the range, or run an ensemble that combines several parameters across the range.
- Test on at least 8 instruments in the target asset class. Discard rules that work on fewer than 60% of them.
- Test on at least 3 non-overlapping historical periods. Discard rules where the Sharpe ratio across periods varies by more than a factor of 2.
- Compute R, the robustness ratio, on the parameter sweep before committing to the rule. Reject rules where R is above 0.6.
- Inspect the parameter surface visually. If you see a spike instead of a plateau, throw the rule out regardless of its Sharpe at the spike.
The set of rules that survives all five filters is small. Most of what passes the in-sample backtest dies at this stage. That is the point of the filters. The rules that make it through are the ones with structural edge, and structural edge is the only kind that compounds.
KEY POINTS
- A rule that works at one parameter setting and dies at adjacent settings is curve-fit. The peak is fragile and will not survive regime shifts.
- A rule that works across a parameter range, across multiple instruments, and across multiple historical periods is structural. It is fitting market behavior, not noise.
- The robustness ratio R = std(Sharpe across sweep) / mean(Sharpe across sweep) measures looseness. Below 0.3 is loose. Above 0.6 is fragile.
- Inspect the parameter surface visually. Plateaus survive. Spikes do not.
- Cross-market test: at least 8 instruments, at least 60% with positive net Sharpe under the same parameter window.
- Cross-period test: at least 3 non-overlapping historical windows, with Sharpe variation across windows below a factor of 2.
- Walk-forward optimized parameters that jump across windows by 2x or 3x are a sign that the rule is fitting noise. Stable optimized parameters across windows are a sign of structural edge.
- The tailored rule wins the in-sample backtest. The loose rule wins the live account. The published comparison is misleading because it does not include the out-of-sample degradation.
References
- Evidence-Based Technical Analysis - David Aronson (Amazon)
- Systematic Trading - Robert Carver (Amazon)
- Systematic Testing of Systematic Trading Strategies
- Avoiding Backtesting Overfitting by Covariance-Penalties
- Comparing Discretionary and Systematic Hedge Fund Performance
- Traditional Traders vs. Quant Traders: A Comparative Analysis of Strategies, Performance, and Market Interactions
- Backtesting
- [2412.12555] Parameters Optimization of Pair Trading Algorithm
- Pairs Trading Strategy Design and Backtest (TS)
- Systematic Testing of Systematic Trading Strategies