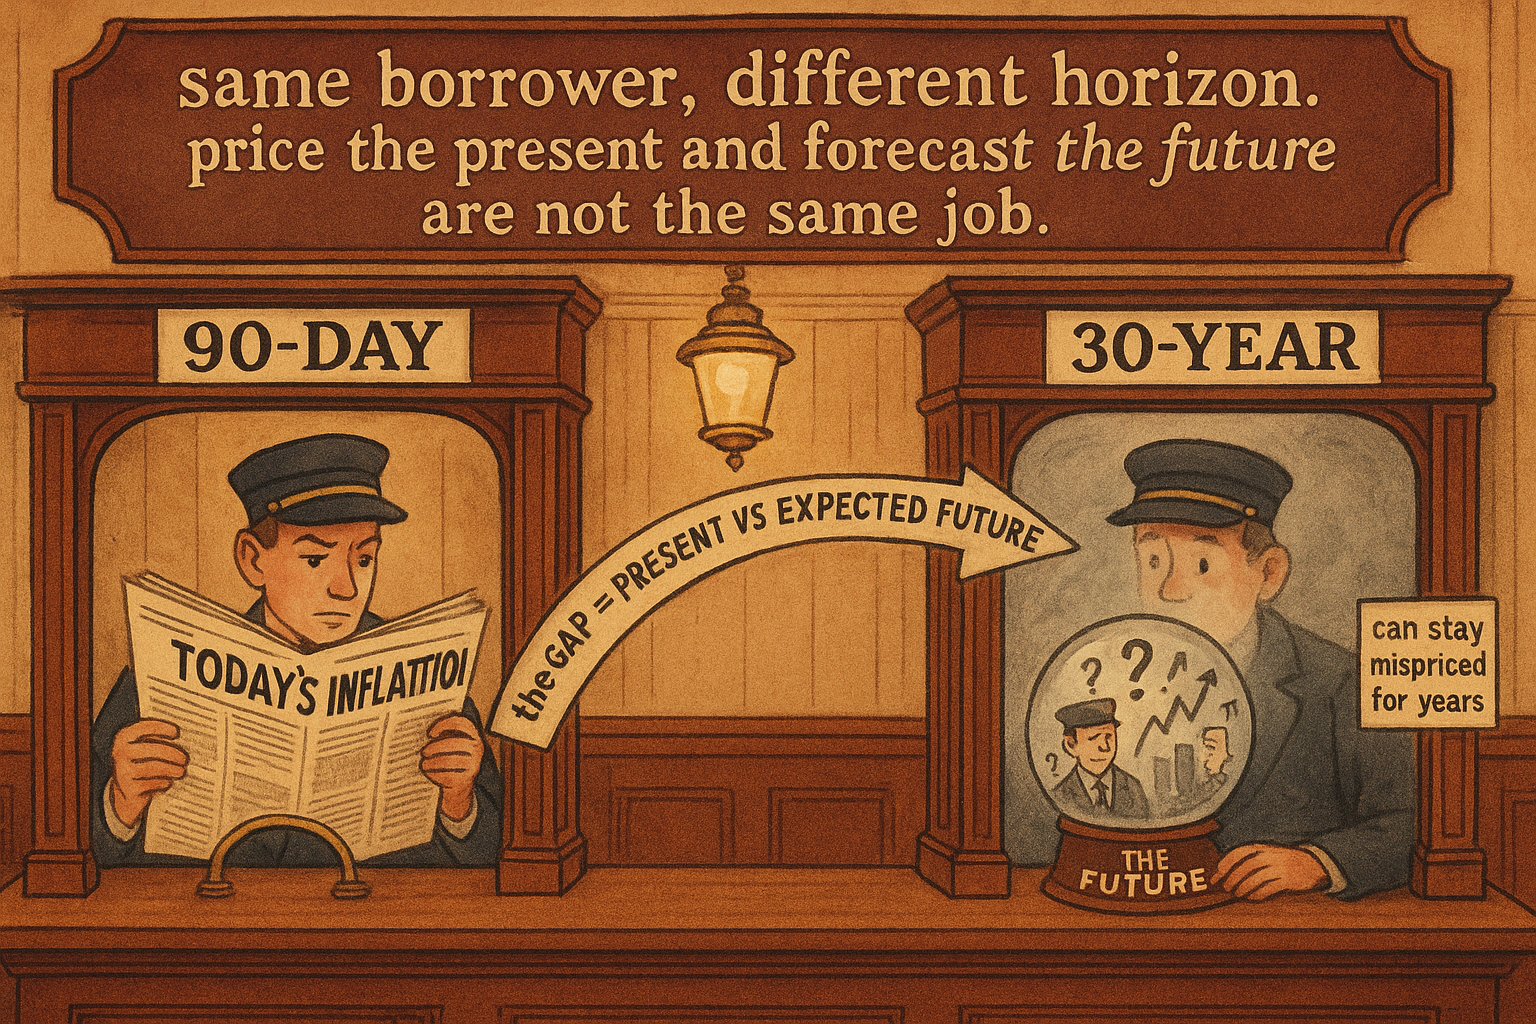
4.43 Short Rates Price the Present, Long Rates Price the Future
A 90-day bill prices today's inflation; a 30-year bond prices a future it cannot see. Inflation signals grip the short end and lose their grip on the long end, where money supply rules.
A 90-day T-bill and a 30-year bond are both loans to the same government, but they are pricing two different things. The bill prices what the economy is doing right now. The bond prices what the economy might do for the next three decades. That single distinction explains a fact that trips up traders who treat "interest rates" as one number: the inflation signal that works so well on short rates gets weaker and less reliable the further out the curve you go. The "Predicting Interest Rates from Inflation: The Real-Rate Ratio" article built a clean inflation-to-rates rule; this one explains where that rule applies and where it loses its grip.
Short rates are anchored to current economic activity. Long rates are anchored to the perceived effects of future activity. Today's inflation is a hard fact, so it grips the short end tightly. Future inflation is a forecast, a hope, a fear, and a hundred other things, so it grips the long end loosely. Same mechanism, different time horizon, very different reliability.
Why inflation grips the short end
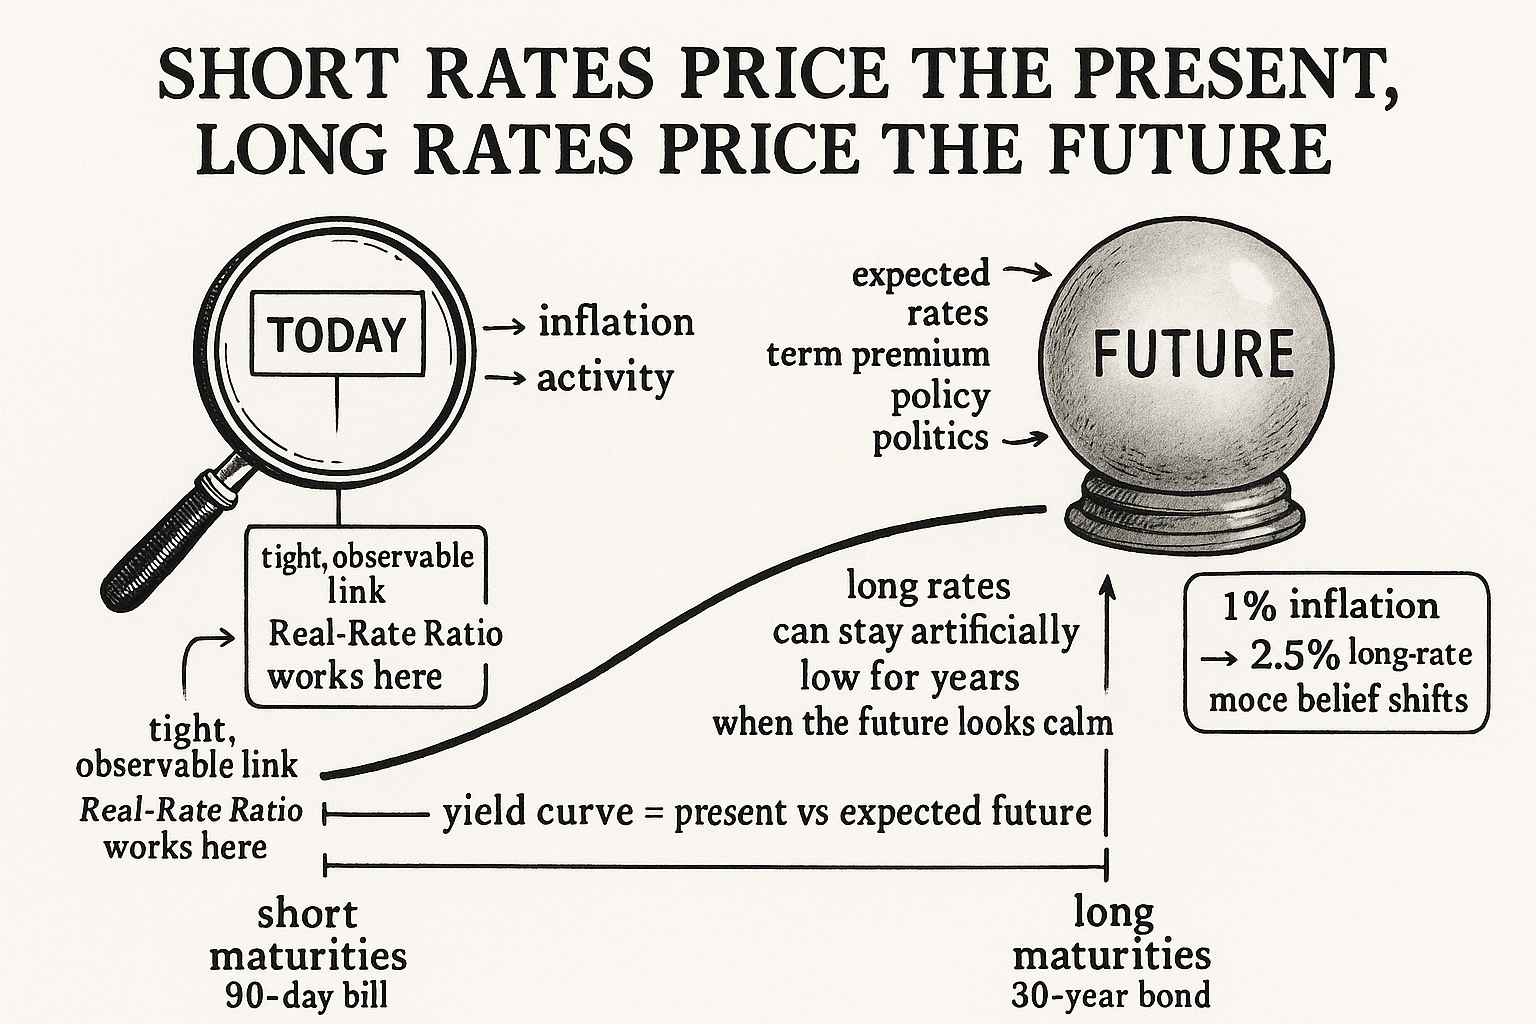
The short end has nowhere to hide from current conditions. A 90-day bill matures in three months, so the only inflation that matters to it is the inflation happening now and over the next quarter, which is observable. A lender pricing a three-month loan looks at today's inflation, demands a real return over it, and sets the yield. There is no room for a long story to override the present fact.
That is why the Real-Rate Ratio works best on short rates. The inputs, current inflation and current yield, are both about now, and the relationship between them is tight because neither side gets to argue about a distant future. When inflation runs hot relative to short yields, the squeeze is real and immediate, and short rates correct. The negative-real-rate setup that preceded the 1993 bond bear started as a short-end signal precisely because the short end has the cleanest read on present inflation.
Why the link loosens on the long end
The long bond has to price decades it cannot see. A 30-year yield is a bet on the average short rate over 30 years, plus a premium for the risk of being wrong, and that average depends on inflation, growth, policy, and politics that have not happened yet. Today's inflation is one input among many, and it gets diluted. The relationship between long rates and inflation is real but not as reliable as the short-rate version, because the long end is forecasting and forecasts are loose.
$$ \text{short rate} \;\approx\; f\big(\text{current inflation, current activity}\big) $$ $$ \text{long rate} \;\approx\; f\big(\text{expected average short rate over the term, term premium}\big) $$
The short rate is a function of things you can measure today. The long rate is a function of an expectation about the future path of short rates plus a term premium for uncertainty. Because the long rate's main input is an expectation, it responds to changes in the story, not changes in the present, which is why a long-end model built on current inflation alone underperforms the short-end version.
Two consequences fall out of this. First, long rates can be kept artificially low for extended stretches. During long periods of economic growth with low inflation, the market believes the calm will continue and prices the long end below where current data alone would put it. The term premium compresses because nobody is demanding much compensation for a future that looks placid. That belief can persist for years, and a trader shorting bonds on a current-inflation model will bleed the whole time.
Second, when long rates do respond to inflation, the response is amplified. A 1% increase in inflation has historically produced roughly a 2.5% increase in long-term rates. The long end sits still while the market believes the future is calm, then moves more than the inflation change itself once belief shifts, because a change in current inflation gets extrapolated across the whole remaining term. Long rates are stickier and then jumpier than the short end.
What this means for trading rate markets
Match the signal to the maturity. The inflation-based tools, the Real-Rate Ratio and its threshold rule, belong on the short end where the link is tight and the inputs are observable. Do not port a short-rate inflation model onto the 30-year and expect the same hit rate; you are asking a present-tense signal to forecast a future-tense instrument.
For the long end, weight the forward-looking and growth fundamentals more heavily. Money supply reaches the long end better than inflation does, the point from "Money Supply, Confidence, and Unemployment Duration as Rate Predictors," because money supply plants the future growth the long bond is trying to price. Expectations, policy stance, and the slow growth fundamentals carry more of the load out there, and you accept that the long end will be wrong-footed for long stretches when the market is committed to a calm-future narrative.
This also reframes the yield curve itself as information. The gap between long and short rates is the gap between the future the market expects and the present it can measure. When that gap compresses or inverts, the market is saying its forecast of the future diverges sharply from current conditions, and that divergence is a signal in its own right, the kind of cross-instrument read that "Using Bonds to Filter Equity Signals" used to gate equity trades. Short and long rates disagreeing is not noise; it is the present and the future pricing different things, which is exactly what they are built to do.
The takeaway is a placement rule, not a new indicator. Inflation signals go on the short end. Growth and expectation signals go on the long end. The curve between them is the market's forecast error waiting to be read. The next article, "Long-Term Market Timing from Fundamentals, Not Charts", takes this whole fundamental toolkit and uses it to time multi-year trends instead of quarters.
Visualizing the maturity split
KEY POINTS
- A short bill and a long bond price two different things: the bill prices current economic activity, the bond prices the expected effects of future activity. Treating "interest rates" as one number hides this.
- Inflation grips the short end tightly because a 90-day bill only cares about inflation it can observe now. That is why the Real-Rate Ratio works best on short rates.
- The long end prices an expectation: the average short rate over the term plus a term premium. Current inflation is one diluted input among many, so the inflation-to-long-rate link is real but less reliable.
- Long rates can stay artificially low for years when the market believes in a calm, low-inflation future and compresses the term premium. A short-rate model shorted against that belief bleeds the whole time.
- When long rates do respond, they amplify: roughly a 2.5% long-rate move per 1% inflation change, because the change gets extrapolated across the whole term. The long end is stickier, then jumpier.
- Match signal to maturity: inflation tools on the short end, growth and expectation fundamentals (money supply, policy) on the long end. Do not port a short-rate inflation model onto the 30-year.
- The yield curve is the gap between the expected future and the measured present. Compression or inversion signals that the market's forecast diverges from current conditions.
References
- Trading Systems and Methods - Perry Kaufman (Amazon)
- Cybernetic Trading Strategies - Murray Ruggiero (Amazon)
- The Art of Currency Trading - Brent Donnelly (Amazon)
- The Term Structure of Real Rates and Expected Inflation
- An Indicator of Future Inflation Extracted from the Steepness of the Interest Rate Yield Curve
- The Relationship Between Nominal Interest Rates and Inflation
- Price Inflation, Portfolio Choice and Nominal Interest Rates
- Inflation Changes, Yield Spreads, and Threshold Effects
- The Term Structure of Interest Rates and the Fisher Effect
- Inflation and Asset Prices
- Forward Return Expectations - NBER