4.46 Why Commercials Are Counter-Trend (and Lead by 2 Weeks)
Commercial hedgers sell into rallies and buy into selloffs because their business demands it, not their view. That makes their positioning a contrarian gauge that leads price by about two weeks.
A corn farmer does not sell futures because he thinks corn is going down. He sells because the price on offer is good enough to lock in a profit on a crop he has to grow anyway. When prices spike, more producers reach for that lock, so commercial selling rises into strength. When prices collapse, hedgers lift shorts and consumers buy forward to secure cheap supply, so commercial buying rises into weakness. The smart money in futures is mechanically counter-trend, and it is counter-trend for a business reason, not a market opinion. That single fact is what makes commercial positioning a leading indicator instead of a lagging one.
The "Reading the COT Report: Three Trader Groups, One Edge" article set up the three groups and flagged the commercials as the ones to watch. This article explains the mechanism behind why they lead, because a lead-lag relationship you cannot explain is a lead-lag relationship that will betray you, the warning that runs through "Lead-Lag Relationships in Global Markets." The commercial lead has a clean causal story, which is why it has held up.
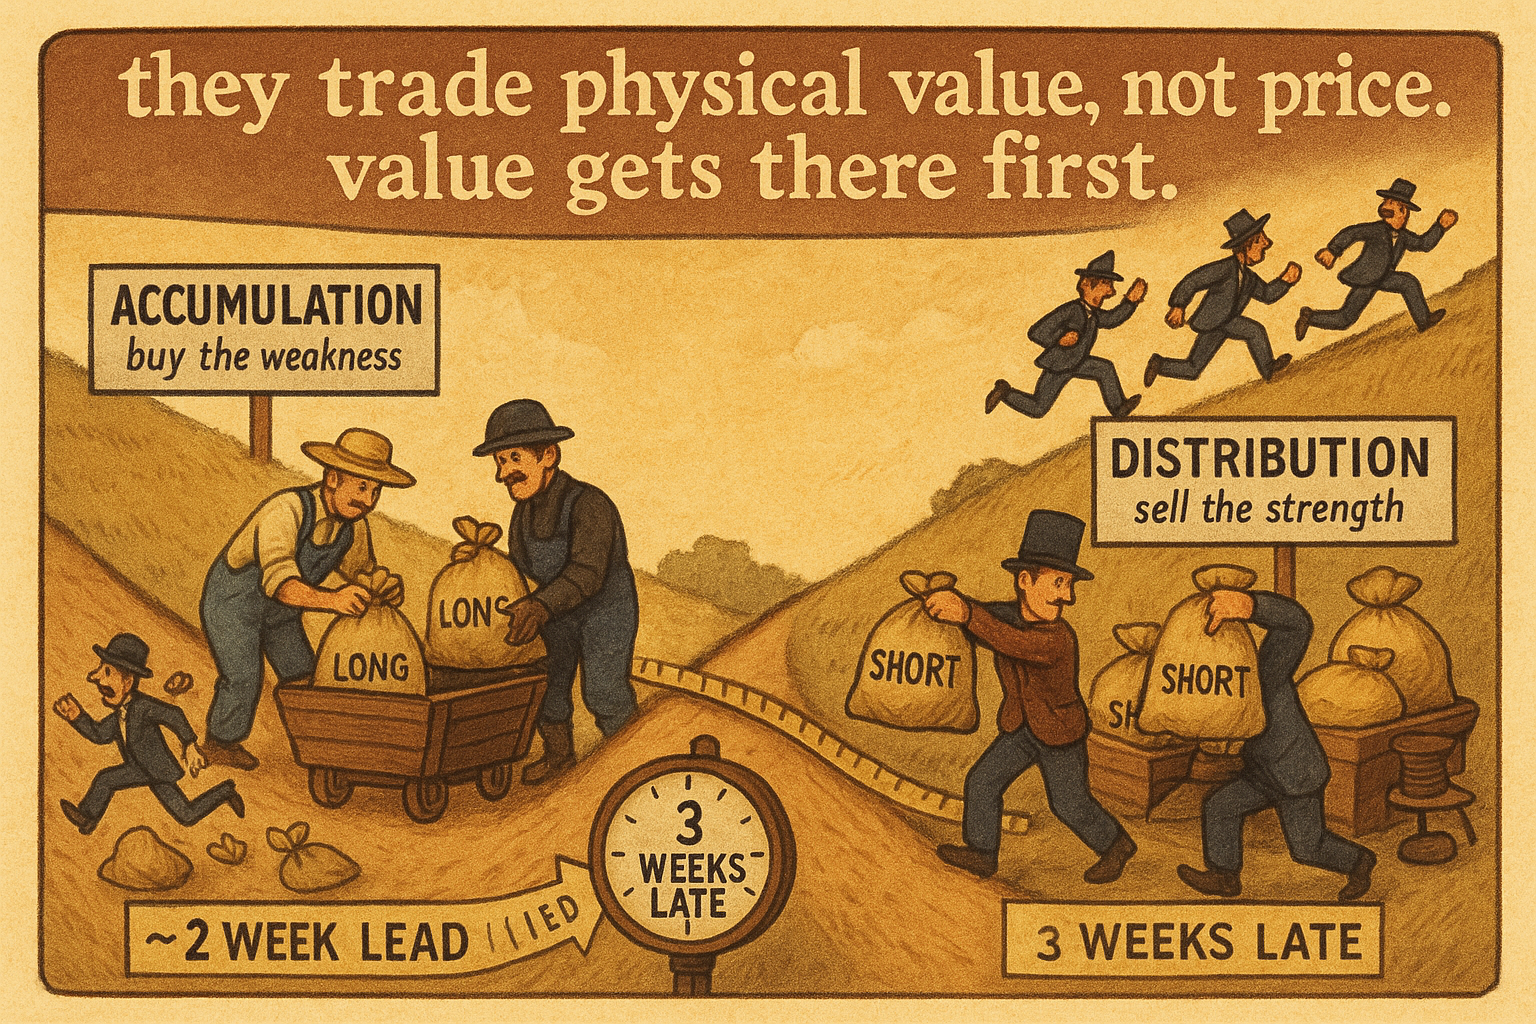
Accumulation and distribution
Commercials move size, and size cannot be deployed in a day without moving the market against yourself. So they work positions through a slow process of accumulation and distribution: buying patiently over weeks while prices are low and supply is cheap, selling patiently over weeks while prices are high. They are scaling in and out against the prevailing move, absorbing the futures that trend-followers and retail are dumping or chasing.
This is the opposite of how a speculator behaves. A trend-following fund adds to longs as price rises and the strength confirms its model. A commercial does the reverse: rising price is rising hedging opportunity, so it sells more. The two groups are structurally on opposite sides, which the zero-sum constraint from the previous article guarantees, but the point here is causal, not just accounting. Commercials buy as prices fall and sell as prices rise because their incentive is tied to the physical business, and that incentive points against the trend by construction.
$$ \text{price} \uparrow \;\Rightarrow\; \text{commercial selling} \uparrow \quad(\text{distribution}) $$ $$ \text{price} \downarrow \;\Rightarrow\; \text{commercial buying} \uparrow \quad(\text{accumulation}) $$
As price rises, commercials distribute, selling more into the strength. As price falls, they accumulate, buying more into the weakness. Read together, these say the commercial net position moves inverse to price: heavy net short near highs, heavy net long near lows. Their positioning is a contrarian gauge built by people who are not trying to be contrarian, which is what makes it trustworthy.
Why the lead is about two weeks
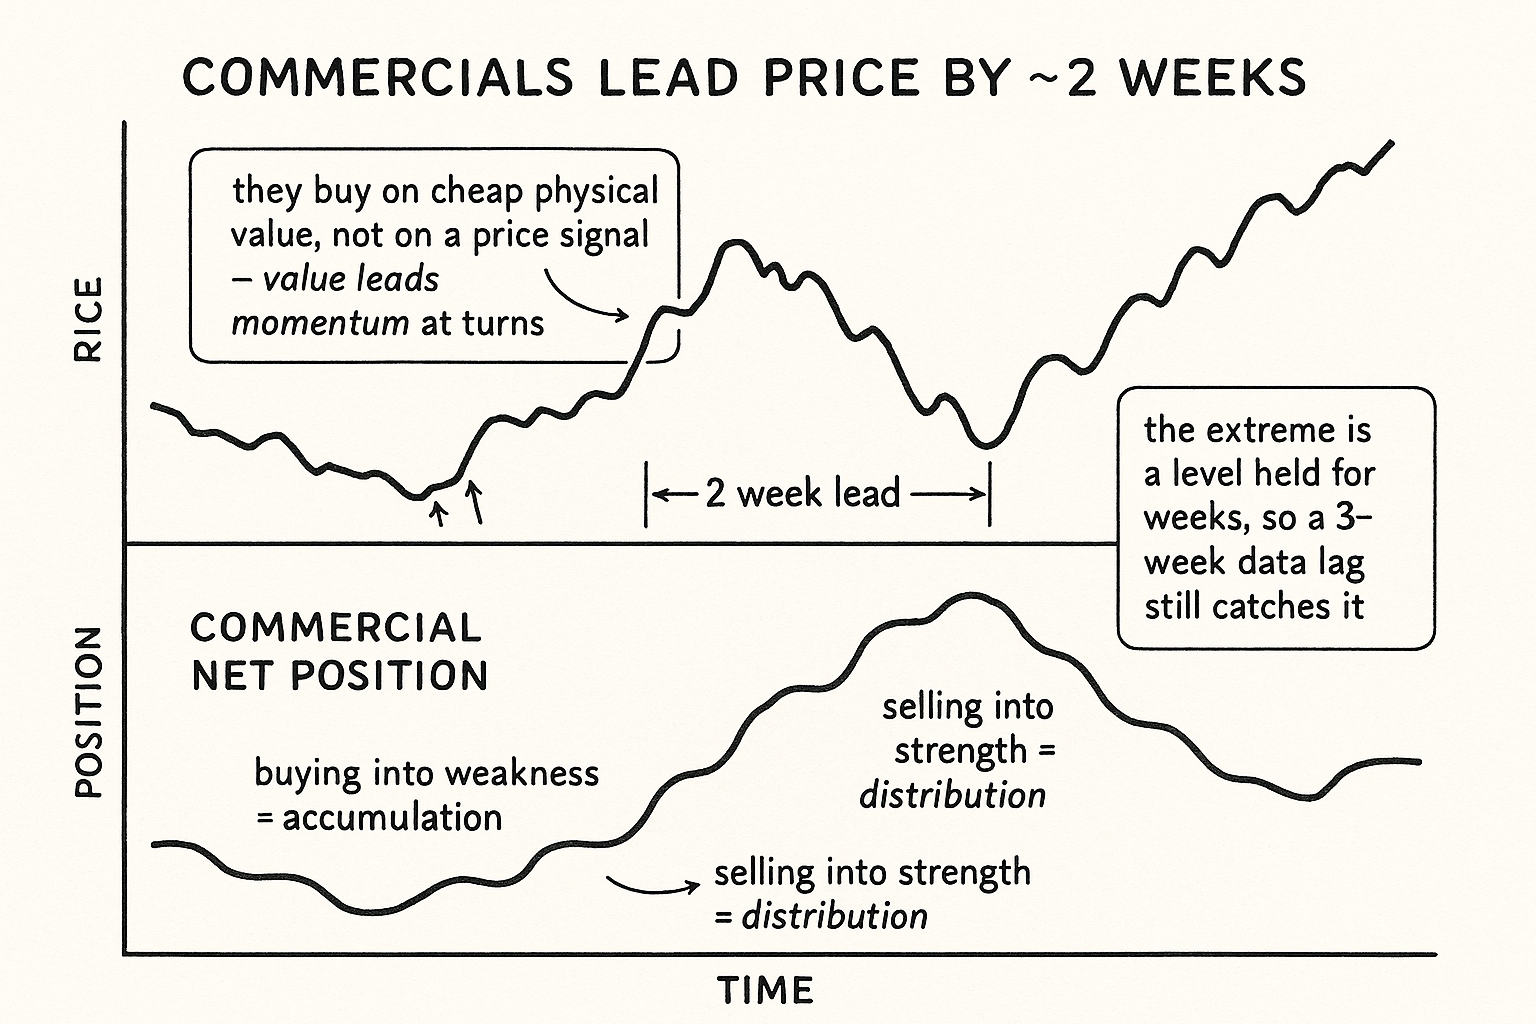
The accumulation process is why the positioning leads price. Commercials are buying near a bottom before the bottom is visible on the chart, because they buy on cheap physical value, not on a price signal. By the time the market turns up and the trend becomes obvious, the commercials are already loaded long; they did their buying during the decline. Their net position swings to an extreme before the price reverses, so reading their extreme is reading the setup for a turn that has not happened yet.
Empirically, that head start has run on the order of two weeks. Commercial positioning tends to reach its bullish extreme roughly two weeks before price bottoms, and its bearish extreme roughly two weeks before price tops. The exact figure drifts by market and era, so treat "two weeks" as the order of magnitude, not a stopwatch. The mechanism is what matters: they lead because they act on physical value while the market is still acting on price momentum, and value leads momentum at turns.
This is the rare leading indicator with a reason attached. Most claimed leads are curve-fits that decay the moment you trade them, the graveyard "Lead-Lag Relationships in Global Markets" catalogs. The commercial lead persists because the cause persists: producers and consumers will always hedge against the trend, and they will always do it slowly enough to leave a trail in the positioning data before the price catches up.
How the two-week lead survives a three-week lag
There is an obvious objection. COT data reaches you about three weeks old, and the lead is only about two weeks, so on paper the lag eats the lead and the signal is stale before you see it. If commercials lead price by two weeks and you learn their position three weeks after the fact, you are looking at a setup that already resolved.
The resolution is that the commercial extreme is a level, not a one-day event. Commercials sit at a bullish extreme for weeks while they finish accumulating, not for a single Tuesday. So even reading the data with a multi-week delay, you can still catch the market while the commercials remain at the extreme and before price has fully turned, because the extreme persists longer than the lag. The signal is the sustained positioning state, not the instantaneous reading, which is why COT works as a slow weekly gauge despite the delay and fails as a fast trigger. A multi-week setup tolerates a multi-week lag; a one-bar setup would not.
The trade this sets up is a contrarian one, taken with the commercials and against the crowd. When commercial net position reaches a bullish extreme relative to its own history, you lean long into the weakness the commercials are buying; when it reaches a bearish extreme, you lean short into the strength they are selling. Trading the raw net level is clumsy, though, because "extreme" only means something relative to this market's own range. Turning the commercial net into a normalized, bounded signal is the job of the next article, "Building a COT Index System."
Visualizing the commercial lead
KEY POINTS
- Commercial hedgers are mechanically counter-trend for a business reason: they sell futures into rising prices to lock in good selling levels and buy into falling prices to secure cheap supply. Their incentive points against the trend by construction.
- They move size through slow accumulation and distribution, scaling in over weeks while prices are low and out while prices are high, taking the other side of what trend-followers and retail chase.
- Commercial net position moves inverse to price: heavy net short near highs, heavy net long near lows. It is a contrarian gauge built by people who are not trying to be contrarian, which is why it is trustworthy.
- The positioning leads price because commercials act on physical value before the chart turns. They are already loaded long near a bottom, having bought during the decline.
- The lead has run on the order of two weeks, reaching a bullish extreme about two weeks before price bottoms and bearish about two weeks before tops. Treat two weeks as an order of magnitude that drifts by market.
- This is a leading indicator with a real cause, which is why it persists where curve-fit leads decay: producers and consumers will always hedge against the trend, leaving a trail before price catches up.
- The two-week lead survives the three-week data lag because the commercial extreme is a level held for weeks, not a one-day event. A multi-week setup tolerates a multi-week delay; trade it as a slow gauge, not a trigger.
References
- Trading Systems and Methods - Perry Kaufman (Amazon)
- Cybernetic Trading Strategies - Murray Ruggiero (Amazon)
- The Art of Currency Trading - Brent Donnelly (Amazon)
- The Role of Hedgers and Speculators in Liquidity Provision to Commodity Futures Markets
- Is Speculation Destabilizing?
- What do movements in financial traders’ net long positions reveal about aggregate stock returns?
- On the predictive role of large futures trades for S&P 500 index returns
- Trader positions and the price of oil in the futures market
- Tracking speculative trading
- The effectiveness of position limits: Evidence from the foreign exchange futures markets
- Why Do Hedgers Hedge? The Role of Ambiguity