6.41 Why Fat Tails Are the Reason Trend Following Works
Fat tails wreck Gaussian risk models and are also why trend following pays: the big moves the bell curve forbids cluster into trends and produce the rare giant winners that fund the small losses.
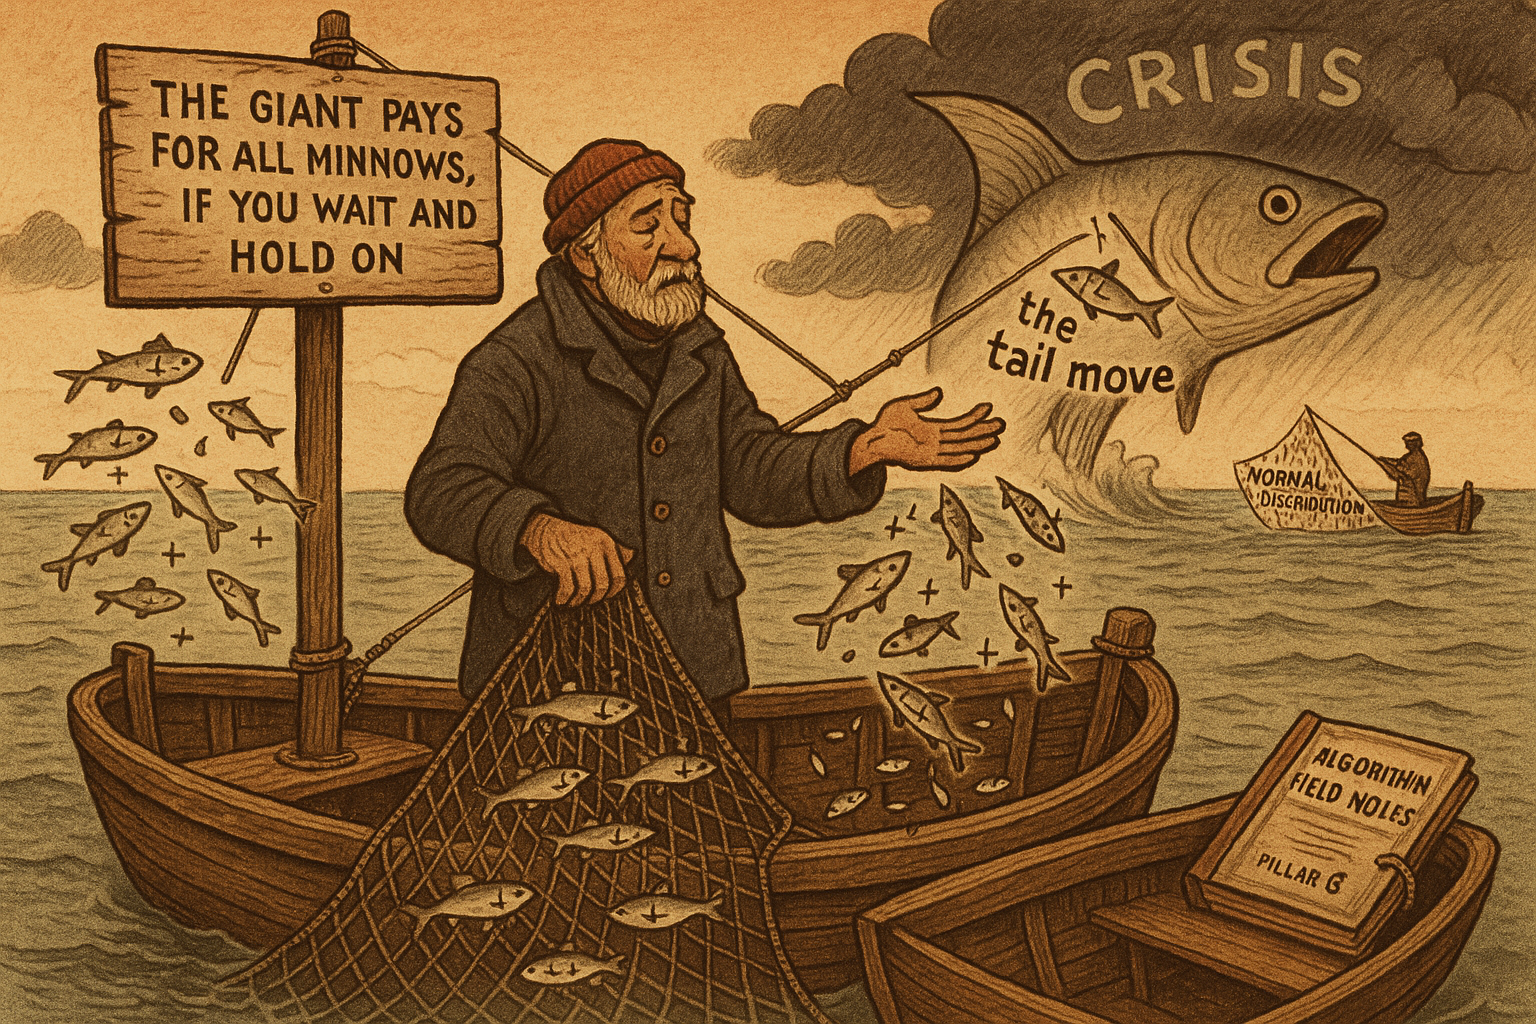
The old article "Fat Tails: Why Gaussian Thinking Breaks Trading Systems" told you the bad news: real returns have fat tails, the bell curve calls crashes impossible, and Gaussian risk models blow up in the one regime they exist to survive. Same fact, flip the sign, and it becomes the entire reason a whole industry makes money. Markets produce big moves far more often than a normal distribution allows, those big moves arrive in directional runs rather than as isolated spikes, and a strategy that climbs aboard a move and holds it until it dies is harvesting the part of the distribution the Gaussian swears does not exist. Fat tails do more than threaten the careless trader. They hand the trend follower an edge.
Leptokurtosis is where the trends live
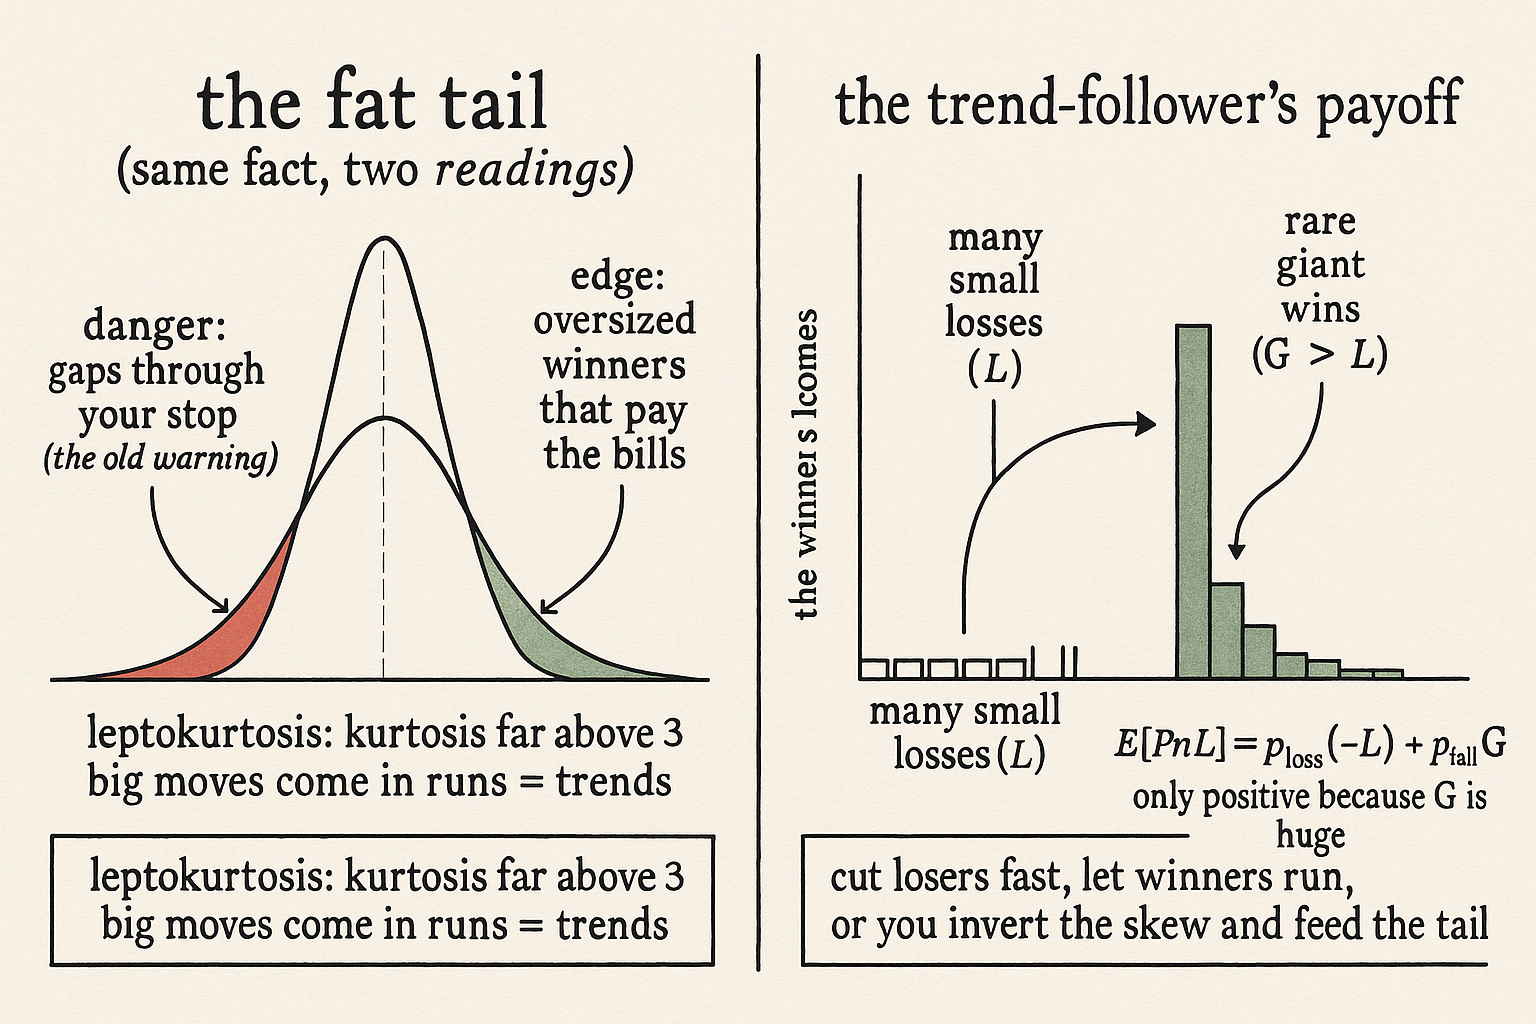
A return distribution is leptokurtotic when it has a sharper peak and fatter tails than the Gaussian: most days cluster tighter than the bell curve near zero, and the days that escape escape much further than the bell curve permits. The single number that flags it is kurtosis, the fourth moment scaled by variance.
$$ \text{kurtosis} = \frac{E\!\left[(r-\mu)^4\right]}{\sigma^4}, \qquad \text{Gaussian} = 3, \qquad \text{markets} \gg 3 $$
The fourth power means this statistic weights the biggest deviations from the mean far more than the rest, so it is a magnifying glass pointed straight at the extremes. A Gaussian sits at 3. Equity index returns, commodity returns, and currency returns run well above that, into the teens and higher on daily data. Excess kurtosis, the amount above 3, is the part the normal distribution cannot produce, and it is not a measurement error. It is the market telling you that large moves carry more of the total variation than a random walk would assign them.
Read that operationally and the trading consequence falls out. If price changes were independent Gaussian draws, the big moves would scatter at random and you could never lean on them, because tomorrow's draw would forget today's. Markets do not forget. The fat tail shows up alongside positive autocorrelation at the horizons trend followers care about, the same property the old article "Variance Ratio Tests for Traders" measured as a variance ratio above 1: moves reinforce, variance compounds faster than it would under independence, and the extreme observations group into sustained directional runs instead of one-day stabs. The fat tail is the footprint of trends. No fat tail, no trend, no edge.
The payoff that only fat tails can pay
Trend following has an ugly win rate. Most trades lose a little, the stops get hit, the breakouts fail, and the equity curve grinds sideways or down for long stretches. The strategy survives because of the shape of the payoff, not the frequency of the wins.
$$ E[\text{PnL}] = p_{\text{loss}} \cdot (-L) \; + \; p_{\text{tail}} \cdot G, \qquad p_{\text{tail}} \text{ small}, \quad G \gg L $$
Read it plainly. The expected profit is the probability of the many small losses times their size, which is negative, plus the probability of the rare large win times its size. The win probability is low and the loss term drags, so the only thing that pulls the whole expression positive is the second piece: the gain G being so much larger than the loss L that a handful of them outweighs the long tail of small bleeds. That large G has to come from somewhere. It comes from the fat tail. A Gaussian world caps the size of the winners at a few standard deviations, the asymmetry collapses, G stops dwarfing L, and the strategy's expectation goes to zero or below once costs bite. The positively skewed return stream that trend followers live on, many small losses funding occasional outsized gains, is a direct print of the leptokurtosis in the underlying. The convexity people praise as crisis alpha is the same thing seen from the portfolio level: the big tail moves tend to cluster in stressed regimes, the strategy is positioned to ride them, and the rare giant winner shows up when everything else is bleeding.
So the causal chain is short. Fat tails create large moves, large moves come in runs, runs are trends, trends produce the oversized winners, and the oversized winners are the only reason a low-win-rate strategy clears its costs. Strip the fat tail and you strip the edge.
The same tail that pays you can also gap through your stop
Do not mistake this for a free lunch, because the fat tail is double-edged and the old article on Gaussian failure spelled out the dangerous side. The leptokurtosis that delivers your giant winner is the same leptokurtosis that delivers a gap straight through your stop, and trend followers eat those too: an overnight reversal that the bell curve called impossible takes back weeks of a position before you can act. The asymmetry stays in your favor only if your exits cut the losers fast and let the winners run, which is what converts a symmetric fat tail into a positively skewed P&L. Get the exit logic wrong, hold the losers and clip the winners, and you invert the skew and feed the tail instead of harvesting it.
There is also the cost of waiting. The tail events are rare by definition, so most of the time the strategy is paying small losses while waiting for a move that may be months away, and that stretch of underperformance is where most people quit right before the acceleration that would have paid for everything. The fat tail is the source of the edge and the source of the pain in the same distribution. Respect it the way the old article said: size for the move you cannot model, because the tail that funds you does not announce which direction it will fire.
Visualizing the edge inside the tail
KEY POINTS
- Fat tails are the same fact the old article "Fat Tails: Why Gaussian Thinking Breaks Trading Systems" framed as a threat, read from the other side: the big moves the Gaussian forbids are what trend following harvests.
- Leptokurtosis (kurtosis far above the Gaussian value of 3) is a magnifying glass on the extremes. It says large moves carry more of the total variation than a random walk allows, and they arrive in directional runs, not isolated spikes.
- The runs are trends. The fat tail shows up alongside the positive autocorrelation the old article "Variance Ratio Tests for Traders" measured as a variance ratio above 1. No fat tail, no trend, no edge.
- Trend following has a low win rate and survives only on payoff shape: many small losses funded by rare oversized winners, where the winner G dwarfs the loss L. That oversized G can only come from the fat tail.
- A Gaussian world caps the winners at a few sigma, collapses the asymmetry, and kills the strategy's expectation once costs bite. The positive skew and the crisis-alpha convexity are direct prints of the underlying leptokurtosis.
- The tail is double-edged. The same fat tail that funds you can gap through your stop, the edge survives only if exits cut losers fast and let winners run, and the long waits between tail events are where most traders quit right before the move that pays for everything.
References
- Systematic Trading - Robert Carver (Amazon)
- Trading Systems - Urban Jaekle Emilio Tomasini (Amazon)
- The crisis alpha of managed futures: Myth or reality?
- Trend-following strategies for tail-risk hedging and alpha generation (Artur Sepp)
- Making Fat Right Tails Fatter with Trend Following (CFM)
- Same same but different: Stylized facts of CTA sub strategies
- Power Laws in Economics and Finance
- A Detailed Take on Fat Tails
- Higher-Order Moments in Modeling Asset Price Processes in Finance
- Treatment of Kurtosis in Financial Markets
- SCALING, CLUSTERING AND DYNAMICS OF VOLATILITY IN FINANCIAL MARKETS
- Equity Tail Risk Before and After the Financial Crisis
- Kurtosis of GARCH and stochastic volatility models with non-normal innovations
- Fat tails and volatility clustering in experimental asset markets
- Optimal Trend Following Rules in Two-State Regime-Switching Markets
- Trend Following in Strategic Asset Allocation: A Long-Horizon Perspective