6.32 Variance Ratio Tests for Traders
For a random walk, variance grows linearly with time. The variance ratio compares real growth to that benchmark: above 1 trends, below 1 mean-reverts. It measures the past, not the future.
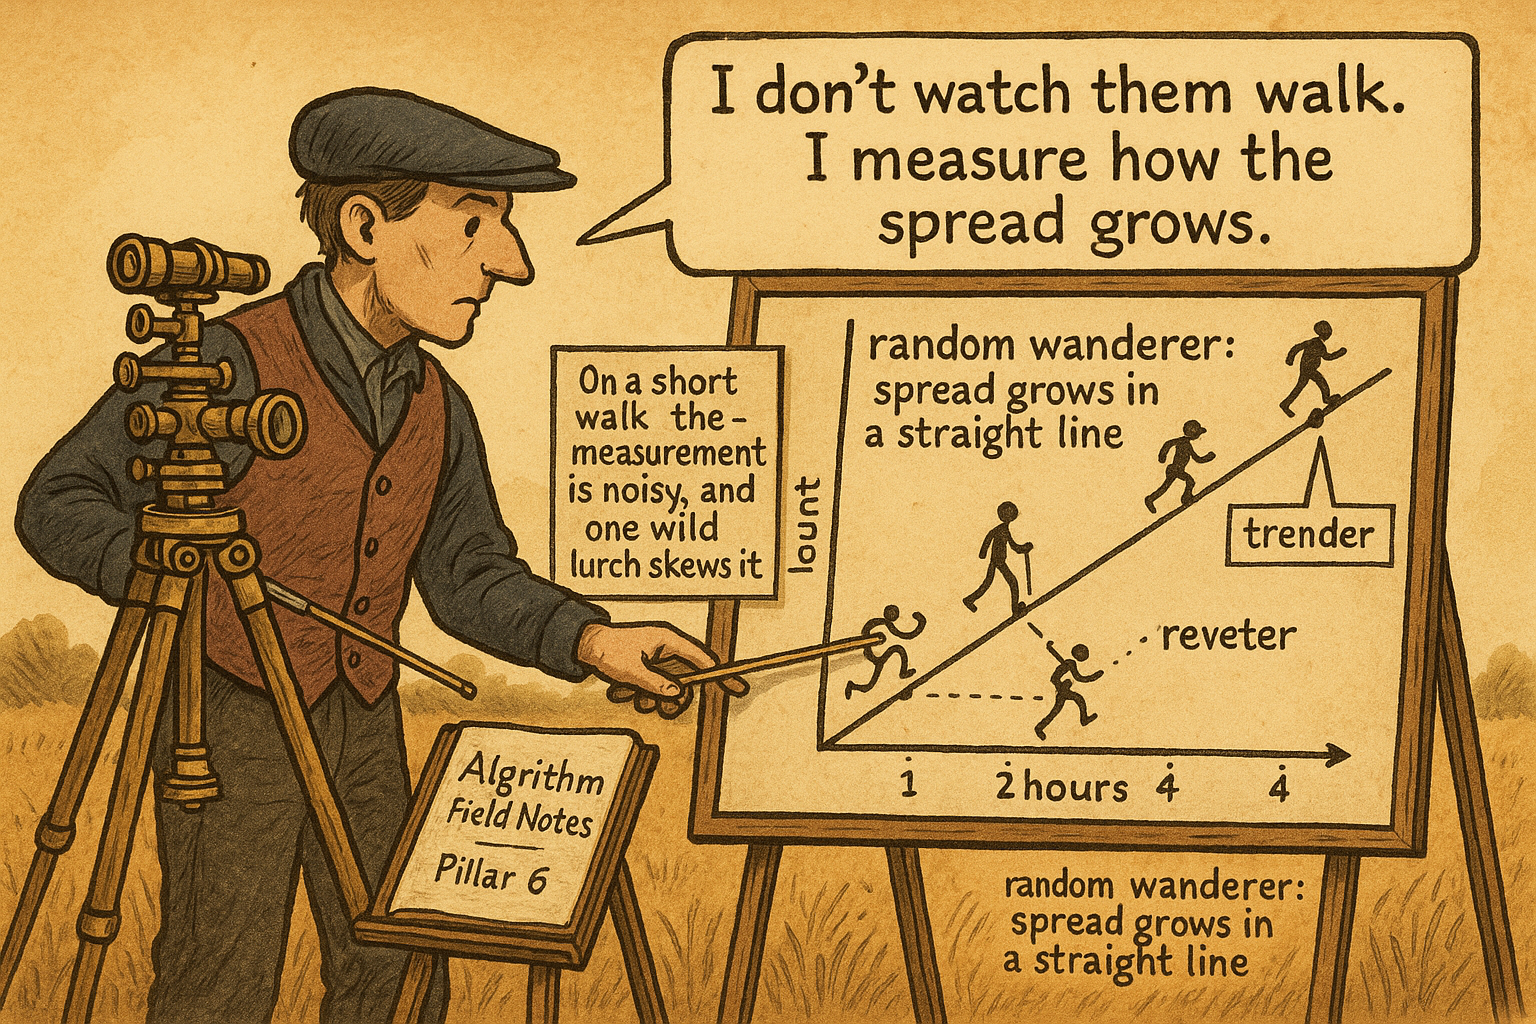
If you want to know whether a price series trends, mean-reverts, or wanders randomly, you do not need a fancy model. You need one number, the variance ratio, and it comes from a property so simple it is almost embarrassing: for a random walk, variance grows linearly with time. Measure how the variance actually grows in your series, compare it to the linear benchmark, and the comparison tells you whether the increments are trending, reverting, or independent. "Random Walk and Efficient Markets Are Not the Same Thing" said the random walk is the testable claim; the variance ratio is how you test it.
The linear-variance property
The whole test rests on one fact. If price changes are independent, the variance of a return measured over a long interval equals the variance over a short interval times the number of short intervals in it. Returns over a month should have four times the variance of returns over a week, because a month is roughly four weeks and the variances of independent increments add. This linear scaling of variance with the sampling interval is the signature of a random walk, and any departure from it is a departure from independence.
$$ \text{VR}(q) = \frac{\text{Var}(r_t^{(q)})}{q \cdot \text{Var}(r_t^{(1)})} $$
The variance ratio compares the actual scaling to the linear benchmark. The numerator is the variance of returns measured over q periods, and the denominator is what that variance should be if the series were a random walk, the single-period variance scaled up linearly by q. Divide the two. If the series is a true random walk, the ratio is 1: the long-horizon variance is exactly q times the short-horizon variance, and you have confirmed independence. The departures from 1 are the interesting part.
Reading the ratio
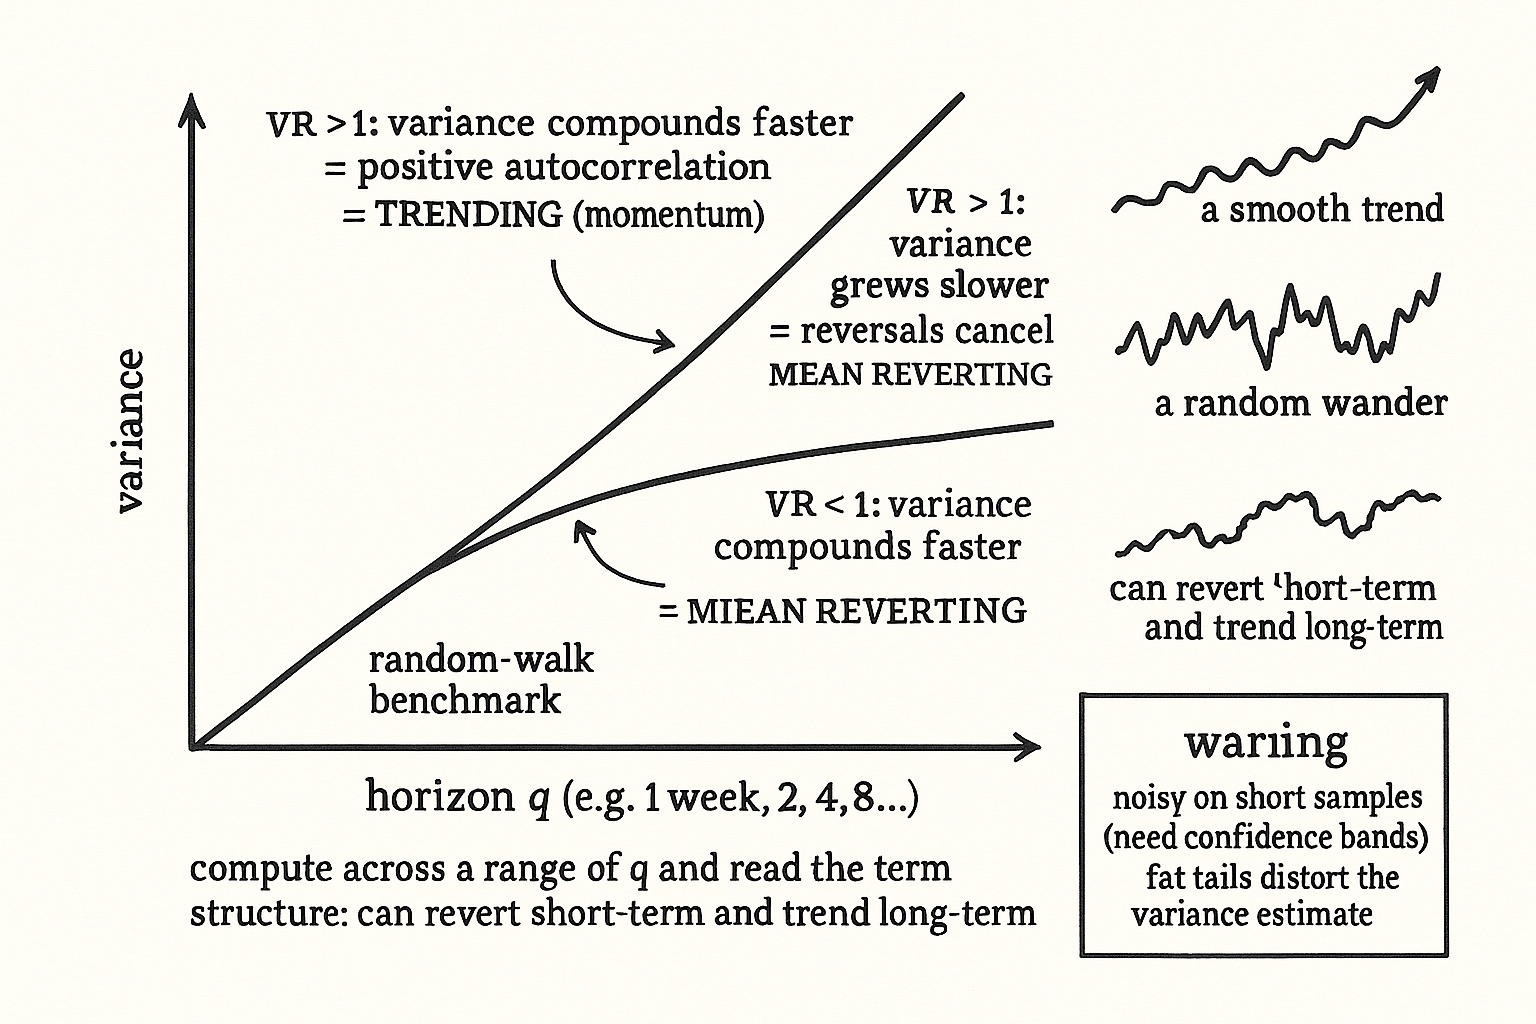
A variance ratio above 1 means the long-horizon variance is larger than the random-walk benchmark, which happens when the increments are positively autocorrelated, when a move in one direction tends to be followed by another move in the same direction. The variance compounds faster than linearly because the moves reinforce each other. That is trending, the statistical fingerprint of momentum, and a series with a variance ratio persistently above 1 is one where trend-following has raw material to work with.
A variance ratio below 1 means the long-horizon variance is smaller than the benchmark, which happens when increments are negatively autocorrelated, when a move in one direction tends to be partly reversed. The reversals cancel some of the variance, so it grows slower than linearly. That is mean reversion, the fingerprint of the kind of signal "How to Build a Cost-Aware RSI Ranking System" tries to harvest. A ratio near 1 says the series is close to a random walk at that horizon and neither trend nor reversion has much to grip. The horizon matters: a series can mean-revert at short horizons (ratio below 1 for small q) and trend at longer ones (ratio above 1 for large q), so you compute the ratio across a range of horizons and read the term structure, not a single number.
What the test does not tell you
The variance ratio is a measurement, not a strategy, and treating it as one is the trap. A ratio above 1 says the series trended over the sample you measured; it does not promise the trending will continue, because the autocorrelation that produced it can be non-stationary and vanish out of sample, the same fragility that haunts every signal in this pillar. The test also has real statistical limits: variance ratios are noisy on short samples, so a ratio of 1.1 might be indistinguishable from 1 once you account for the sampling error, and you need the confidence bands, not just the point estimate, before claiming you found structure. Fat tails, the subject of "Fat Tails: Why Gaussian Thinking Breaks Trading Systems", also distort the variance estimate, because variance is dominated by the extreme moves and a few outliers can swing the ratio. So use the variance ratio to decide whether a series is worth building a trend or reversion strategy on, compute it across horizons with proper error bands, and remember it describes the past sample, not a guarantee about the future. It points you at where structure lived; whether the structure survives costs and persists is the work that follows.
Visualizing the variance ratio
KEY POINTS
- The variance ratio tells you whether a series trends, mean-reverts, or wanders, from one property: for a random walk, variance grows linearly with time, so monthly variance should be about four times weekly variance.
- The variance ratio is the actual q-period variance divided by q times the one-period variance. For a true random walk it equals 1, confirming independence. The departures from 1 are the signal.
- Above 1 means positive autocorrelation: moves reinforce, variance compounds faster than linearly. That is trending, the fingerprint of momentum.
- Below 1 means negative autocorrelation: moves partly reverse, variance grows slower than linearly. That is mean reversion.
- Compute the ratio across a range of horizons and read the term structure, because a series can mean-revert at short horizons and trend at long ones.
- The variance ratio measures the past sample, not a guarantee. It is noisy on short samples so you need confidence bands, fat tails distort the variance estimate, and the autocorrelation can vanish out of sample.
References
- Systematic Trading - Robert Carver (Amazon)
- Trading Systems - Urban Jaekle Emilio Tomasini (Amazon)
- “The Size and Power of the Variance Ratio Test in Finite Samples”
- “The Variance Ratio Test: An Analysis of Size and Power Based on a Continuous-Time Asymptotic Framework”
- “Drawing Inferences from Statistics Based on Multi‑Year Asset Returns”
- “Tests and Properties of Variance Ratios in Microstructure Studies”
- “Testing for Changes in Intraday Volatility Patterns”
- “Spurious Predictability in Financial Machine Learning”
- “TrendFolios®: A Portfolio Construction Framework for Utilizing Momentum and Trend‑Following Signals Across Multiple Asset Classes”
- “Designing Robust Trend‑Following System”
- Stock market prices do not follow random walks
- Stock Market Prices Do Not Follow Random Walks: Evidence from a Simple Specification Test
- The size and power of the variance ratio test in finite samples
- The Size and Power of the Variance Ratio Test in Finite Samples: a Monte Carlo Investigation
- A variance ratio test of random walks in exchange rates
- Are Asian stock markets efficient? Evidence from new multiple variance ratio tests
- Predictability of short-horizon returns in international equity markets
A note on AI. The ideas, research, analysis, and conclusions in this article are my own. I use AI tools to help with editing and wordsmithing, because English is not my first language, and I am not shy about that. AI-generated ideas and AI-assisted writing are not the same thing: the first is empty slop from a generic prompt, the second is a tool for communicating years of real research more clearly. Judge the work by its substance, not by whether software helped polish the prose.