4.41 Predicting Interest Rates from Inflation: The Real-Rate Ratio
Lenders demand a real return, so short rates track inflation. The Real-Rate Ratio turns that into one number, and a negative reading is the loaded spring that preceded the 1993 bond bear.
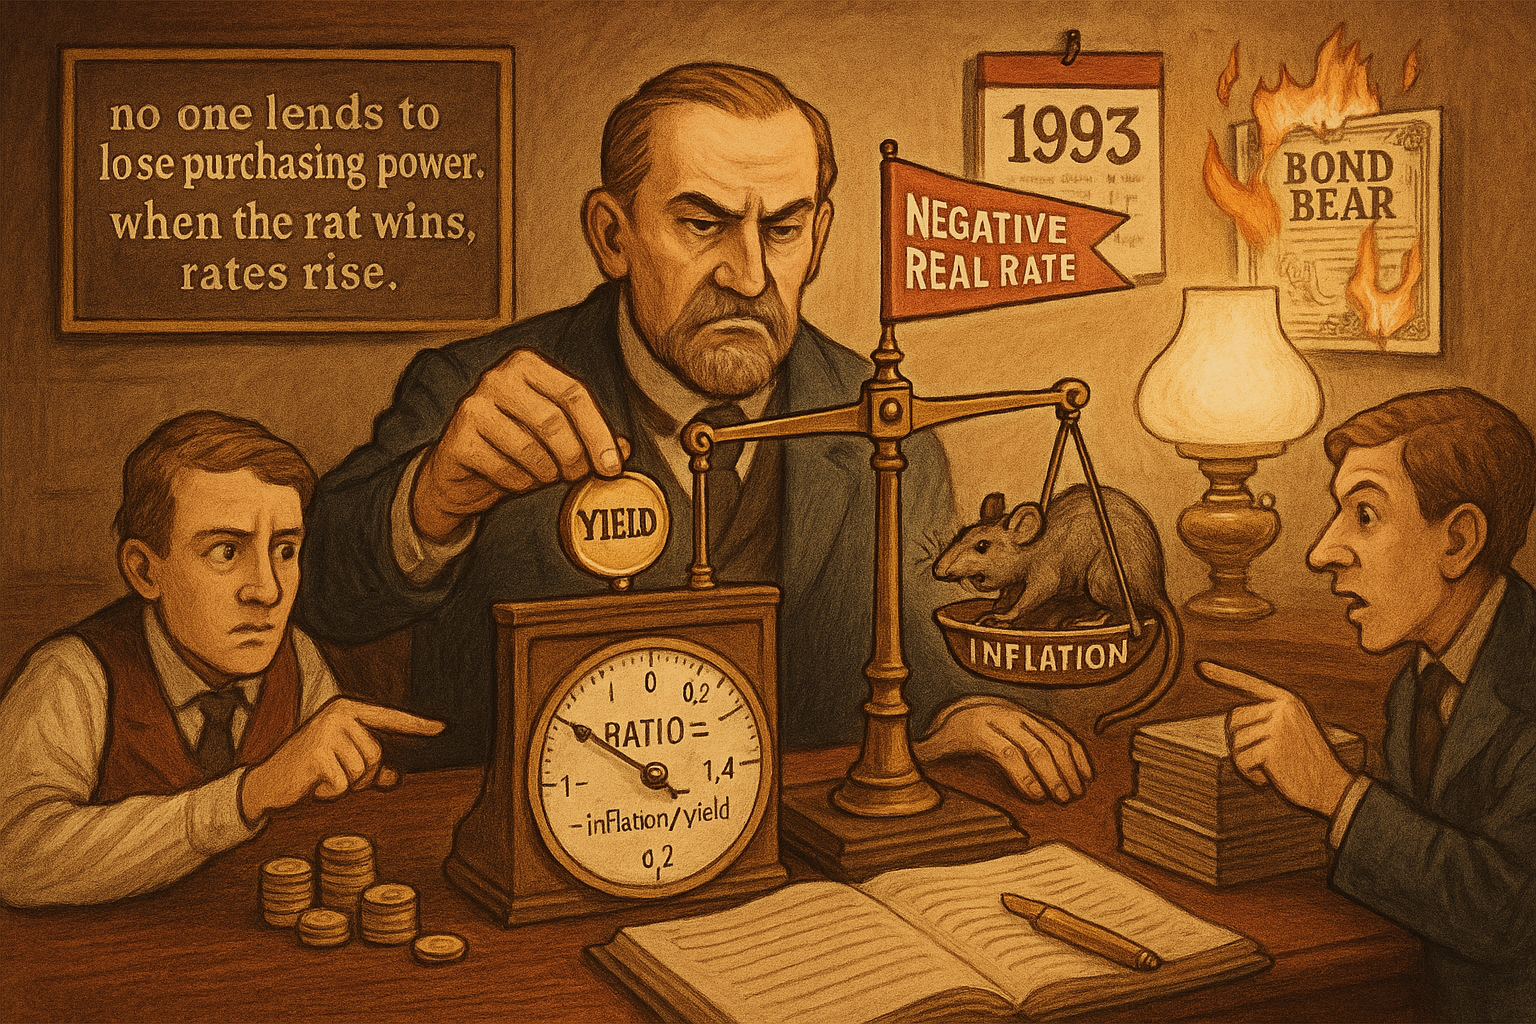
Lenders are not charities. Hand someone money for 90 days and you want back more purchasing power than you gave up, which means the rate you charge has to clear inflation with room to spare. That single piece of self-interest is why short-term interest rates track inflation, and it is the most reliable fundamental link in macro markets. Over roughly five decades, T-bill yields ran about twice the inflation rate. Lenders demanded a real return, and that real return showed up as yields sitting at a multiple of inflation rather than a hair above it.
The link is real but not constant, and the interesting trading information lives in the moments it stretches too far. When yields fall too close to inflation, or below it, the lender is being paid nothing or less than nothing in real terms, and that situation does not last. Rates snap back up. The "Gold, Dollar, and Rates: A Practical Intermarket Map" article laid out the web connecting inflation, rates, gold, and the dollar; this one turns the inflation-to-rate spoke of that web into a single number you can compute and threshold.
The negative-real-rate warning
Strip out the precise multiple and look at the danger zone. A negative real rate means inflation is running hotter than the T-bill yield. You lend at 3%, inflation is 4%, you lose 1% of purchasing power for the privilege of lending. That is unstable. The market corrects it by pushing yields up, and the correction tends to be violent because it has been suppressed.
The cleanest historical example is 1993. The real rate went negative, inflation outran the T-bill yield, and it happened right before a severe bear market in bonds. Bond prices move inverse to yields, so "rates about to rise" and "bond bear market" are the same sentence. The negative real rate was the tell, and it fired before the damage. This matters because the gold standard mattered: once the US dropped gold convertibility, inflation became a better measure of interest rates, since there was no longer a metal anchor competing with inflation expectations to set the price of money.
So the first, crude signal is just the sign of the real rate. Inflation above yield is a loaded spring. It does not tell you the day rates rise, but it tells you the configuration that precedes rate rises, and that is a backdrop worth respecting before you go long bonds.
Turning it into a ratio
The sign of the real rate is binary and throws away information. A ratio keeps the magnitude. Build the relationship between inflation and yield as a single bounded number that reads near zero when the lender is getting squeezed and near one when the lender is fat.
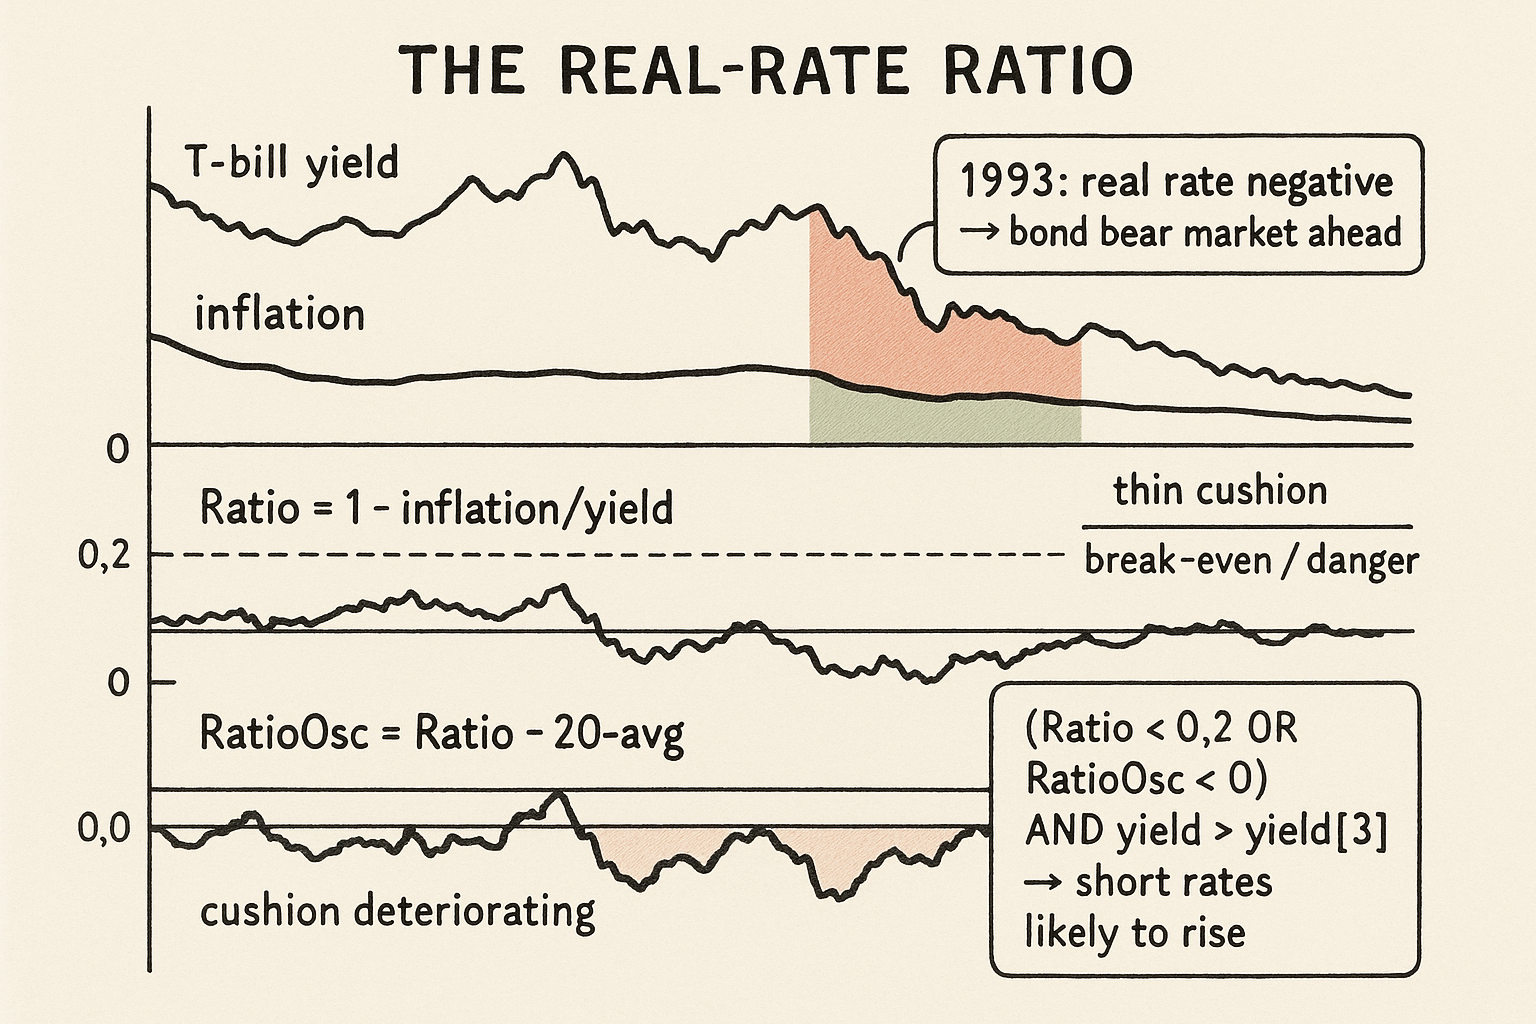
$$ \text{Ratio} \;=\; 1 - \frac{\text{inflation}}{\text{yield}} $$
Read it slowly. The fraction inflation over yield is how much of your nominal yield gets eaten by inflation. If inflation is 2% and yield is 4%, inflation eats half your yield, the fraction is 0.5, and the Ratio is 0.5. If inflation equals yield, the fraction is 1 and the Ratio is 0, the break-even point where the real rate is exactly zero. If inflation exceeds yield, the fraction goes above 1 and the Ratio goes negative, the negative-real-rate danger zone. A high Ratio means the lender keeps most of the yield in real terms; a low or negative Ratio means inflation is winning and rates are under pressure to rise. One number now carries both the sign and the severity.
The Ratio drifts slowly with the rate regime, so an absolute reading is more useful than a level you have to eyeball. The fix is to measure it against its own recent average, the stationarizing move from "How to Build Stationary Indicators from Non-Stationary Prices."
$$ \text{RatioOsc} \;=\; \text{Ratio} - \text{Avg}(\text{Ratio},\, 20) $$
Subtract the 20-period average of the Ratio from the current Ratio. Now you have an oscillator centered on zero: positive when the lender's real cushion is better than its recent norm, negative when it is deteriorating. The oscillator catches the change in the inflation-yield balance even when the absolute Ratio is still in a comfortable-looking range, because a falling real cushion is the early part of the move that ends in higher rates.
The combined rule
Put the level and the change together with a confirmation, and you get a concrete signal for short rates rising.
$$ \big(\text{Ratio} < 0.2 \;\;\text{OR}\;\; \text{RatioOsc} < 0\big) \;\;\text{AND}\;\; \big(\text{yield} > \text{yield}[3]\big) \;\Longrightarrow\; \text{90-day rate likely to rise} $$
Three conditions. Ratio below 0.2 means the lender's real cushion is thin, inflation is eating most of the yield, the loaded-spring state. Or RatioOsc below zero means the cushion is deteriorating relative to its recent norm even if the level is not yet extreme. Either of those raises the flag. Then the AND clause demands confirmation: the current yield is above the yield three periods ago, so rates are already turning up, not just theoretically under pressure. The fundamental condition says "rates should rise," and the yield-versus-yield-three-bars-back check says "and they have started to." Requiring both keeps you from fighting a market that has not yet agreed with your macro thesis.
The 0.2 threshold and the 20-period lookback and the 3-bar confirmation are arbitrary, and you should treat them as such. They are starting points, not laws, and they have to survive the same threshold testing as any other parameter, the discipline from "How to Test Indicator Thresholds Without Fooling Yourself." Pick them on one stretch of history and trade them blind on the next and you will learn what overfitting a macro rule costs.
What this is and is not
This is a fundamental filter for the direction of short rates, not a precision timing tool. It tells you the configuration that precedes rising rates and a falling bond market, with one confirmation that the move has begun. It does not tell you the magnitude or the exact week. The negative-real-rate setup in 1993 preceded a bond bear market, but "preceded" did some heavy lifting; the spring can stay loaded longer than your position can stay solvent.
The honest framing is the one from "The Difference Between Explanation and Prediction in Markets." The inflation-to-rates mechanism is a clean explanation, lenders demand a real return, and a clean explanation earns the rule a place in your toolkit. It does not promise the rule predicts on a schedule. Use the Real-Rate Ratio as a slow backdrop filter on bond and short-rate positions, stack it with the intermarket map it came from, and the next article in this arc, "Money Supply, Confidence, and Unemployment Duration as Rate Predictors", adds the non-inflation drivers that move rates when the inflation signal is quiet.
Visualizing the Real-Rate Ratio
KEY POINTS
- Short-term rates track inflation because lenders demand a real return. Over roughly five decades, T-bill yields ran about twice the inflation rate, sitting at a multiple of inflation rather than just above it.
- The link is real but not constant. The tradable information is in the stretch: when yields fall too close to or below inflation, the real rate is negative and rates tend to snap back up.
- A negative real rate (inflation above yield) is a loaded spring. The 1993 example went negative right before a severe bond bear market, because rising yields mean falling bond prices.
- Dropping the gold standard made inflation a better measure of rates, since no metal anchor competes to price money.
- The Real-Rate Ratio, 1 minus inflation-over-yield, is one bounded number: near 1 when the lender keeps most of the yield in real terms, 0 at break-even, negative in the danger zone. RatioOsc subtracts its 20-period average to make it a zero-centered oscillator.
- The combined rule: Ratio below 0.2 or RatioOsc below zero (fundamental pressure), AND yield above yield three bars back (confirmation the move started), flags short rates likely to rise.
- The thresholds (0.2, 20, 3) are arbitrary and must survive out-of-sample threshold testing. This is a slow directional backdrop filter for bonds and short rates, not a precision timing tool.
References
- Trading Systems and Methods - Perry Kaufman (Amazon)
- Cybernetic Trading Strategies - Murray Ruggiero (Amazon)
- The Art of Currency Trading - Brent Donnelly (Amazon)
- The relationship between nominal interest rates and inflation
- A reexamination of the relationship between inflation and interest rates
- INFLATION AND REAL RETURNS ON TREASURY BILLS
- Stocks, Bonds, Bills, and Inflation: Historical Returns (1926–1987)
- Historical Analysis of Monetary Policy Rules
- The real interest rate: An empirical investigation
- Natural and Neutral Real Interest Rates: Past and Future
- Global trends in interest rates