4.30 Why Bid/Ask Bounce Matters for Intraday FX Systems
Bid/ask bounce makes intraday price zig-zag across the spread with no information, faking a mean-reversion edge that is just the spread you pay to trade it. Use mid-price and pay the spread in tests.
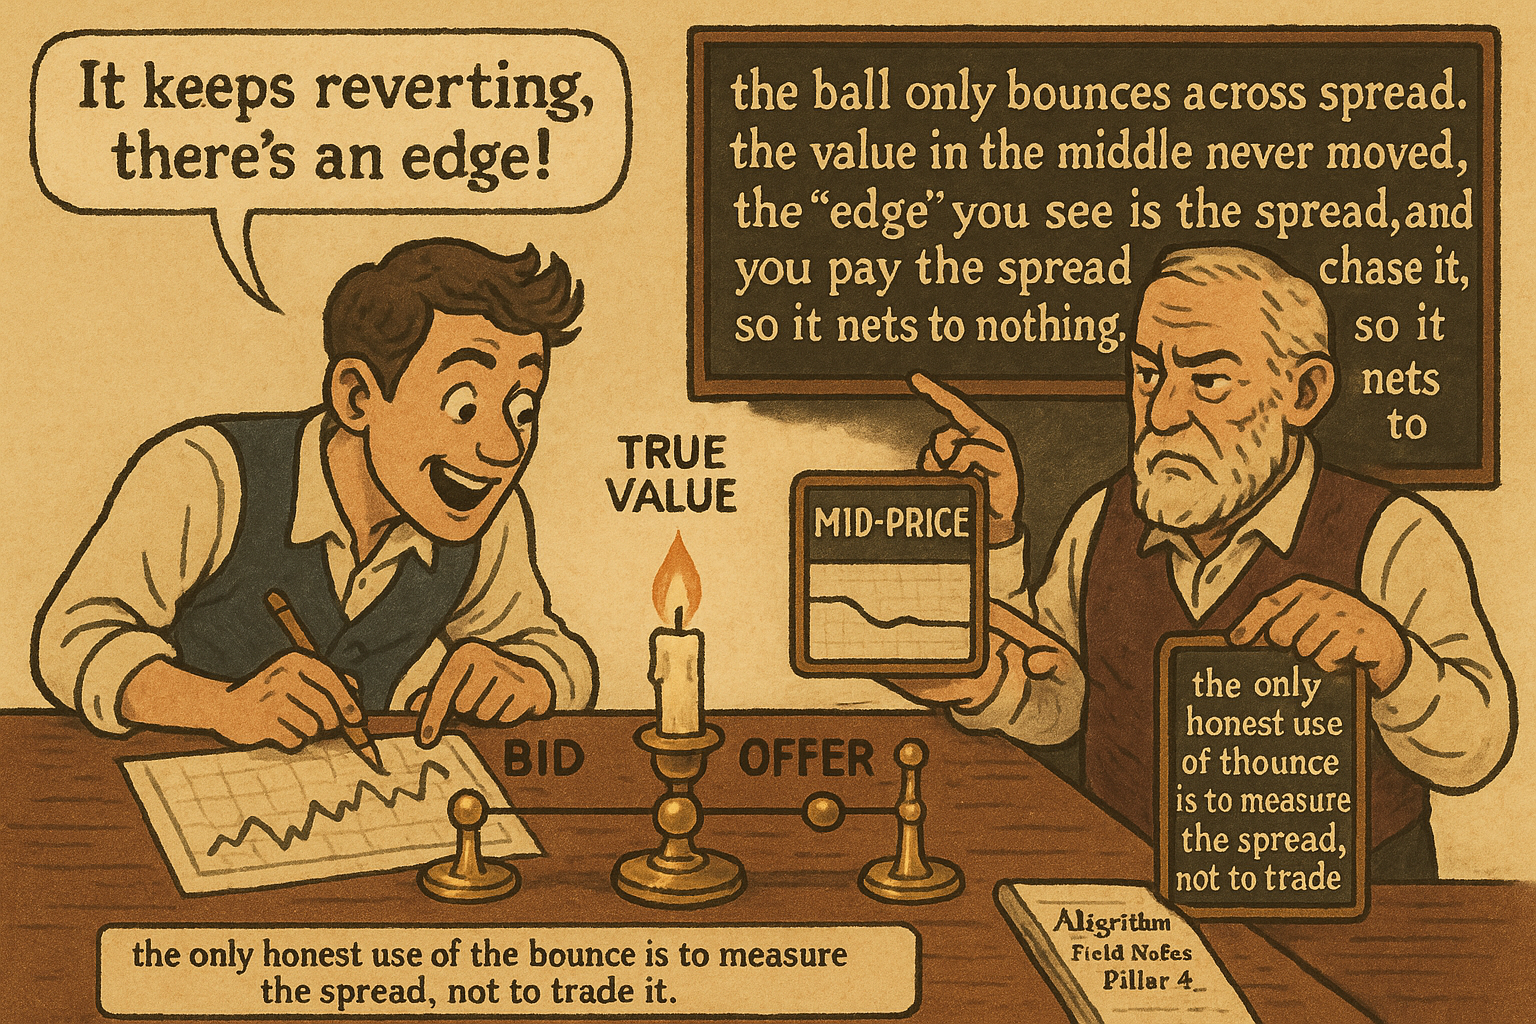
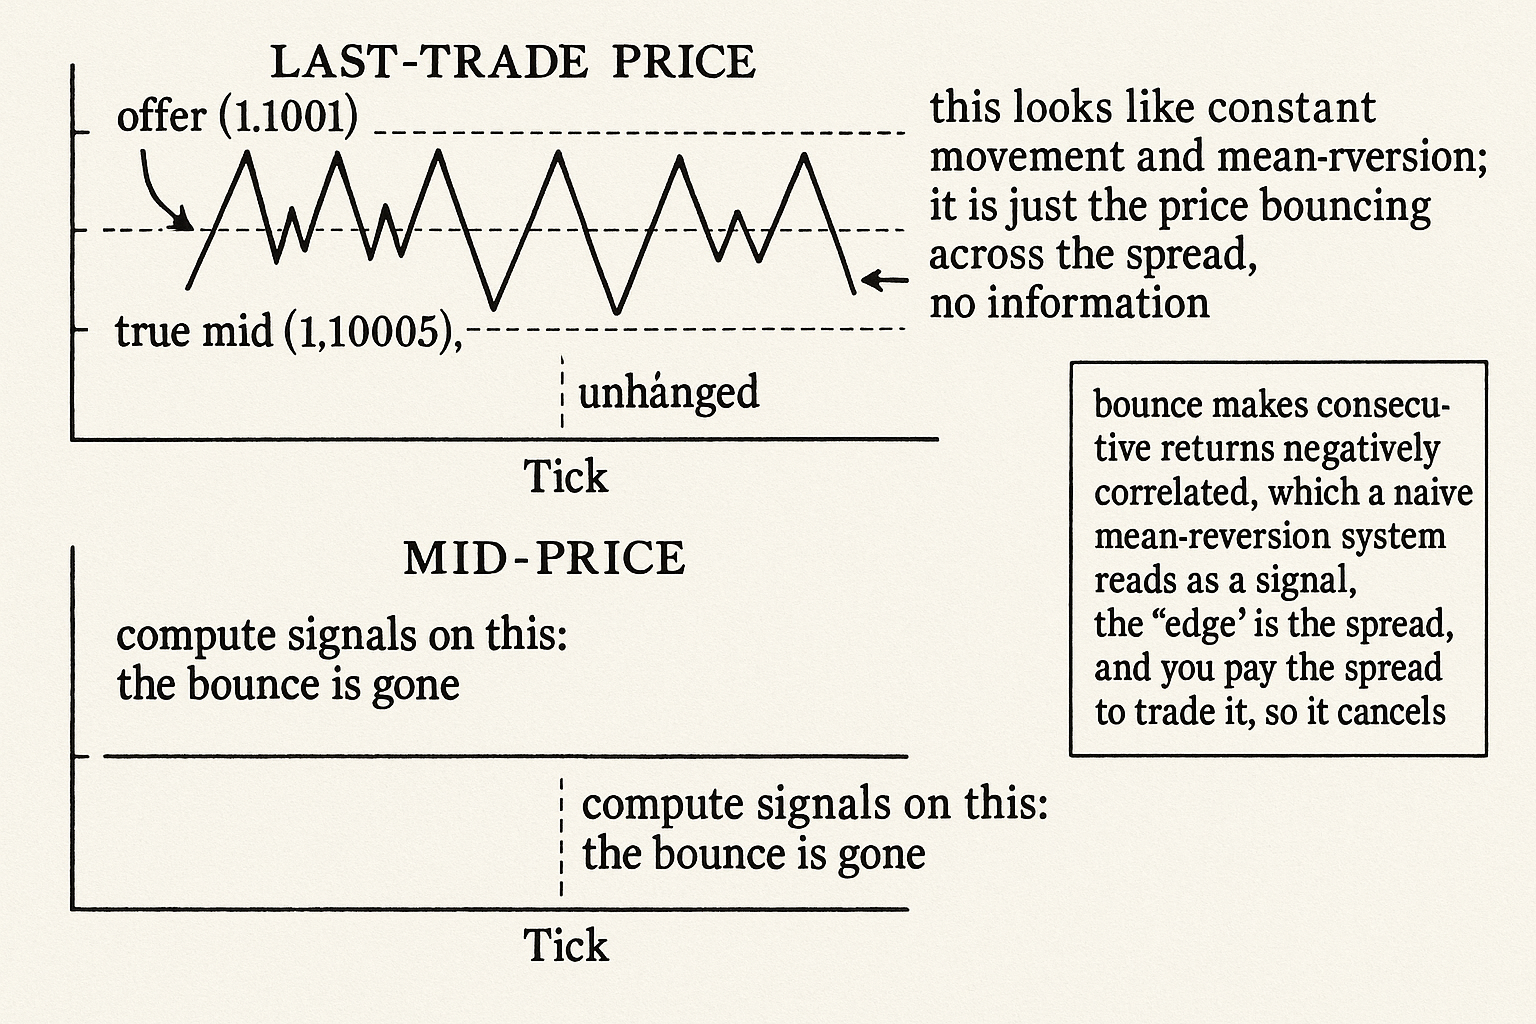
Record the last traded price of EURUSD tick by tick on a quiet afternoon and it looks like the market is constantly moving: up a tick, down a tick, up two, down one, a restless little zig-zag. Almost none of that is information. It is the price bouncing between the bid and the offer as buyers and sellers alternate, with the true value sitting still in the middle the whole time. A trade prints at the offer, the next at the bid, and the recorded "price" jumps by the spread without the fair value changing at all. This is bid/ask bounce, and on intraday FX data it manufactures a huge fraction of the apparent movement, which means it manufactures a huge fraction of the apparent signals.
For a system trading at short horizons, bounce is poison disguised as opportunity. It inflates measured volatility, it creates phantom mean-reversion (the price "reverts" simply because it bounced back across the spread), and it generates indicator crossings that are pure microstructure artifact. A strategy backtested on bounce-laden last-trade prices can show a beautiful short-term reversion edge that consists entirely of trying to capture the spread, and then it pays the spread to trade and dies. Understanding bounce is what separates a real intraday edge from an accounting illusion.
This article isolates bid/ask bounce as a microstructure noise source, following the order mechanics in "Market Orders vs Limit Orders in FX" and the liquidity structure in "The Real Heart of FX Liquidity". It is the intraday-noise complement to the longer-horizon noise treated in "Noise Is Not Volatility".
What bounce is
Bid/ask bounce is the oscillation of the recorded transaction price between the bid and the offer when the underlying value is unchanged. With a bid at 1.1000 and an offer at 1.1001, trades print at one or the other depending on whether a buyer or a seller arrives. A run of alternating buys and sellers prints 1.1001, 1.1000, 1.1001, 1.1000, a one-pip "move" every tick, while the mid-price (1.10005) and the fair value never budge.
The recorded return series therefore contains a spurious component that has nothing to do with information. Decompose the observed price into the true value plus a bounce term, and the observed return is the true return plus the change in the bounce term.
$$ P^{\text{obs}}_t = P^{\text{true}}_t \pm \tfrac{1}{2}s, \qquad r^{\text{obs}}_t = r^{\text{true}}_t + \big(\text{bounce}_t - \text{bounce}_{t-1}\big) $$
The observed price equals the true price plus or minus half the spread depending on whether the trade hit the bid or the offer; the observed return equals the true return plus the change in the bounce component between consecutive ticks. Because the bounce term flips sign as trades alternate between bid and offer, its change is large and negatively autocorrelated: an up-bounce is likely followed by a down-bounce. That negative autocorrelation is the fingerprint of bounce, and it is exactly what a naive mean-reversion indicator reads as a tradeable signal.
Why it fakes a mean-reversion edge
The damage is specific and predictable. Bounce makes consecutive observed returns negatively correlated even when the true returns are pure noise, because a print at the offer (an up-tick) tends to be followed by a print at the bid (a down-tick). A short-term mean-reversion system looks for exactly this pattern: price up, so sell; price down, so buy. On bounce-laden data it finds the pattern everywhere and backtests beautifully.
The catch is that the "reversion" is the spread, and you cannot capture it. To trade the bounce-driven reversion you would have to buy at the bid and sell at the offer faster than the spread, which means you are trying to earn the spread, not a price move, and as a price-taker paying the spread you lose it instead. The apparent edge is the spread measured as a signal, and the cost of trading is the spread paid as a fee; they cancel, and a strategy that ignored bounce books the phantom profit in the backtest and the real spread loss live. This is the intraday version of the warning in "Why Transaction Costs Should Be Added Before You Fall in Love": the edge and the cost are the same quantity, and only one of them shows up in a careless backtest.
The negative autocorrelation that bounce induces is even usable in reverse, as a spread estimator: the size of the negative autocovariance in observed returns is proportional to the spread, so you can back out the effective spread from the price series itself. That is the honest use of bounce, as a measurement of cost, not as a source of signal.
Defending a system against bounce
Concrete habits that keep bounce out of your signals.
Compute signals on mid-price, not last-trade. The mid (average of bid and offer) removes most of the bounce by construction, because it does not jump when a trade alternates between bid and offer. Any intraday indicator fed last-trade prices is reading bounce; the same indicator on mid-price is reading something closer to the true value. This single change kills most phantom signals.
Sample slower than the bounce. Bounce lives at the tick scale; the true signal you are after usually lives at a slower scale. Sampling at a coarser interval (bars rather than ticks) averages out the bounce while preserving the real move, the timeframe-matching logic from "How to Choose the Right Timeframe for a Strategy". A system that must trade at the tick scale is trading mostly bounce.
Require the signal to exceed the spread. A move smaller than the spread is indistinguishable from bounce, so any signal whose magnitude is on the order of the spread should be ignored. Setting a threshold of a multiple of the spread before acting filters the bounce-scale noise and keeps only moves large enough to be information, the price-density and noise logic applied at the micro scale.
Backtest with the spread paid on every fill. The decisive test: if the intraday edge survives paying the realized spread on each round trip, it is real; if it evaporates, it was bounce. An edge that only exists on mid-to-mid fills with no spread paid is an edge you cannot trade, the tier-cost honesty from "Why Retail FX Execution Is Not the Same as Interbank FX".
Visualizing the bounce
KEY POINTS
- Bid/ask bounce is the recorded transaction price oscillating between the bid and the offer while the true value sits unchanged in the middle. A run of alternating buyers and sellers prints a spread-sized "move" every tick with no information behind it.
- On intraday FX data bounce manufactures a large fraction of apparent movement, inflating measured volatility and generating indicator crossings that are pure microstructure artifact.
- The observed return equals the true return plus the change in a bounce term that flips sign as trades alternate between bid and offer. That flip makes consecutive observed returns negatively autocorrelated, the fingerprint of bounce.
- Bounce fakes a mean-reversion edge: a short-term system reads the negative autocorrelation as "price up, sell; price down, buy" and backtests beautifully.
- The fake edge is the spread itself. Capturing it means earning the spread, but a price-taker pays the spread, so the apparent profit and the real cost cancel. A careless backtest books the phantom profit and the live account pays the spread loss.
- The honest use of bounce is as a spread estimator: the negative autocovariance of observed returns is proportional to the effective spread, so you can back out the cost from the price series.
- Defenses: compute signals on mid-price not last-trade, sample slower than the tick-scale bounce, require the signal to exceed a multiple of the spread before acting, and backtest with the realized spread paid on every fill.
- The decisive test: an intraday edge that survives paying the spread on each round trip is real; one that evaporates was bounce. An edge that only exists on mid-to-mid fills with no spread paid is untradeable.
References
- Trading Systems and Methods - Perry Kaufman (Amazon)
- Cybernetic Trading Strategies - Murray Ruggiero (Amazon)
- The Art of Currency Trading - Brent Donnelly (Amazon)
- FX Trading and Exchange Rate Dynamics
- Lead-Lag Relationships in Market Microstructure⋆
- FX Trading and Exchange Rate Dynamics - jstor
- BURSTING THE BUBBLE
- Trading and Market Microstructure - arXiv
- High-Frequency Trading, Asset Pricing, and Market Microstructure
- Spurious Predictability in Financial Machine Learning - arXiv
- Quantitative Finance - arXiv
- On the Correlation Structure of Microstructure Noise: A Financial Economic Approach
- Intraday FX Volatility-Curve Forecasting with Functional GARCH Models
- Forecasting Intraday Foreign Exchange Volatility with Functional GARCH Models
- Inference on the Intraday Spot Volatility from High-Frequency Order Prices with One-Sided Microstructure Noise
- Microstructure Effects, Bid–Ask Spreads and Volatility in the Spot Foreign Exchange Market Pre and Post-EMU
- Bid-Ask Spreads in the Interbank Foreign Exchange Markets
- Bid-Ask Spread Dynamics in Foreign Exchange Markets
- Order flow, bid–ask spread and trading density in foreign exchange
A note on AI. The ideas, research, analysis, and conclusions in this article are my own. I use AI tools to help with editing and wordsmithing, because English is not my first language, and I am not shy about that. AI-generated ideas and AI-assisted writing are not the same thing: the first is empty slop from a generic prompt, the second is a tool for communicating years of real research more clearly. Judge the work by its substance, not by whether software helped polish the prose.