4.68 Trading Crosses with Relative Equity-Index Ratios
A cross has no dollar to lean on, so trade it off the relative performance of the two countries' stock indices. Divide them in logs, signal off the ratio, and confirm the equities actually lead the cross.
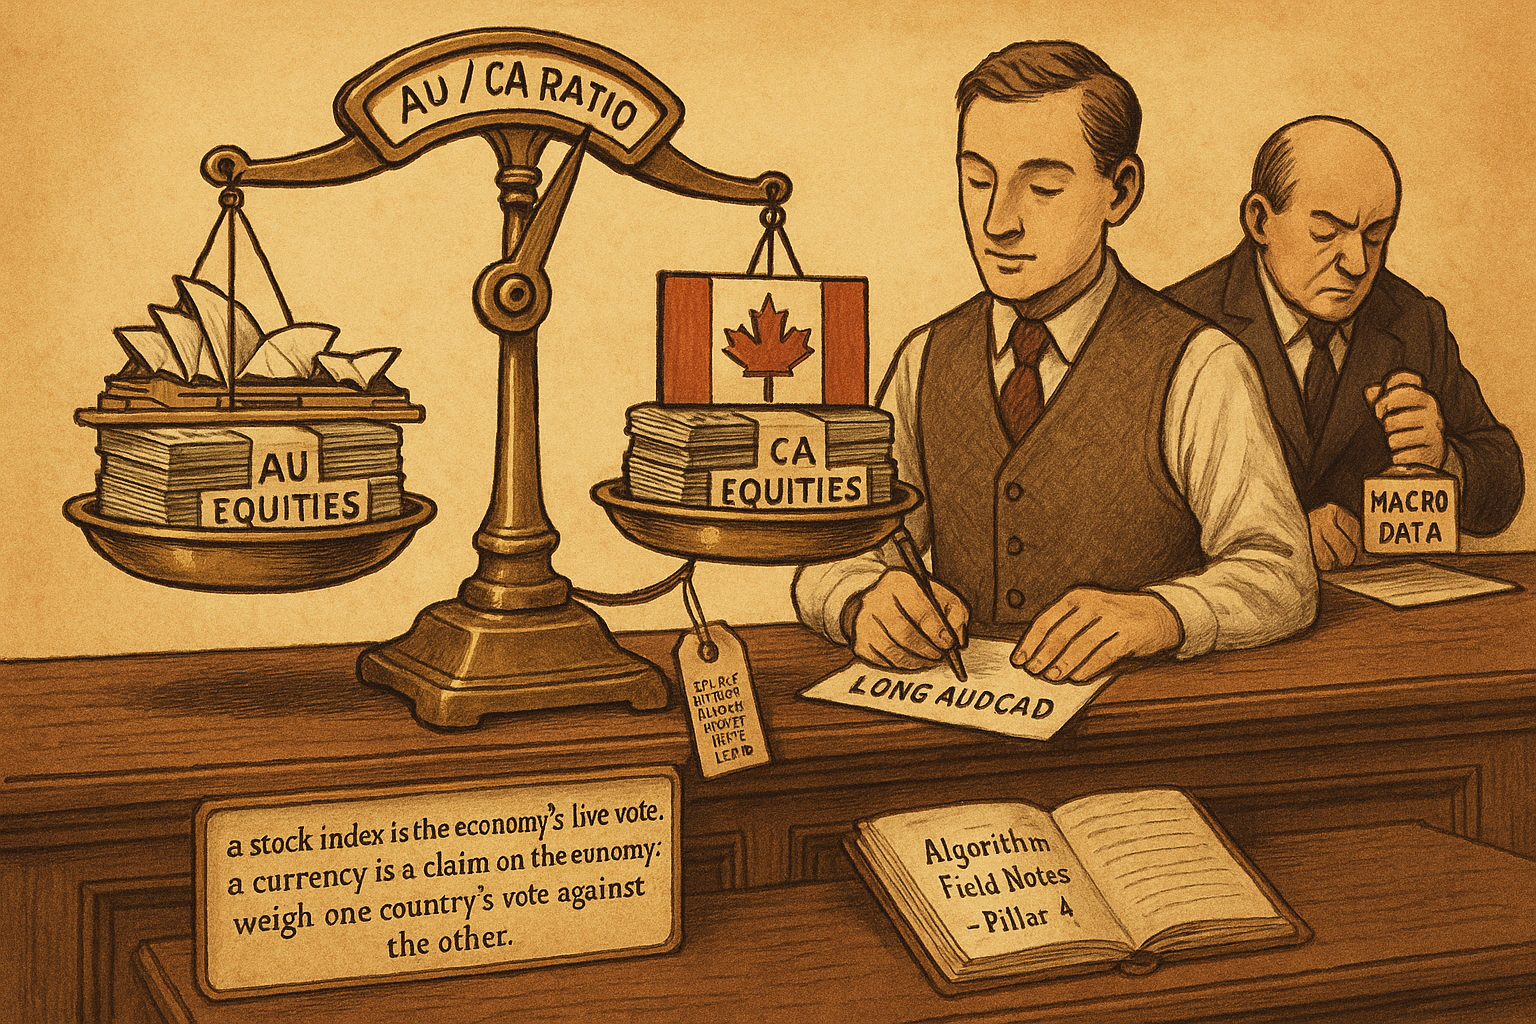
A cross like AUDCAD has no dollar in it, which is the point and the problem. Cancel the dollar out of two USD pairs and you are left with the pure relative story, Australia against Canada, with no common factor to lean on. So what drives it? The textbook reaches for the rate differential and the commodity split (the Aussie's metals against the loonie's crude), and those matter. The faster, more tradable read is sitting on a screen most FX traders never open: the relative performance of the two countries' stock markets.
The link is direct. A country's equity index is the market's real-time vote on that economy's growth, earnings, and risk appetite, and a currency is a claim on the same economy. When Australian stocks are crushing Canadian stocks, capital is voting for Australian growth over Canadian, and that vote tends to show up in AUDCAD before the slower macro data confirms it. The ratio of the two indices packages this into one number. The old article "Using Ratios as Trading Signals" built the ratio tool for any two markets; this applies it to the specific case where the two markets are national equity indices and the thing you trade is the cross between their currencies.
Why a ratio and not the two indices separately
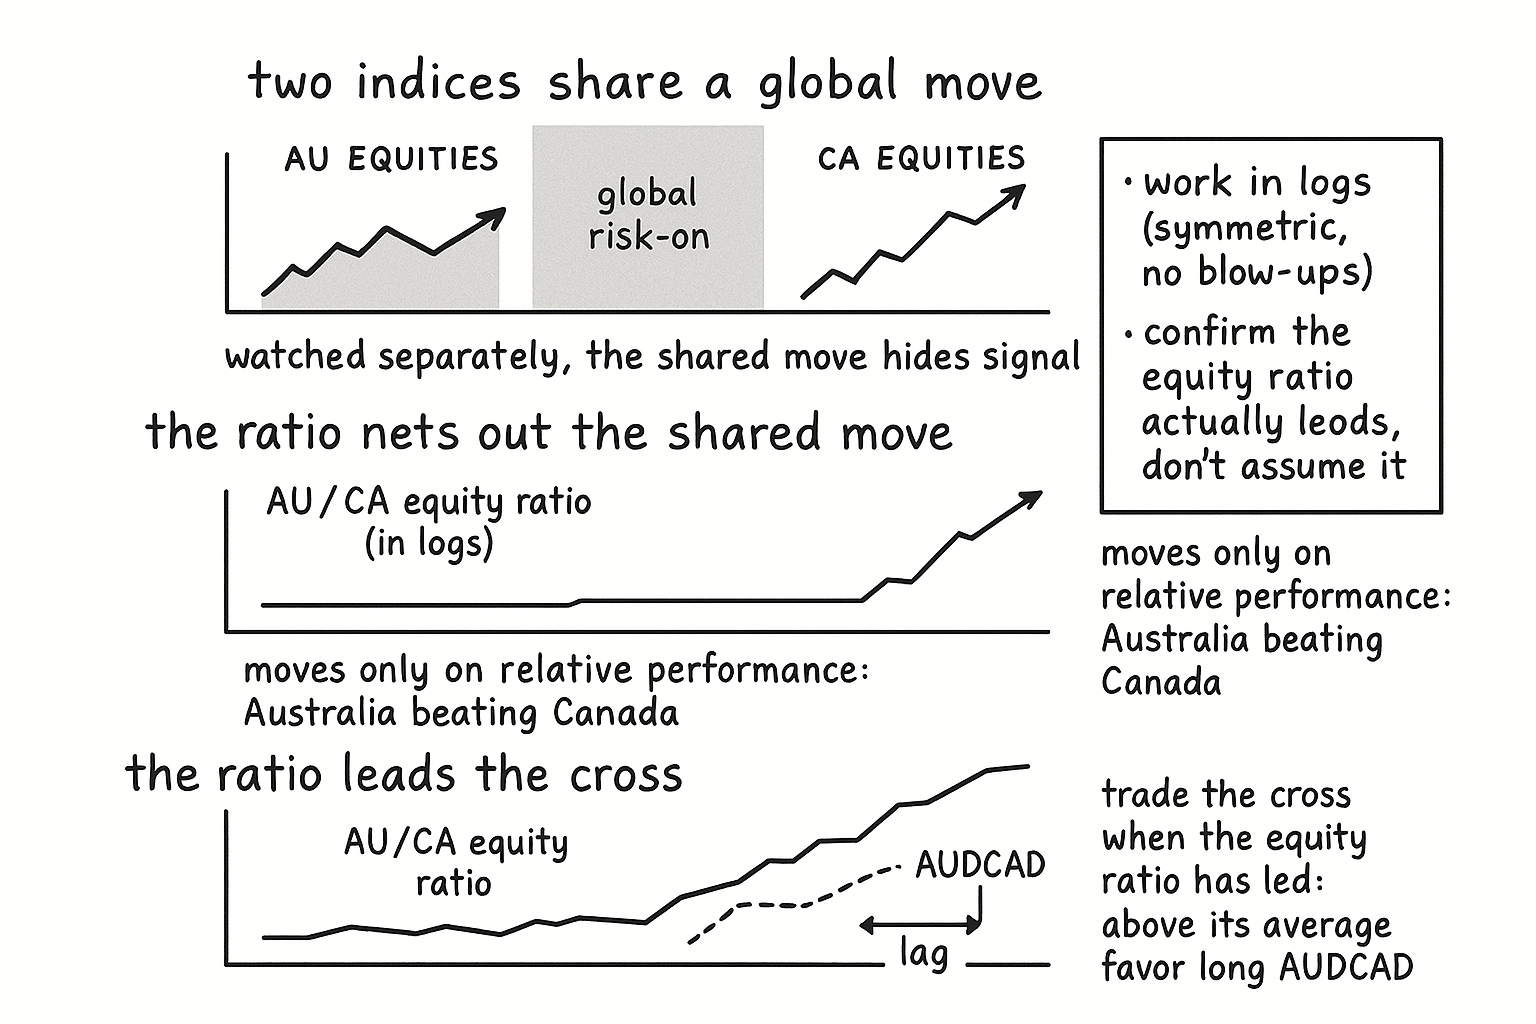
Watching both indices side by side tells you less than dividing one by the other, because most of what moves any equity index on a given day is global, not local. A risk-off session sells Sydney and Toronto together; a risk-on session buys both. That shared global move is exactly the part that does not help you pick AUDCAD over CADAUD, and the ratio nets it out.
$$ R_t = \frac{\text{AU equity index}_t}{\text{CA equity index}_t} $$
Dividing the Australian index by the Canadian one cancels the move both share and keeps only the part where one outperformed the other. If both rise 2% on a global risk-on day, the ratio is flat and tells you correctly that nothing changed between the two economies. If Australian stocks rise 2% while Canadian stocks are flat, the ratio rises and isolates the Australia-specific outperformance, which is the signal that should map to a stronger Aussie against the loonie. The ratio moves only on relative performance, the same netting-out the old article "Using Ratios as Trading Signals" used to isolate rotation while ignoring the overall direction of either leg.
One detail decides whether the ratio is well-behaved: work in logs. A raw ratio is asymmetric, a 10% Australian outperformance and a 10% Canadian outperformance do not produce mirror-image moves, and a near-zero denominator can spike it. Take the log and the ratio becomes the difference of two log indices, symmetric and additive, the same fix the old article "Using Ratios as Trading Signals" applied to keep ratio signals honest.
$$ r_t = \ln(\text{AU index}_t) - \ln(\text{CA index}_t) $$
The log ratio is just the log of one index minus the log of the other, and its changes are the difference in the two indices' returns. A rising log ratio means Australian equities are out-returning Canadian equities, full stop, with the global component already removed.
Turning the ratio into a cross signal
Signal off the ratio the way you would signal off any price: compare it to its own recent average and read direction from which side it sits. Above its moving average, Australian equities are in a relative uptrend, favor long AUDCAD; below, favor short. The old article "Using Ratios as Trading Signals" framed this as a ratio oscillator, where the sign of the gap gives direction and the distance gives stretch.
$$ \text{Osc}_t = r_t - \frac{1}{N}\sum_{i=t-N+1}^{t} r_i $$
The oscillator is the current log ratio minus its N-bar average, positive when Australia is outperforming relative to its own recent norm and negative when it is lagging. A worked feel: say the AU/CA log ratio sits 0.8% above its 50-day average and rising, while AUDCAD has not yet moved. That is the equity market voting for the Aussie ahead of the cross, a long-AUDCAD candidate where the confirmation comes from a market structurally independent of FX. The same logic runs the AUDNZD case the source driver list points to, the Australia-New-Zealand equity performance ratio against the Australia-New-Zealand cross.
There is a lead-lag premise underneath this, and it has to be tested rather than assumed. The signal pays only if the equity ratio leads the currency cross, the way the old article "Lead-Lag Relationships in Global Markets" demanded a clean peak at a positive lag that survives out of sample. Measure the lagged cross-correlation between the equity ratio and the cross and confirm the equity ratio actually moves first; if the currency leads the equities, you have the relationship backwards and the signal is a coincident readout, not a forecast.
Where it earns its keep and where it lies
The reason this beats staring at the rate differential is timeliness and independence. Equity indices trade continuously and reprice growth and risk in real time, so the relative-performance ratio updates faster than the macro data that drives the textbook commodity-and-rates story for these crosses. It is also a structurally independent source from the FX chart, the property the old article "Why Cross-Asset Signals Beat Isolated Chart Reading" identified as the whole point of intermarket work: a second information source that is imperfectly correlated with the first carries off-chart information and can lead. For a cross where the dollar has been cancelled away, the equity ratio is one of the cleaner remaining independent reads.
The failure modes are specific and they stack. The lead-lag is fragile and drifts, the standing warning from "Lead-Lag Relationships in Global Markets," so the equity ratio that led AUDCAD last year may move coincidentally or lag this year, and a fixed rule built on a stale lead bleeds. Trading hours misalign, because Sydney, Toronto, and the FX market are open at different times, so a daily ratio splices non-synchronous closes and the apparent lead can be a timing artifact rather than information, the synchronization problem the old article "Cross-Pair Signals: Can EUR Predict GBP?" flagged for crosses. The equity-currency link inverts in regimes: in a commodity-driven episode the loonie may track crude and the Aussie may track metals while their stock indices say something different, and in a full risk-off panic both indices and the cross collapse onto global risk appetite and the relative story vanishes, the correlation-to-one regime from the old article "Why FX Traders Must Watch Gold, Rates, and Equities." The moving-average length is the usual arbitrary dial trading reactivity against whipsaw, and crosses like AUDCAD are less liquid with wider spreads than the USD majors, so the per-trade edge has to clear a real cost before any of this is worth trading. Use the equity ratio as a confirming tilt on a cross you have an independent reason to trade, gate it on the rolling lead-lag and the rolling correlation, and treat it as one read among the rates and commodity drivers rather than a standalone trigger.
KEY POINTS
- A cross has no dollar in it, so the question is what drives the pure relative story. The relative performance of the two countries' equity indices is a fast, independent read, because a stock index is the real-time vote on an economy and a currency is a claim on the same economy.
- Use the ratio of the two indices, not the two indices separately, because most of any index's daily move is global and shared; dividing nets out the shared move and keeps only the relative outperformance that should map to the cross.
- Work in logs, so the ratio becomes the difference of two log indices: symmetric, additive, and immune to near-zero-denominator blow-ups.
- Signal off the ratio like a price: above its moving average favor long the cross (e.g. long AUDCAD when AU equities outperform), below favor short, with the oscillator's sign giving direction and distance giving stretch. AUDNZD against the AU/NZ equity ratio is the same construction.
- The signal pays only if the equity ratio leads the cross. Measure the lagged cross-correlation and confirm a clean lead that survives out of sample; if the currency leads, the signal is coincident, not predictive.
- It beats watching the rate differential on timeliness (equities reprice continuously) and independence (a second source uncorrelated with the FX chart), the core intermarket payoff.
- Limits stack: the lead-lag drifts, trading hours misalign so daily ratios splice non-synchronous closes, the link inverts in commodity-driven and risk-off regimes, the MA length is arbitrary, and crosses carry wider spreads. Use it as a gated confirming tilt, not a standalone trigger.
References
- Ratio analysis and relative strength (Wikipedia: Relative strength)
- The Equity Differential Factor in Currency Markets
- Stock prices and exchange rate dynamics (Phylaktis & Ravazzolo)
- Cross-correlation (Wikipedia)
- Logarithm (Wikipedia: log ratios)
- Trading Systems and Methods - Perry Kaufman (Amazon)
- Cybernetic Trading Strategies - Murray Ruggiero (Amazon)
- The Art of Currency Trading - Brent Donnelly (Amazon)
- Exchange Rate, Equity Prices and Capital Flows
- What Do Stock Markets Tell Us About Exchange Rates?
- Co-movement Between Equity Index and Exchange Rate: Fresh Evidence from COVID-19 Era
- Dynamic Relationship Between Exchange Rates and Stock Prices for Selected Developed and Emerging Markets
- International Risk Sharing and the Exchange Rate
- Currency Returns, Institutional Investor Flows, and Exchange Rate Dynamics
- Market Macrostructure: Institutions and Asset Prices
- A Relative Value Trading System Based on a Correlation and Rough Set Analysis for the Foreign Exchange Futures Market