9.19 The Term Structure of Prediction-Market Strategy and Crowding: Why the Fastest Three Bots Take 80 Percent
A structural arb that printed in October can be worthless by February with no change to the math. Regimes, the term structure of strategy, and crowding decide who actually gets paid, and usually it is not you.
A structural arbitrage that printed money in October 2024 was worthless by February 2025, and nothing about the math changed. The polytope was still the polytope, the projection still returned a positive guaranteed profit, the solver still converged. What changed was the market around the trade: the volume dried up, the same opportunity now had eight bots racing for it instead of one, and the election that generated all the incoherence had resolved. A trade is not just its own edge. It lives inside a regime, and the regime decides whether that edge is real, shrinking, or already gone to someone faster than you.
This is the meta-layer the earlier pillar articles skipped. "Arbitrage Is Just Projection" tells you the trade exists. "Execution Is Part of Expected Value" tells you whether you can fill it. Neither tells you whether you should be trading this class of opportunity at all right now, or whether you are the third bot in line about to provide exit liquidity to the first two. That is a regime question, and regime sits at rank six in "The Nine Sources of Edge, Ranked Cleanest to Dirtiest" for a reason: it is a meta-edge that improves everything above it, and its single most valuable output is the instruction to not trade.
Four regimes, and the strategy each one allows
Markets sit in qualitative states. Each state sets how much edge is on the table, how fast it decays, and which strategy survives. Detection is not exotic: keep rolling-window statistics on three numbers, spread, order-book depth, and your own fill rate, and let regime boundaries trigger a change in behavior.
| Regime | Spread | Depth | Edge density | Typical trigger |
|---|---|---|---|---|
| Deep liquidity | under 2 cents | over $10K | Moderate | Normal conditions |
| Thin liquidity | 2 to 8 cents | $500 to $5K | Low | Off-hours |
| Liquidity crisis | over 8 cents | under $500 | High if executable | News shocks |
| Crowded arbitrage | Normal | Normal | Very low | Post-discovery |
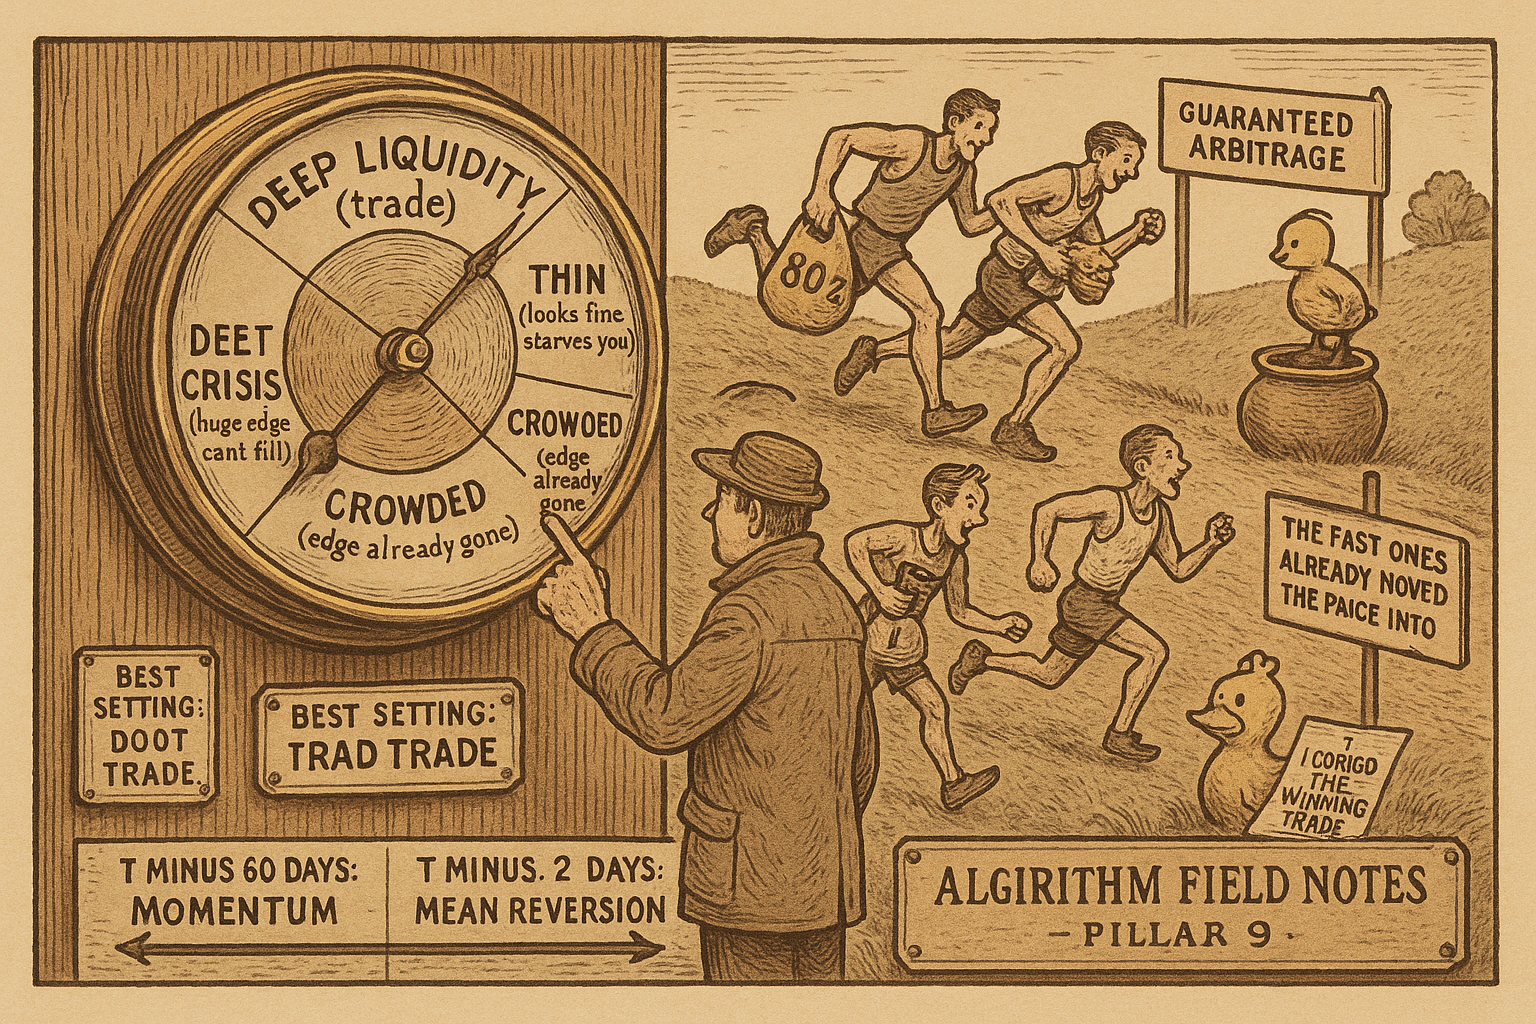
Read the table by what it does to your fill. Deep liquidity is where you want to be: tight spreads, enough depth to size into, moderate but reliable edge. Thin liquidity looks fine on a screenshot and starves you on execution, because the depth is not there to absorb your order without slippage eating the edge. Liquidity crisis is the seductive one: spreads blow out to 8 cents and the mispricings look enormous, but the depth collapses under $500, so the edge is real and mostly unfillable, and the same news shock that opened the gap is moving the fair value under you. Crowded arbitrage is the quiet killer, spread and depth look normal, but the edge density has been competed to near zero because everyone already found this opportunity. The old article "Volatility Regimes and Strategy Survival" makes the general version of this point on continuous instruments: a rule is only ever profitable conditional on the regime that produced its backtest, and the old article "Regime Coverage: Why Your Backtest Needs Different Market States" is the warning that a backtest spanning only one of these four states is lying to you about the other three.
Volatility clusters, so track it cheaply
You do not need a full GARCH fit to know whether the market is calm or violent. Volatility clusters, big moves follow big moves, and an exponentially weighted moving average of squared returns captures that with one parameter.
$$ \hat{\sigma}^2_t = \lambda\, \hat{\sigma}^2_{t-1} + (1 - \lambda)\, r_t^2, \qquad \lambda \approx 0.94 $$
Read that as: today's variance estimate is mostly yesterday's estimate, nudged by today's squared return. The parameter lambda near 0.94 sets the memory, recent returns matter more than old ones, and nothing ever fully leaves the average. High reading means the market is volatile and prices are swinging; low reading means it is calm. This is the same non-stationarity the old article "Why Volatility Is More Non-Stationary Than Trend" hammers on: your volatility estimate drifts faster than any directional signal, so you re-measure it constantly rather than assuming a fixed level.
The term structure of strategy: momentum far out, reversion near the close
Here is the genuinely prediction-market-specific insight, the one continuous-instrument traders do not get for free. A prediction contract has a resolution date, and how far you sit from that date flips which strategy pays.
Far from resolution, more than 30 days out, information arrives directionally. New polls, new endorsements, new fundamentals keep pushing the true probability one way as the picture clarifies, and the price trends toward the eventual answer. Momentum pays. Near resolution, inside about 7 days, most of the real information is already priced. What is left is noise, and the price overreacts to every rumor and every thin-market print, snapping back once the noise clears. Mean reversion pays. The old article "High Noise Markets Are Mean-Reversion Markets" gives the statistical backbone: when the efficiency ratio drops and price churns without net progress, you fade the moves rather than follow them, which is exactly the near-resolution state.
A strategy that works at 60 days to resolution can lose money at 2 days to resolution, on the same market, with no bug in the code. The date is a state variable, and a system that does not condition on time-to-resolution is running one strategy across two regimes that demand opposite behavior.
Crowding: the fastest few take almost everything
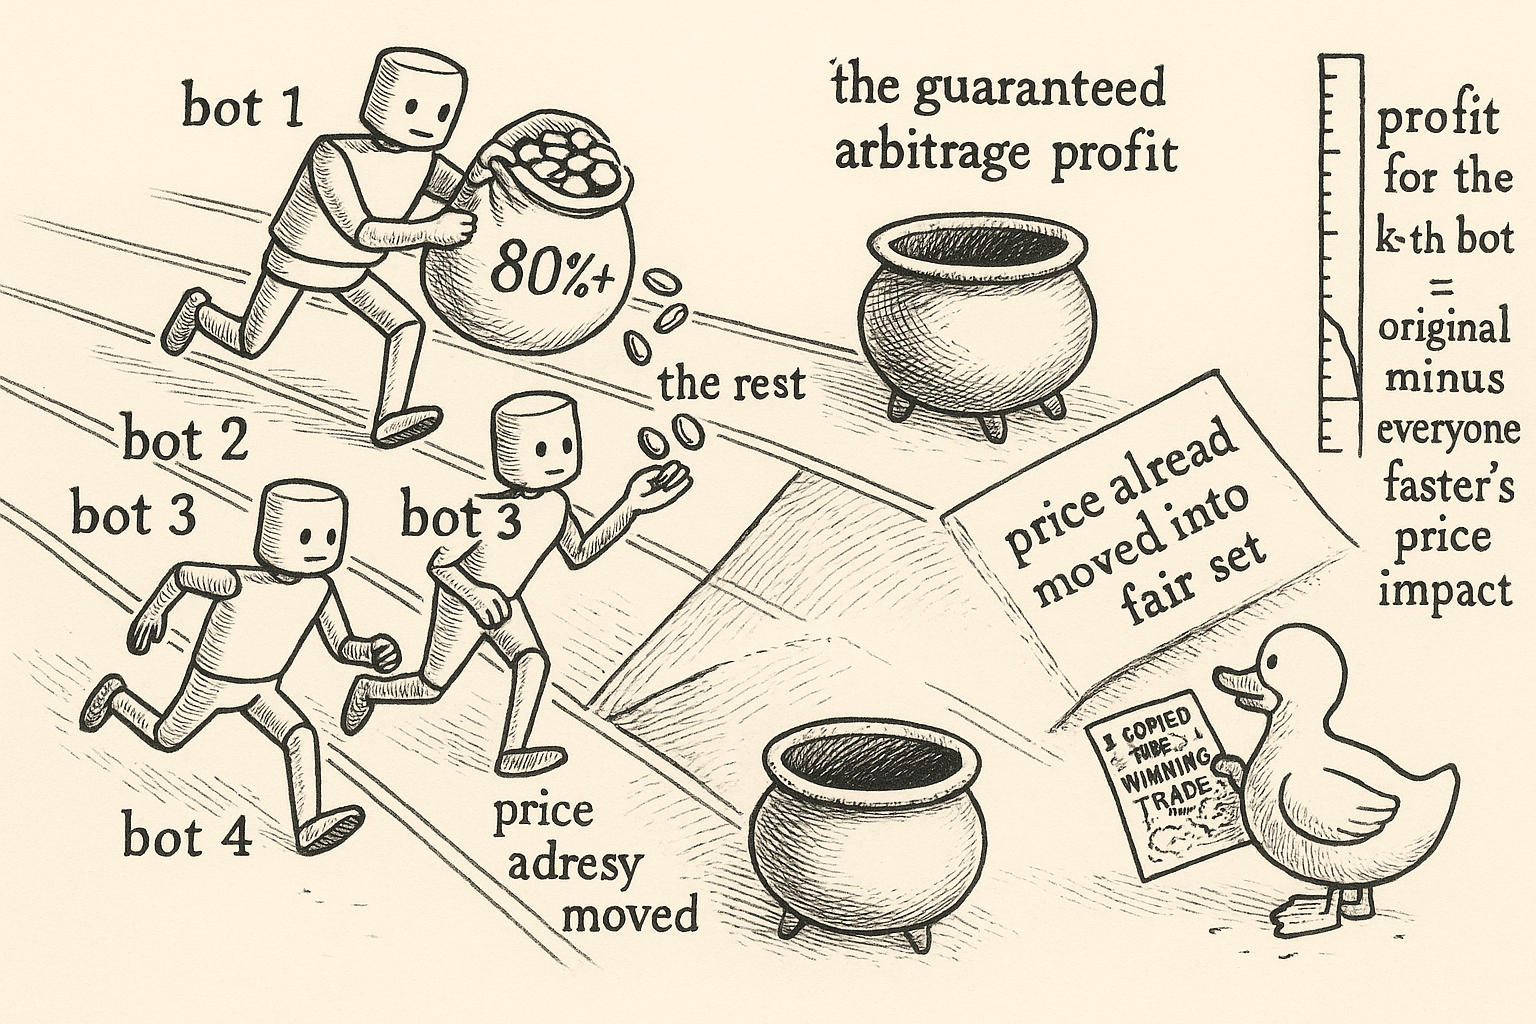
Structural arbitrage does not pay everyone who finds it. It pays whoever gets there first, and the math of that is brutal. When N arbitrageurs detect the same opportunity, each fill moves the price against the next arrival, so the k-th trader inherits a shrunken profit.
$$ \Pi_k \approx \Pi_0 - \sum_{j < k} |\delta_j| \cdot \lambda $$
Read that as: the k-th bot's profit is the original guaranteed profit minus the cumulative price impact of every faster bot ahead of it, where lambda is the Kyle impact parameter measuring how much each unit of order size moves the price. The first bot captures near the full edge. By the time the trade reaches the third or fourth arrival, the earlier fills have already dragged the price into the fair set, and the latecomers trade against a book that has moved against them. The fastest two or three traders capture over 80 percent of the available profit; the rest lose money on adverse fills. This is the same winner-take-most concentration that "Execution Is Part of Expected Value" describes when it explains why copytrading an arb is exit liquidity: by the time you see the block that captured it, you are trader number five, and the equation above already spent your edge.
The Polymarket data from the 2024 to 2025 election cycle shows exactly this shape. Of the roughly $40M in estimated arbitrage profit extracted, a small handful of accounts took a large share, on the order of 20 percent for the top ten by one reading of the breakdown, with a long tail of smaller extractors, many of whom likely finished net negative after failed executions ate their gas and slippage. Structural arbitrage is a math problem where the answer is guaranteed and the profit still goes to almost no one, because the guarantee is on the trade, not on your latency.
The four-phase life of an arbitrage
Every structural edge ages through the same four phases, and knowing which phase you are in tells you whether to scale up, hold, or walk away.
| Phase | Participants | What it feels like |
|---|---|---|
| 1. Discovery | Few | High profit per trade, almost no competition |
| 2. Adoption | Growing | Profit per trade falling; infrastructure is the differentiator |
| 3. Saturation | Many | Profit roughly equals execution cost; only the fastest survive |
| 4. Commodity | Stable | Returns converge to the risk-adjusted market rate |
In discovery you make outsized returns because you are alone. In adoption the returns fall and the game quietly becomes an infrastructure race, faster detection, faster solver, faster submission, which is the moment most retail participants should recognize they have already lost. In saturation the profit per trade drops to roughly the cost of executing it, so only the lowest-latency operators clear anything, and everyone else is trading for the exchange's benefit. In commodity the edge is gone as an edge. This is "The Death of the Single-System Trader" told in fast-forward: the old article warns that every edge decays and the death is a quiet grind rather than a crash, and structural arbitrage runs that entire arc in months instead of years because the competition is automated and the opportunity is public the instant a price prints.
The $40M number is a snapshot of a specific window, April 2024 to April 2025, which included a US Presidential election, the moment of maximum volume and maximum structural inconsistency across thousands of hastily-listed related markets. That was a discovery-and-adoption window for the whole category. Do not backtest against it and assume the same edge density persists in a quiet off-cycle month, because you would be extrapolating discovery-phase profits into a saturated market.
Not trading is a position
The discipline to abstain during crowded or thin-liquidity regimes beats the ability to detect one more marginal opportunity. That is the whole guideline, and it is worth more than it sounds. A detector that fires on every incoherence will hand you a stream of trades that are real arbitrages and losing propositions at once, because they are crowded, or thin, or two days from resolution running a momentum rule that should be a reversion rule. The old article "When to Switch Off a Trading System" frames the general skill: knowing the conditions under which your edge does not exist, and standing down when they hold, is a rule in its own right. In prediction markets the abstain signal is concrete, wide spreads with no depth, normal spreads with competed-away edge density, or a resolution date close enough to flip your strategy's sign. Reading that signal and doing nothing is a regime edge. It is source number six, and it protects every edge ranked above it.
KEY POINTS
- A trade lives inside a regime, and the regime decides whether its edge is real, shrinking, or already captured. Regime is a meta-edge (source six in the nine) whose most valuable output is the instruction to not trade.
- Four regimes, detected from rolling spread, depth, and fill-rate stats: deep liquidity (trade here), thin liquidity (looks fine, starves execution), liquidity crisis (huge edge, mostly unfillable, fair value moving), crowded arbitrage (normal book, edge competed to near zero).
- Track volatility cheaply with an EWMA of squared returns, lambda near 0.94. Volatility clusters and drifts faster than any directional signal, so re-measure it constantly.
- The term structure of strategy is prediction-market specific: more than 30 days from resolution, information arrives directionally and momentum pays; inside 7 days, information is priced and price overreacts to noise, so mean reversion pays. The same market flips which strategy works as the date approaches.
- Crowding math: the k-th arbitrageur's profit is the original minus the cumulative price impact of everyone faster. The fastest two or three take over 80 percent; latecomers trade adverse fills. In the 2024 to 2025 cycle a handful of accounts took roughly a fifth of about $40M, with a long net-negative tail.
- Every structural edge ages through discovery, adoption, saturation, commodity. The $40M was a discovery-and-adoption snapshot around a Presidential election. Do not extrapolate that edge density into a quiet off-cycle month.
- Abstaining is a position. Wide-and-shallow, competed-away, or wrong-side-of-the-term-structure conditions are concrete signals to stand down, and standing down protects every cleaner edge above regime in the hierarchy.