2.45 Nyquist and Aliasing: The Hard Limit on What Price Data Can Show
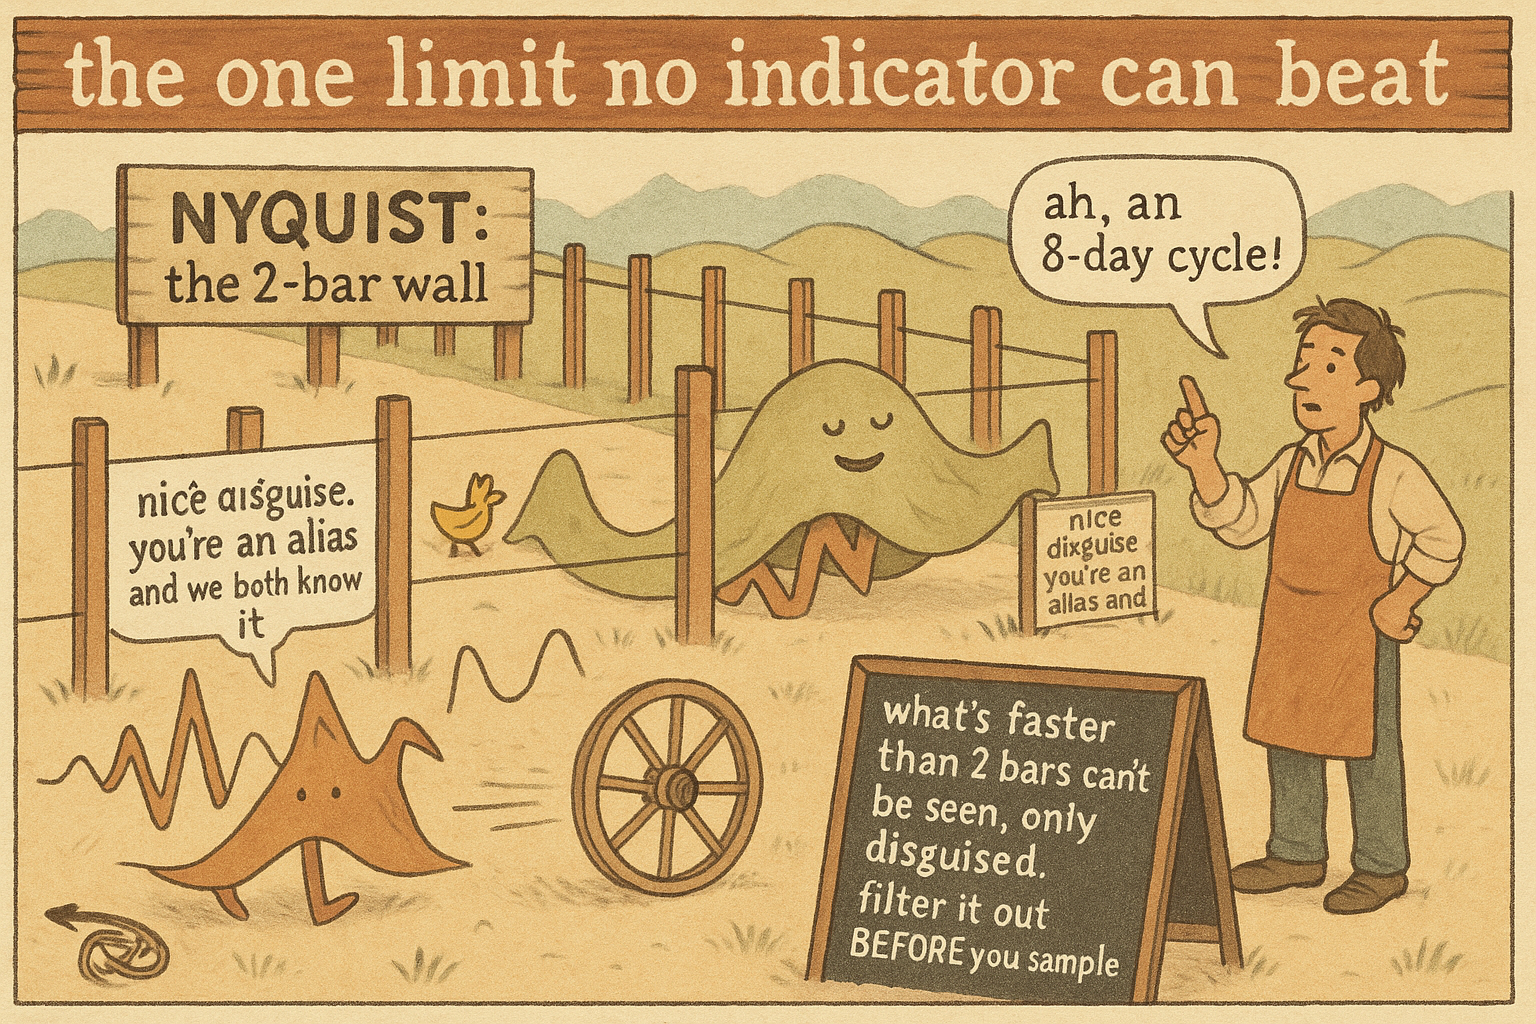
Sample once per bar and the fastest cycle you can see is 2 bars (Nyquist). Anything faster aliases: it folds down and masquerades as a slow cycle that was never there, and no filter can unmask it.
The old article "The Frequency Response of Trading Indicators" taught you to read which cycles a filter passes, and the old article "Dominant Cycle Estimation Without Astrology" measured which cycle the market is running. Both assume the cycle you care about is even visible in your data. This article is about the cycles that are not, and can never be, because of how you sampled. Take one price per bar and there is a hardest, fastest cycle your data can physically represent. Anything faster does not just get missed. It disguises itself as a slower cycle that was never there, and you cannot tell the fake from the real after the fact. This is the one limit in the pillar that no filter, no indicator, and no cleverness can beat.
The Nyquist limit falls out of the SMA's own math
You do not need to import the sampling theorem on faith; it drops out of a filter you already know. The simple moving average's transfer response, factored, contains a term that is a sum of consecutive samples, and that term hits zero at a specific frequency.
$$ e^{-j2\pi f} + 1 = 0 \;\Longrightarrow\; \cos(\pi f) = 0 \;\Longrightarrow\; f = 0.5 $$
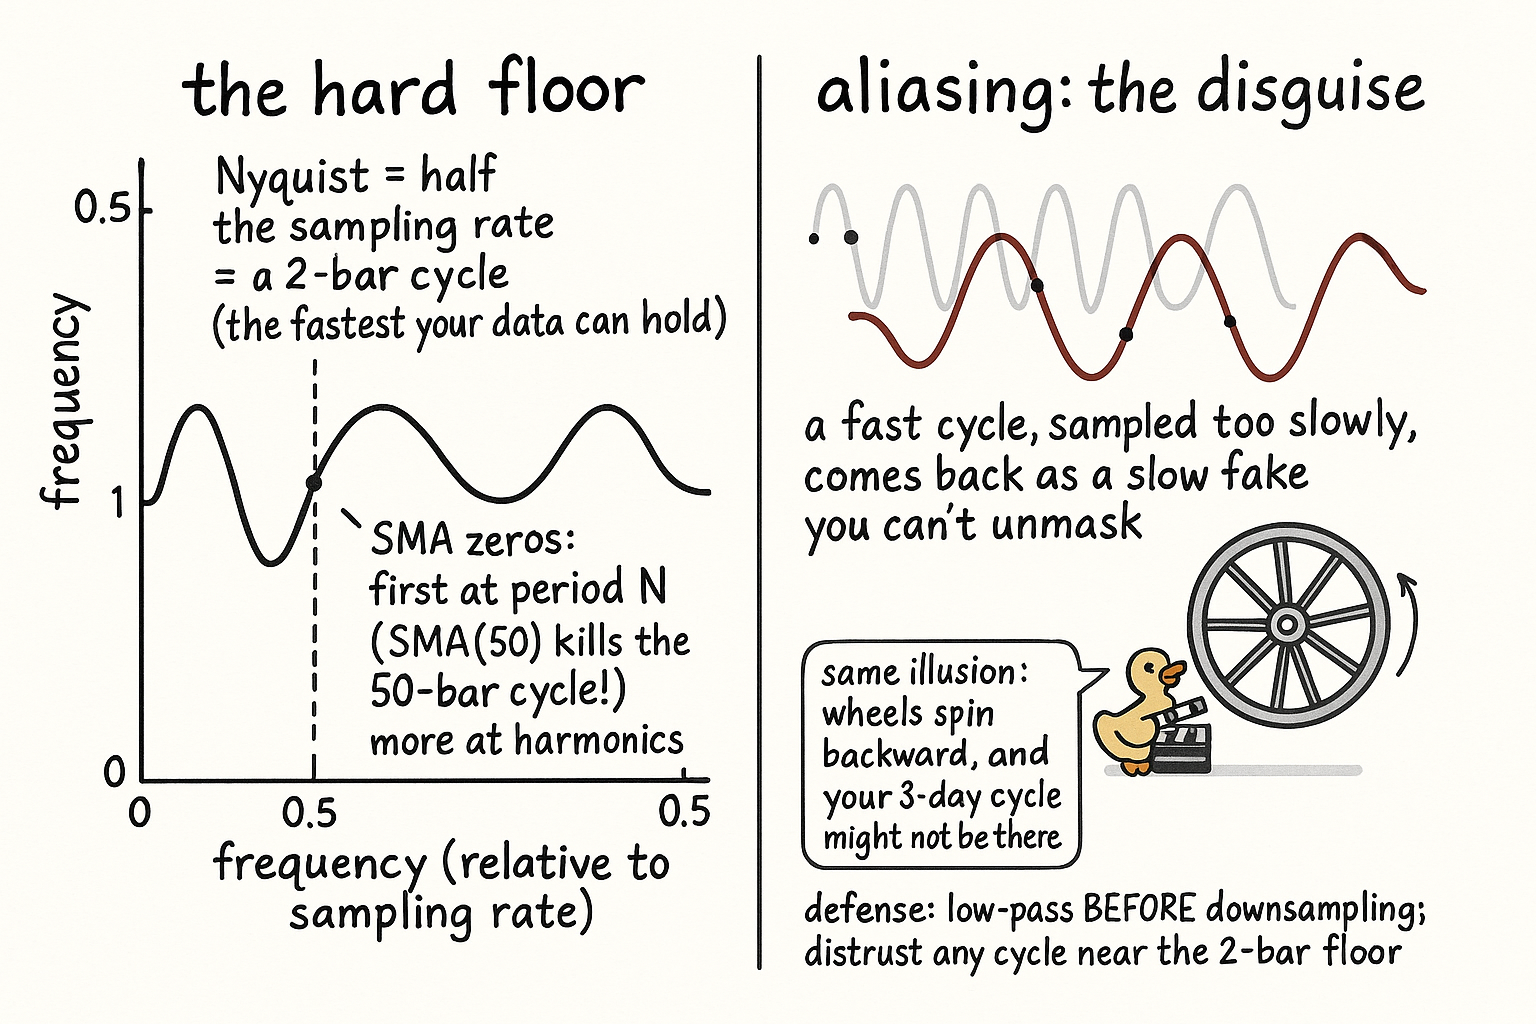
The frequency f here is measured relative to the sampling rate, so f equals 0.5 means a cycle at half the sampling frequency. With one sample per bar, half the sampling rate is a cycle that completes every two bars: up on one bar, down on the next. That two-bar cycle is the fastest thing sampled data can hold, and it has a name, the Nyquist frequency, half the sampling rate.
$$ \text{shortest period your data can represent} = 2\ \text{bars} $$
This is why every indicator period has a floor and a "3-bar cycle" is already scraping the bottom of what exists. It is not a tuning preference or a noise problem. It is arithmetic forced by sampling once per bar, and it holds for daily closes, five-minute bars, and ticks alike, each relative to its own bar.
Where the zeros sit, and why the SMA is blind on a grid
The same factoring shows the full pattern of what an SMA can and cannot see. The N-bar simple moving average has an amplitude response that is a ratio of sines, and it goes to zero at evenly spaced frequencies.
$$ H(f) = \frac{\sin(N\pi f)}{N\sin(\pi f)}, \qquad \text{first zero at } f = \frac{1}{N}\ (\text{period } N) $$
The first zero sits at the frequency whose period equals the filter length, so an SMA of length 50 completely annihilates the 50-bar cycle, the one a naive trader might think it was built to track. More zeros follow at the harmonics. This is the deeper reading of the old article "Why the SMA Is Often a Terrible Smoother": the SMA is not merely leaky, it is stone blind at a grid of specific periods, and the Nyquist zero at the two-bar period is just the last member of that grid.
Aliasing: the fast cycle that comes back wearing a disguise
The Nyquist limit would be harmless if too-fast cycles simply vanished. They do not. A cycle faster than the two-bar floor folds down and reappears as a slower cycle that was never in the market. This is aliasing, and you have seen it outside trading: wagon wheels that spin backward in old films, helicopter rotors frozen on video. The camera samples too slowly, so a fast rotation shows up as a slow or reversed one. Your daily close does the same to any intraday cycle faster than two days. It folds the fast content down into the visible band, where it masquerades as a multi-day cycle indistinguishable from a genuine one.
The damage is concrete and the dominant-cycle tools are exposed to it. A periodogram or an autocorrelation estimator can report a clean, convincing 8-day cycle that is an artifact, a fast intraday oscillation folded down by sampling, not a feature of the market. Because the fake is structurally identical to a real cycle in your sampled series, no amount of staring at the daily data can separate them. The defense has to happen before or at sampling: low-pass filter to kill the too-fast content before you downsample it, so it cannot fold, and distrust any measured cycle sitting near the two-bar floor, where aliased junk and real signal pile up together. The honest stance is the one the old article "Why Market Cycles Are Evanescent" set: a measured cycle is a hypothesis about structure, and a cycle near Nyquist is a hypothesis you should suspect of being a sampling ghost. The filter machinery in this pillar is powerful, but it operates only on what survived sampling, and what sampling discarded or disguised is gone for good.
KEY POINTS
- Sampling once per bar sets a hard ceiling: the fastest cycle your data can represent completes in two bars, at half the sampling rate. This is the Nyquist frequency, and it drops out of the SMA's own factored response (cos(pi f) = 0 at f = 0.5).
- The limit is arithmetic, not a tuning choice. Every indicator period has a two-bar floor, so a "3-bar cycle" is already at the edge of what physically exists, for daily, intraday, or tick bars alike.
- An SMA of length N has its first response zero at the N-bar period and more at the harmonics, so it is stone blind at a grid of specific periods (SMA(50) annihilates the 50-bar cycle), the deeper failure behind the old article "Why the SMA Is Often a Terrible Smoother."
- Cycles faster than the two-bar floor do not vanish; they alias, folding down to masquerade as slower cycles that were never in the market, the wagon-wheel effect.
- This poisons cycle measurement: a periodogram can report a clean cycle that is an aliased artifact, structurally indistinguishable from a real one in the sampled series, the old article "Dominant Cycle Estimation Without Astrology" included.
- Defense happens at or before sampling: low-pass to kill too-fast content before downsampling so it cannot fold, and distrust any measured cycle near the two-bar floor. Filters work only on what survived sampling.
References
- Statistically Sound Indicators for Financial Market Prediction - Timothy Masters (Amazon)
- Cycle Analytics for Traders - John Ehlers (Amazon)
- Nyquist-Shannon sampling theorem (Wikipedia)
- Aliasing and the wagon-wheel effect (Wikipedia)
- The Scientist and Engineer's Guide to Digital Signal Processing: ADC and Nyquist
- Sampling, the Nyquist limit, and anti-alias filtering (Stanford CCRMA)