2.68 The Price Change Oscillator
Short-term movement minus a long-term baseline, normalized by ATR, reads volatility expansion against contraction. But normalize too hard and you delete the very regime signal you wanted: the stationarity-vs-information trade-off, with a dial.

Volatility is not one number. The volatility of the last five bars and the volatility of the last hundred are different things, and the gap between them carries information that neither level carries alone. The price change oscillator measures that gap: short-term movement minus a long-term baseline, so a reading tells you whether the market is moving faster or slower than it has been. The trap waiting inside it is the one the old article "When Forcing Stationarity Destroys Information" warned about, because the obvious way to clean this indicator up also throws away the exact signal you built it to capture.
Short-term movement against a long-term baseline
Start with a measure of absolute volatility that does not care about direction. Take the log price changes, take their absolute values, and average them over a window. That mean absolute log change is how much the market has been moving per bar, up or down treated alike. Compute it twice, once over a short window and once over a long one, and subtract.
$$ v_K = \overline{\,\lvert \Delta \log P \rvert\,}_{\text{over } K \text{ bars}} \qquad \text{Raw} = \frac{v_{\text{short}} - v_{\text{long}}}{c \cdot \text{ATR}} $$
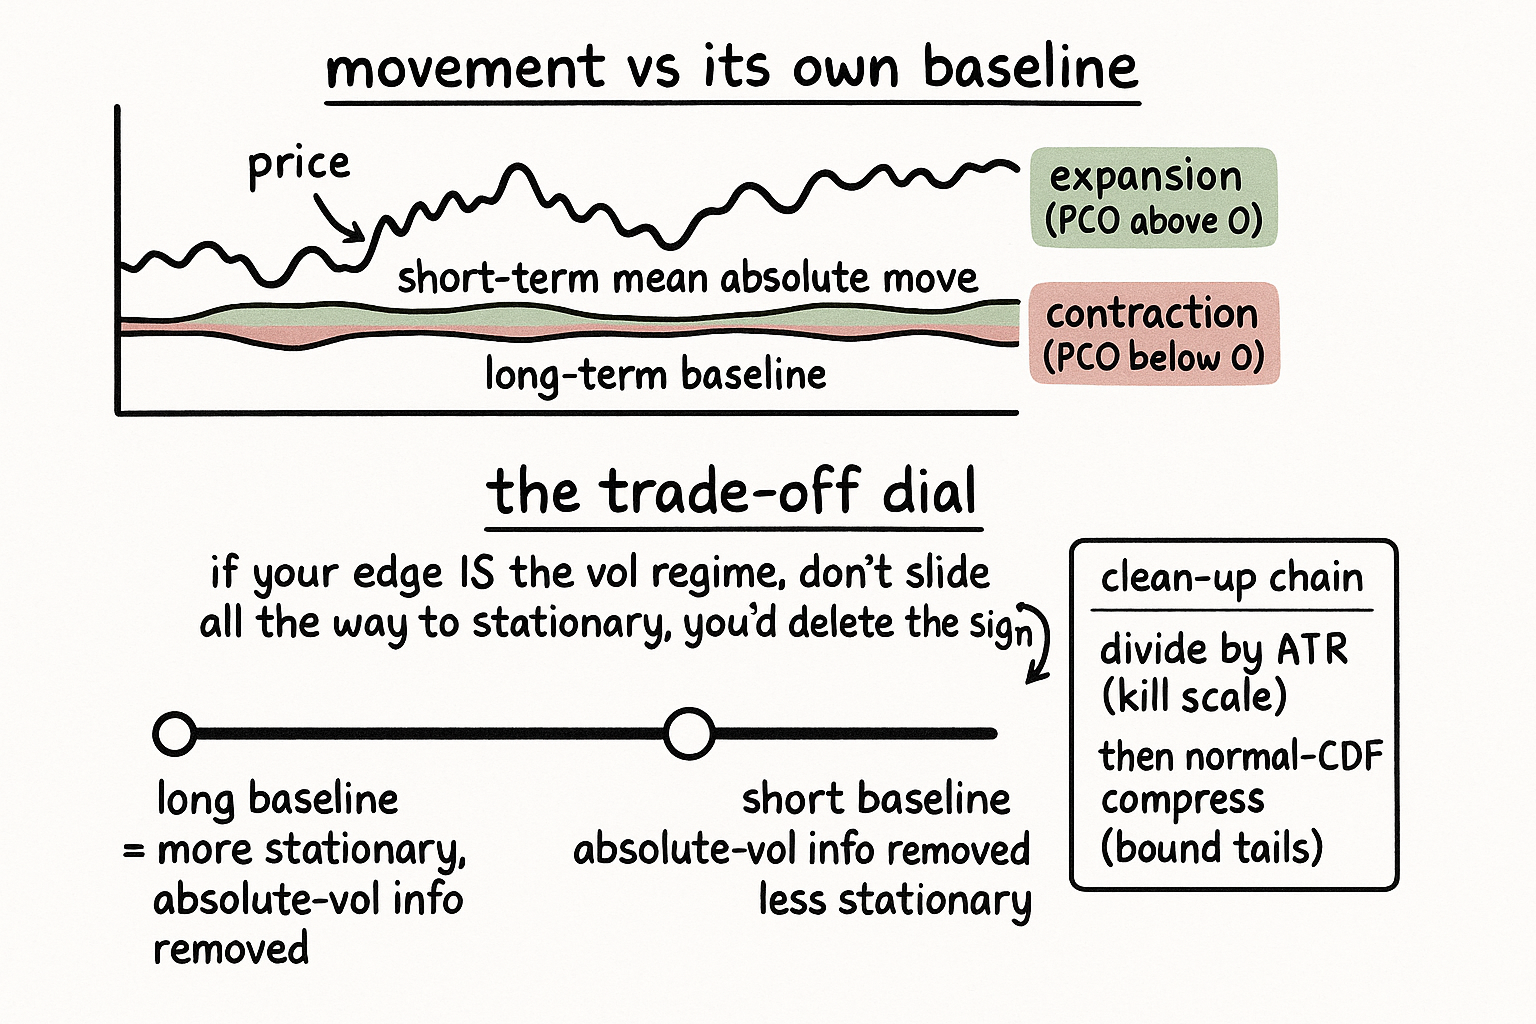
The term v is the mean absolute log change over its window, so v-short is recent movement and v-long is the baseline, and the raw oscillator is their difference. Read the difference directly. Positive means the market is moving faster than its baseline, a volatility expansion; negative means it has gone quieter than usual, a contraction. The long-term measure is doing the work of context: a mean absolute move of half a percent means nothing until you know whether the baseline is a quarter percent or a full percent, and subtracting the baseline puts the short-term reading in that context.
Why ATR has to be the denominator
The difference of two absolute-volatility measures is still an absolute quantity, and that is a problem. Double every price change in the series and the difference doubles too, so the raw subtraction is contaminated by the overall scale and the volatility regime, the exact non-stationarity that makes a feature read differently across years and across instruments. The old article "Why ATR Normalization Is More Than a Volatility Trick" gave the structural fix, and it applies here without modification. Divide by ATR. ATR is in the instrument's own units and scales with the same movement the numerator measures, so dividing one by the other cancels the scale and leaves a dimensionless number that means the same thing on a quiet bond and a frantic crypto pair.
There is one more cleanup. Different window lengths and different short-to-long ratios produce difference values on different scales, which hurts a model that wants its features in similar ranges and wrecks any attempt to compress outliers, because you cannot place the usual values in the linear part of a squashing transform if you do not know the usual range in advance. So a self-adjusting scaling constant, set from the lookback and the window ratio, normalizes the range before compression, and then a gentle transform bounds the tails.
$$ \text{PCO} = 100 \cdot \Phi\big(4 \cdot \text{Raw}\big) - 50 $$
The capital phi is the normal cumulative distribution function, the factor of four sets the compression strength so the bulk of the values land in its near-linear middle, and the final scaling recenters the bounded output at zero. The result is a tidy oscillator that reads volatility expansion above zero and contraction below.
The stationarity-versus-information trade-off
Here is where the old article on forcing stationarity earns its place on the page. Dividing by ATR makes the oscillator stationary by removing the absolute volatility level, and removing that level is sometimes exactly wrong. If your strategy's edge lives in the absolute volatility regime itself, in the fact that the market is in a high-vol or low-vol world right now, then normalizing that information away leaves you with a clean, stationary feature that no longer knows the thing you needed it to know. The old article called this violating-signal non-stationarity: the non-stationary component is the signal, and aggressive stationarization destroys it.
The price change oscillator hands you the dial for this trade-off rather than hiding it. The short-to-long window ratio controls how much absolute information survives. A short baseline relative to the long one keeps the oscillator close to a pure regime reading that still carries some level information; a long, slow baseline strips more of it out in exchange for a more stationary feature. You decide based on what your strategy trades, the same prescription the old article gave: stationarize the part of the feature that is orthogonal to your edge, and leave the part your edge lives in alone. There is no universally correct setting, only a setting correct for what you are trying to predict.
Where it sits and how to set it
The price change oscillator is a volatility-regime feature, which is why it leans toward the portfolio and risk side as much as the indicator side: it tells you the market's character has shifted, not where price is going. Use it to switch behavior between calm and turbulent regimes, to widen or tighten risk, or as a conditioning variable that tells a directional signal which world it is operating in. The windows and the ratio are the parameters that matter, and they are not free choices, because they set both the timescale of the regime you detect and how much absolute volatility information you keep, so tie them to the strategy and test the raw-versus-normalized feature the way the old stationarity article prescribed, comparing performance to confirm you did not normalize away your edge. ATR must be computed without peeking at the current bar's full information in a way that leaks, and the compression must be calibrated on training data only, or the bounded, well-mannered oscillator is quietly lookahead-poisoned.
KEY POINTS
- The price change oscillator measures short-term mean absolute log movement minus a long-term baseline, so it reads above zero on volatility expansion and below zero on contraction.
- The long-term measure supplies context: a given amount of recent movement is only fast or slow relative to the baseline the market has been running.
- The difference is still an absolute quantity that doubles if all moves double, so divide by ATR to cancel scale and volatility regime, the structural fix from the old ATR-normalization article, then compress with the normal CDF to bound tails.
- ATR normalization can destroy the signal: if your edge lives in the absolute volatility regime, stationarizing it away leaves a clean feature that no longer knows what you need, the violating-signal case from the old forcing-stationarity article.
- The short-to-long window ratio is the trade-off dial between stationarity and retained absolute information; set it from what your strategy trades and test raw versus normalized to confirm you kept the edge.
- It is a volatility-regime conditioning feature, not a directional signal; tie the windows to your strategy and keep the construction causal.