2.46 The SMA Is a Least-Squares Straight-Line Fit
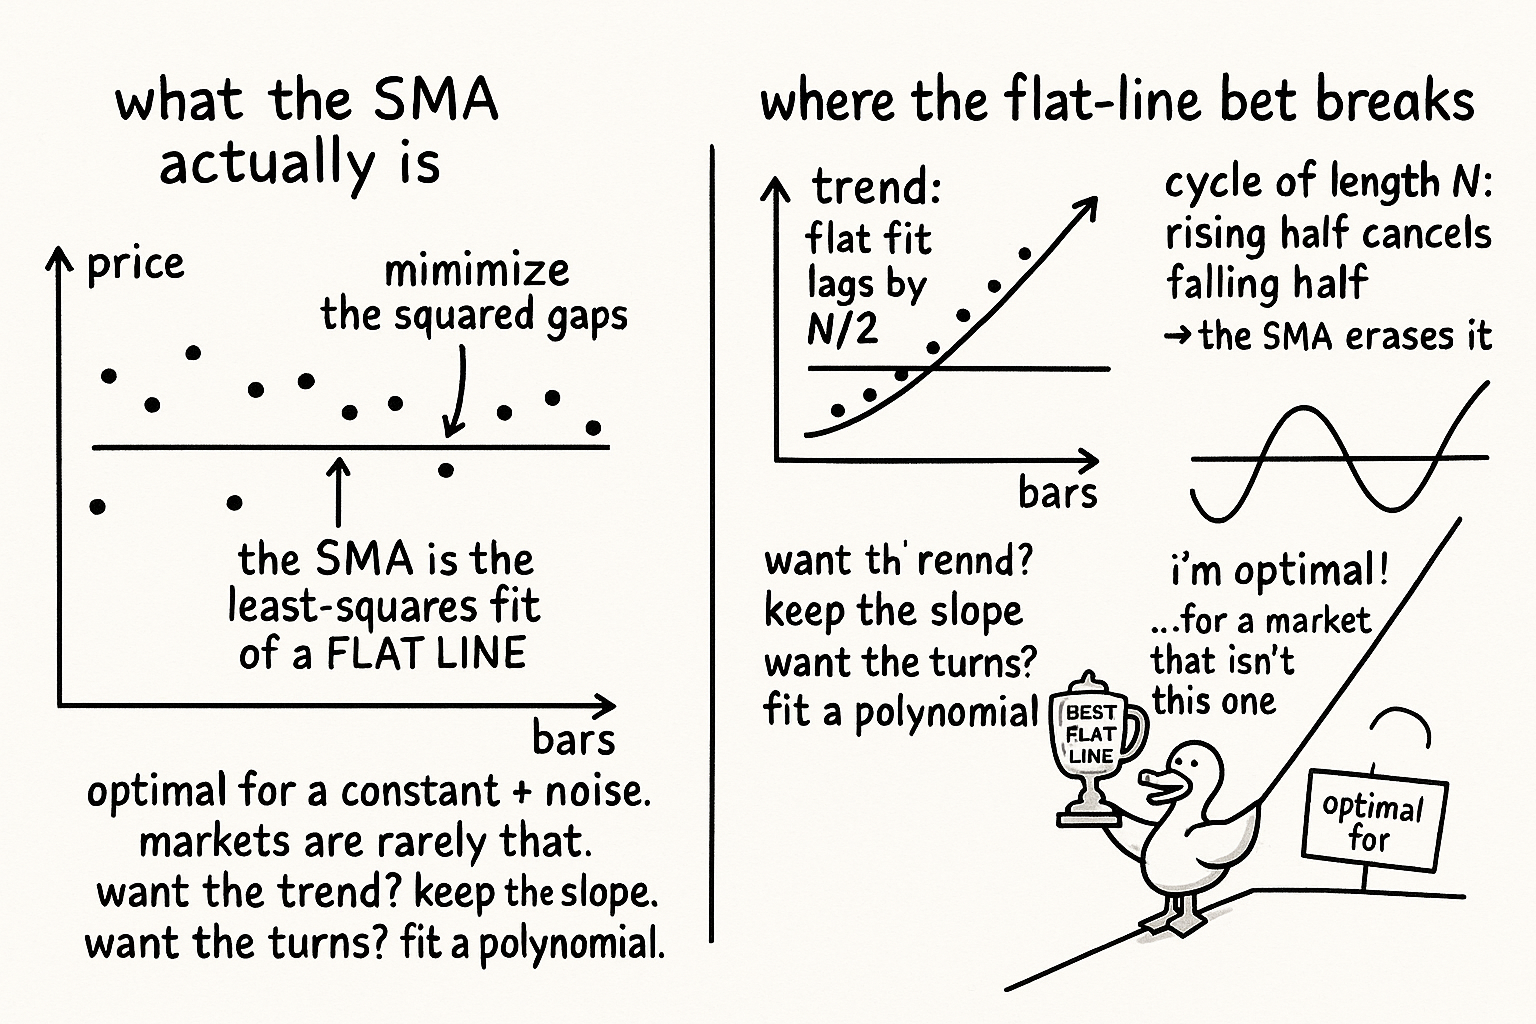
The SMA is the optimal least-squares fit of a flat line to the window: the intercept is the average. But that assumes the market is constant plus noise, so it lags trends and erases matched cycles.

The old article "Why the SMA Is Often a Terrible Smoother" tore into the simple moving average for its leaky sidelobes and its blind spots. This article comes at it from the other direction, and the result is more damning, not less. The SMA is not a crude hack. It is the provably optimal answer to a precise statistical question: what single number best represents this window of data if you assume the data is a flat line plus noise? That is the catch hiding inside the praise. The SMA is optimal for a model of the market that is almost never true, and pinning down which model it is optimal for tells you precisely when it lies.
Set up the fit, and the average falls out
Suppose you try to design a filter by fitting a straight line to the data in the window. A straight line is y equals m x plus b, and the best fit minimizes the sum of squared differences between the line and the data points.
$$ F = \sum \big[\,y - (mx + b)\,\big]^2 $$
To minimize, take the derivative of F with respect to the two unknowns, the slope m and the intercept b, and set each to zero. Solve, and the intercept b, the value of the fitted line at the center of the window, comes out as one specific quantity.
$$ \frac{\partial F}{\partial b} = 0 \;\Longrightarrow\; b = \frac{1}{N}\sum y = \text{the average of the data points} $$
The least-squares intercept is the plain average. So the simple moving average is not an approximation to a best fit; it is the best fit, in the least-squares sense, of a constant to the window. It is also the special case of a non-recursive filter with all coefficients equal to one over N, and its impulse response is finite, so it is a finite impulse response filter. The arithmetic that traders treat as the most basic thing in technical analysis is a solved optimization problem.
Optimal, but for a model markets violate
Here is where the endorsement turns into the indictment. The SMA is the optimal estimator of the level only if the data in the window is genuinely a constant corrupted by zero-mean noise. That is the model least squares assumed when it handed you the average. Ask whether markets look like a constant plus noise over any window long enough to matter, and the answer is no. Over a trend, the data is a sloped line, and the best constant fit to a sloped line sits at the center of the window, which means the SMA reports the trend as it was N over two bars ago. That is the lag from the old article "The Hidden Cost of Every Moving Average: Lag," now derived from first principles: the SMA lags because it is fitting a flat line to data that is not flat, and the flat line's best guess for "now" is the middle of the past.
Over a cycle it is worse than lag. The least-squares constant averages a rising half against a falling half, and when the window length matches the cycle the two halves cancel, which is why the SMA has a response zero at the period equal to its length. The SMA does not just smooth the cycle; it can erase it. Both failures, the lag in trends and the annihilation of matched cycles, are not defects in the SMA. They are correct behavior for the constant-plus-noise model, applied to data that is neither constant nor only noise. The tool is doing exactly what it was optimized to do, against a world that does not match its assumption.
What to do with a tool that is optimal for the wrong question
The lesson generalizes past the SMA and is the real payoff. Every smoother is the optimal estimator for some implicit model of the underlying. The SMA assumes a local constant. Fit a straight line and keep the slope and you get a linear-trend estimator that does not lag a trend, a least-squares moving average, at the cost of more noise. Fit a local polynomial and you get a Savitzky-Golay smoother that preserves curvature, peaks, and turns the SMA flattens. The question is never "is this smoother good," it is "does this smoother's hidden model match what my data does locally." When you choose the SMA you are betting the market is locally flat, and that bet is wrong precisely in trends and cycles, the two regimes you most want to read.
So the practical rules are sharp. Use the SMA when you actually want the local mean and believe the underlying is roughly flat over the window, for a noise-floor estimate or a slow reference level, not for tracking a trend or timing a cycle. When you want the trend, fit the line and keep the slope rather than averaging it away. When you want to preserve turns, fit a polynomial. And whenever someone defends the SMA as "optimal in the least-squares sense," finish the sentence they left off: optimal for a constant, which the market is not. The old article "Why the SMA Is Often a Terrible Smoother" said the SMA leaks; this says why even its optimality is a trap, because it is the right answer to a question the market refuses to ask.
KEY POINTS
- Fit a straight line to a window by minimizing the sum of squared errors, and the least-squares intercept (the line's value at the window center) works out to the plain average. The SMA is the provably best least-squares fit of a constant.
- It is also a non-recursive (FIR) filter with equal one-over-N coefficients. The most basic indicator in technical analysis is a solved optimization problem.
- That optimality holds only under one model: the data is a constant plus zero-mean noise. Markets over any meaningful window are not constant.
- Over a trend, the best flat fit sits at the window center, so the SMA reports the level N over two bars ago. The lag of the old article "The Hidden Cost of Every Moving Average: Lag" is derived: it lags because it fits a flat line to non-flat data.
- Over a cycle whose length matches the window, the flat fit averages the rising and falling halves to zero, so the SMA can erase the cycle, the response zero at period N. Both failures are correct behavior for the wrong model.
- Every smoother is optimal for some implicit model. Want the trend, fit a line and keep the slope (least-squares moving average); want to preserve turns, fit a polynomial (Savitzky-Golay). Use the SMA only when you truly want the local mean of roughly flat data.
References
- Statistically Sound Indicators for Financial Market Prediction - Timothy Masters (Amazon)
- Cycle Analytics for Traders - John Ehlers (Amazon)
- Ordinary least squares and the normal equations (Wikipedia)
- Simple linear regression: solving for slope and intercept (Wikipedia)
- Savitzky-Golay filter: least-squares polynomial smoothing (Wikipedia)
- The Scientist and Engineer's Guide to Digital Signal Processing: Moving Average Filters